Scientia Agricultura Sinica ›› 2026, Vol. 59 ›› Issue (20): 4617-4629.doi: 10.3864/j.issn.0578-1752.2026.20.014

• SPECIAL FOCUS: THEORY, TECHNOLOGY AND PRACTICE OF LOW-CARBON TRANSITION IN AGRIFOOD SYSTEMS AND ENTERIC METHANE MITIGATION IN RUMINANTS • Previous Articles     Next Articles

Carbon Footprint of Soybean and Soybean Meal Production in China Based on Life Cycle Assessment (2014—2023)

NIAN XueYan1,2(), ZHANG Qing2, ZHANG JianGuo2, TU Yan1()   

  1. 1 Institute of Feed Research, Chinese Academy of Agricultural Sciences/Sino-US Joint Lab on Nutrition and Metabolism of Ruminant/Key Laboratory of Feed Biotechnology, Ministry of Agriculture and Rural Affairs, Beijing 100081
    2 College of Forestry and Landscape Architecture, South China Agricultural University, Guangzhou 510642
  • Received:2025-11-26 Accepted:2026-05-06 Online:2026-10-16 Published:2026-10-21
  • Contact: TU Yan

Abstract:

【Objective】Soybeans and soybean meal play a pivotal role in China's feed industry. To systematically evaluate the carbon footprint characteristics of China's soybean sector, this study aimed to determine the carbon footprint of soybean and soybean meal production in China's major producing regions. It analyzed their spatio-temporal evolution patterns and key emission source composition, thereby providing a scientific basis for formulating regionally differentiated emission reduction strategies and establishing low-carbon feed supply chains. 【Method】Employing the Life Cycle Assessment (LCA) methodology, the production carbon footprint of China's major soybean-producing provinces from 2014 to 2023 was calculated. The economic price allocation method was used to quantify the carbon footprint of soybean meal and analyze its composition, systematically identifying key emission sources and regional differentiation characteristics. 【Result】(1) China's soybean production carbon footprint exhibited distinct spatiotemporal differentiation and a declining trend. The average carbon footprint per unit area across China's major soybean-producing regions from 2014 to 2023 was 1 011.23 kg CO2-eq/hm2, with an average carbon footprint per unit yield of 0.222 kg CO2-eq/kg. Spatially, the North China region exhibited a high carbon footprint per unit area, with Hebei Province recording the highest value (1 674.58 kg CO2-eq/hm2); while per-yield carbon footprints were elevated in parts of Northeast and North China, with Shanxi Province recording the highest value (0.38 kg CO2-eq/kg). Chronologically, most production areas nationwide exhibited declining carbon footprint trends, with Shanxi (annual average decrease of 0.028 kg CO2-eq/kg in per-yield footprint) and Hebei (annual average decrease of 59.13 kg CO2-eq/hm2 in per-area footprint) showing the most significant reductions. (2) Soybean meal carbon footprint primarily originated from cultivation, exhibiting marked provincial variations. The national average stands at 0.129 kg CO2-eq/kg, ranging from 0.049 to 0.379 kg CO2-eq/kg across provinces. Soybean cultivation accounted for over 95% of soybean meal's total lifecycle carbon emissions. (3) Carbon footprint composition exhibited distinct regional characteristics with identifiable key emission sources. Nationally, direct N2O emissions from farmland (19.96%) and compound fertilizer production (17.81%) constituted the two largest contributors. Regional variations were pronounced: in Northeast China and Inner Mongolia, emissions were dominated by agricultural diesel (10.00%-17.19%) and compound fertilizer production (20.47%-28.31%); in Hebei and Shandong, irrigation electricity consumption accounted for the highest proportion (20.14%-36.54%); while pesticide production emissions were prominent in Anhui, Henan and other areas (27.09%-30.15%). Transportation and processing collectively contributed less than 5%. 【Conclusion】 Optimizing soybean field management was the key to reducing the carbon footprint of soybean meal. To achieve coordinated emissions reduction across the entire industrial chain, it is necessary to promote the transformation of agricultural production systems centered on fertilizer efficiency enhancement, water-saving irrigation, and green pest control, while simultaneously building low-carbon supply chains to guide emissions reduction from the source. In practical implementation, the efforts should be tailored to the specific emission structure characteristics of different regions. In Northeast China and Inner Mongolia, the focus should be on promoting new energy agricultural machinery and controlled-release fertilizers; in Hebei and Shandong, water-saving irrigation technologies should be prioritized; in Anhui and Henan, where pesticide emissions was higher, green pest control systems should be strengthened. This tailored strategy combination ensured effective implementation of full-chain emission reduction pathways across regions. Advancing the soybean industry's green transformation requires establishing a full-chain low-carbon pathway from field production to feed consumption, thereby providing a clear direction for reducing animal production carbon emissions at the feed source.

Key words: soybeans, soybean meal, carbon footprint, life cycle assessment, spatiotemporal characteristics, low carbon emissions reduction

Table 1

Planting area and production of major soybean producing provinces (autonomous regions) in China, 2014-2023"

省(自治区)Provinces (Autonomous Regions) 2014 2015 2016 2017 2018 2019 2020 2021 2022 2023
河北Hebei 12.2/25.0 11.6/22.6 6.9/16.0 7.0/17.1 8.8/20.9 9.4/22.6 9.0/21.5 6.7/16.3 9.8/23.0 11.4/24.5
山西Shanxi 19.2/20.7 13.7/20.2 19.2/23.9 13.1/17.1 15.1/23.6 12.9/21.5 12.0/20.8 9.2/14.4 11.2/18.9 11.7/20.1
内蒙古Inner Mongolia 74.5/115.0 81.3/126.7 92.3/150.8 98.9/162.6 109.4/179.4 119.0/226.0 120.2/234.7 89.3/168.5 122.2/245.4 123.5/244.4
辽宁Liaoning 6.4/13.3 6.0/13.4 7.0/14.8 7.4/19.3 7.4/18.0 8.4/21.3 10.3/23.9 10.4/25.1 11.5/27.0 12.3/28.0
吉林Jilin 21.4/37.4 18.2/31.5 18.8/37.3 22.0/50.2 27.9/55.1 34.5/70.1 32.1/64.2 25.3/54.7 31.0/70.0 32.9/74.4
黑龙江Heilongjiang 279.3/514.0 266.1/498.8 322.3/562.8 373.5/689.4 356.8/657.8 427.9/780.8 483.2/920.3 388.8/718.8 493.2/953.4 488.7/927.8
安徽Anhui 85.2/115.0 82.1/126.8 83.0/125.3 85.9/130.2 65.0/97.5 63.6/95.7 60.5/92.9 58.7/90.9 61.1/94.2 63.2/97.8
山东Shandong 15.0/36.7 13.7/34.8 13.3/35.7 12.0/32.1 15.4/43.3 18.4/52.4 18.9/55.5 18.3/53.5 21.5/58.1 23.2/64.0
河南Henan 38.2/51.5 34.4/46.8 34.1/46.9 34.5/50.4 38.6/95.6 39.5/98.2 37.5/93.4 33.3/74.8 36.4/84.9 38.1/92.7
陕西Shaanxi 14.4/23.1 14.3/15.8 15.1/24.3 15.2/23.9 15.2/23.9 15.1/23.4 15.1/23.6 15.1/25.1 17.4/30.5 17.7/31.7

Fig. 1

System boundary of carbon footprint calculation"

Table 2

Allocation parameters for primary and secondary products in the soybean system [22-23]"

作物产出
Crop yield
质量分数
Mass fraction (%)
价格(元/t)
Price (Yuan/t)
豆粕Soybean meal 32.94 4303.25
豆油Soybean oil 7.23 8780.00
大豆秸秆Soybean straw 59.82 860.00

Table 3

Carbon emission factors and parameters"

项目
Project
排放因子
Emission factor
单位
Unit
排放因子来源
Sources of emission factors
大豆种子Soybean seeds 1.18 kg CO2-eq/kg [25]
除草剂Herbicide 10.15 kg CO2-eq/kg [25]
杀虫剂Insecticide 16.61 kg CO2-eq/kg [25]
杀菌剂Fungicide 10.57 kg CO2-eq/kg [25]
氮肥Nitrogen fertilizer 1.53 kg CO2-eq/kg [26]
磷肥Phosphate fertilizer 1.63 kg CO2-eq/kg [26]
钾肥Potash fertilizer 0.65 kg CO2-eq/kg [26]
复合肥Compound fertilizer 1.77 kg CO2-eq/kg [26]
氮肥田间施用的N2O直接排放因子
Direct N2O emission factor for nitrogen fertilizers applied in the field
按区域划分
By region
kg N2O-N/(kg N) [27]
大气氮沉降排放N2O排放因子
Atmospheric nitrogen deposition emission N2O emission factor
0.01 kg N2O-N/(kg N) [27]
渗漏或径流损失的N的N2O排放因子
N2O emission factor for nitrogen losses from seepage or runoff
0.0075 kg N2O-N/(kg N) [27]
以NH3和NOx形式挥发的化肥氮比例
The proportion of nitrogen volatilised from fertilizers in the form of NH3 and NOx
0.1 [27]
氮肥以淋溶和径流损失比例
The proportion of nitrogen fertilizer lost through leaching and runoff
0.2 [27]
电力
Electricity
按省份划分
By province
kg CO2-eq/kWh [28]
柴油Diesel 3.10 kg CO2-eq/kg [29]

Table 4

Spatiotemporal variations in the carbon footprint of soybean cultivation in China, 2014-2023"

省(自治区)
Provinces (Autonomous Regions)
单位面积碳足迹
Carbon footprint per unit area (kg CO2-eq/hm2)
单位面积碳足迹年际变化率
Carbon footprint trend per
unit area (kg CO2-eq/hm2)
单位产量碳足迹
Carbon footprint per unit production (kg CO2-eq/kg)
单位产量碳足迹年际变化率
Carbon footprint trend per unit production (kg CO2-eq/kg)
安徽Anhui 681.21 -1.06 0.17 -0.002
河北Hebei 1674.58 -59.13 0.29 -0.014
河南Henan 655.88 -18.61 0.14 -0.017
黑龙江Heilongjiang 1012.43 -2.91 0.26 -0.002
吉林Jilin 1185.62 14.41 0.20 -0.003
辽宁Liaoning 1105.13 -9.21 0.18 -0.003
内蒙古Inner Mongolia 734.42 5.11 0.16 -0.004
山东Shandong 958.67 31.03 0.14 0.003
山西Shanxi 1121.45 -1.80 0.38 -0.028
陕西Shaanxi 982.90 19.39 0.30 -0.002

Table 5

Carbon footprint of soybean meal in China's major soybean producing provinces (autonomous regions), 2014-2023"

省(自治区)
Provinces
(Autonomous Regions)
碳足迹Carbon footprint (kg CO2-eq·kg-1)
最大值Max 平均值Mean 最小值Min 标准差SD
安徽Anhui 0.124 0.099 0.073 0.015
河北Hebei 0.218 0.165 0.123 0.029
河南Henan 0.179 0.084 0.049 0.040
黑龙江Heilongjiang 0.158 0.148 0.137 0.006
吉林Jilin 0.155 0.117 0.106 0.014
辽宁Liaoning 0.124 0.102 0.084 0.013
内蒙古Inner Mongolia 0.112 0.096 0.087 0.009
山东Shandong 0.099 0.081 0.071 0.009
山西Shanxi 0.379 0.228 0.162 0.074
陕西Shaanxi 0.241 0.175 0.139 0.032

Fig. 2

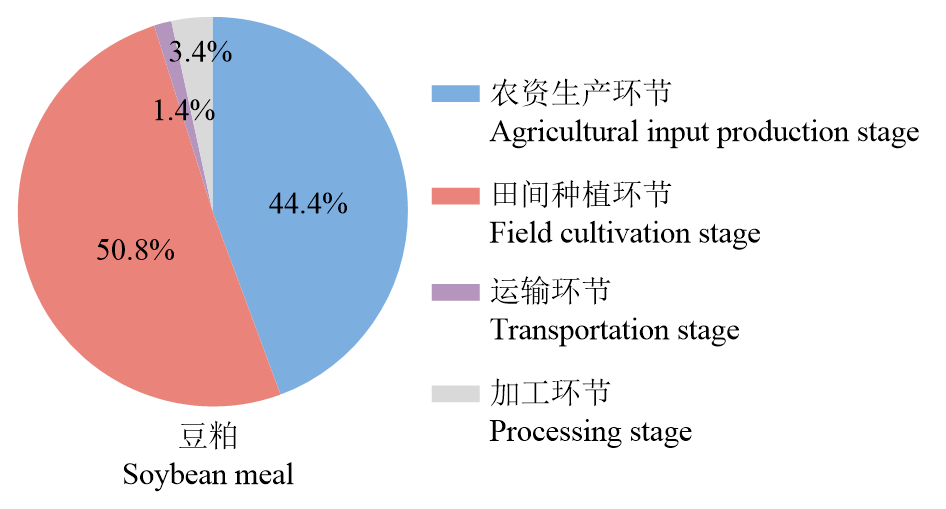
The proportion of carbon emissions attributable to agricultural input production, field cultivation, transportation, and processing stages"

Fig. 3

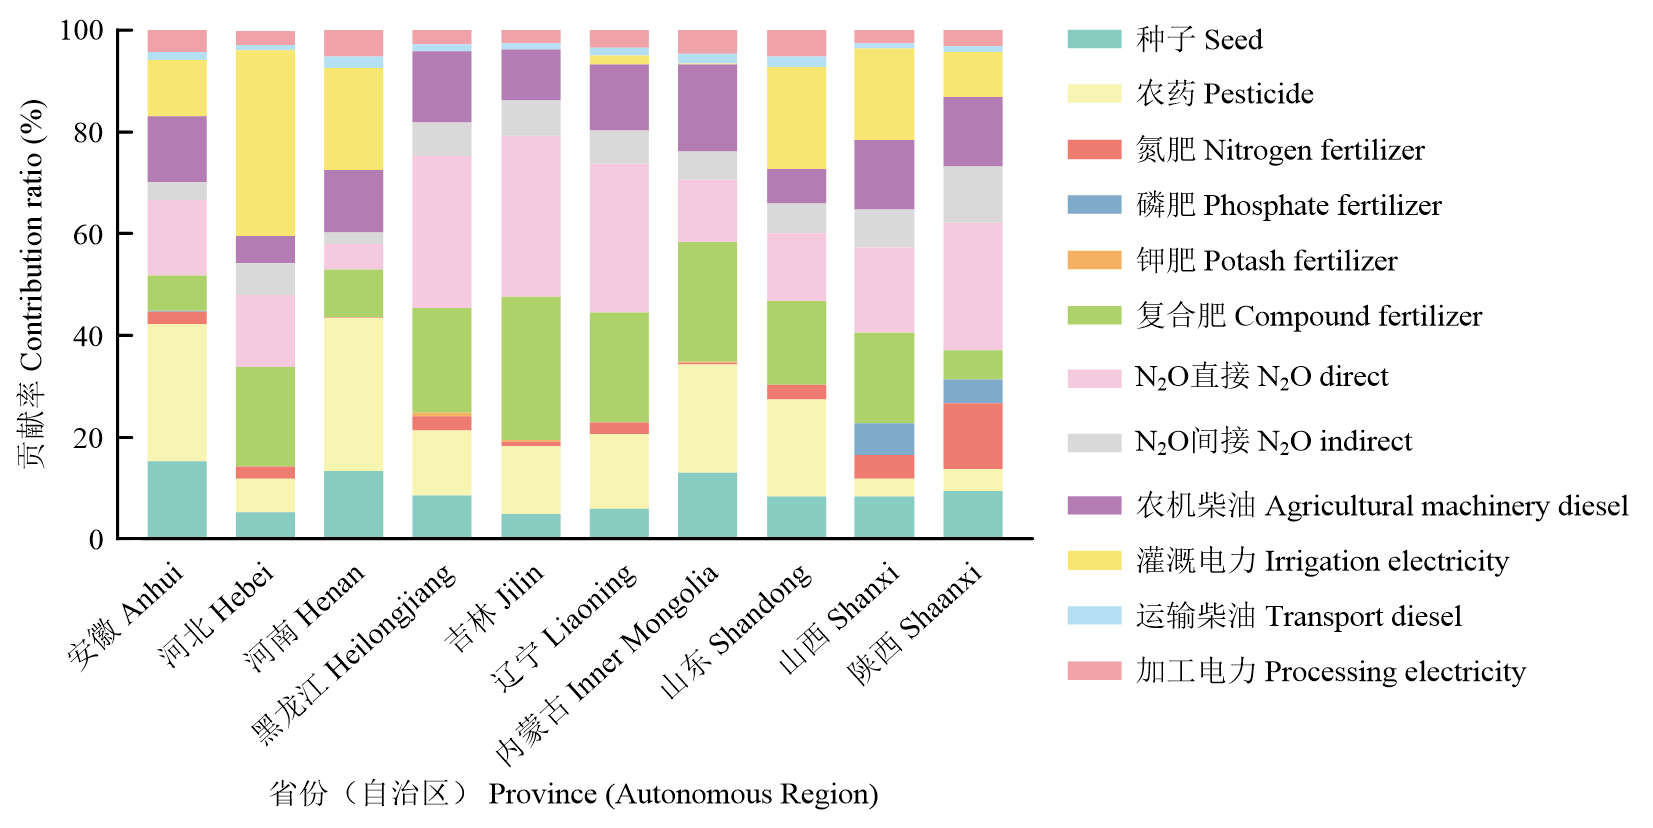
Carbon footprint composition of soybean meal"

Table 6

Impact of emission factors and allocation coefficients on the carbon footprint per unit of soybean meal production"

参数
Parameter
变化范围
Range of variation
变化率
Rate of change
单位产量豆粕碳足迹
Carbon footprint per unit of soybean meal produced
田间N2O直接排放因子
Direct N2O emission factor from cropland
+50% +9.98% 0.142
-50% -9.98% 0.116
农药生产排放因子
Pesticide production emission factors
+20% +2.71% 0.133
-20% -2.71% 0.126
复合肥生产排放因子
Emissions factor for compound fertilizer production
+20% +3.56% 0.134
-20% -3.56% 0.125
经济价值分配系数
Economic value distribution coefficient
+10% +10.00% 0.142
-10% -10.00% 0.116
[1]
He K, Li F L, Wang H, Ming R Y, Zhang J B. A low-carbon future for China’s tech industry[J]. Science, 2022, 377(6614): 1498-1499.
[2]
何可, 李凡略, 刘颖. “双碳” 目标下的畜禽养殖业绿色发展[J]. 环境保护, 2022, 50(16): 28-33.
He K, Li F L, Liu Y. Green development of livestock and poultry farming under the goal of carbon peaking and carbon neutrality[J]. Environmental Protection, 2022, 50(16): 28-33. (in Chinese)
[3]
Wei S, Fan J M, Tian Y F, Dong H M. Low-carbon development policies and achievements in the context of the livestock sector in China[J]. Frontiers of Agricultural Science and Engineering, 2024, 11(3): 367.
[4]
Gerber P J, Steinfeld H, Henderson B, Mottet A, Opio C, Dijkman J, Falcucci A, Tempio G. Tackling Climate Change through Livestock: A Global Assessment of Emissions and Mitigation Opportunities[M]. Rome: Food and Agriculture Organization of the United Nations (FAO), 2013.
[5]
中华人民共和国中央人民政府. 中共中央国务院关于进一步深化农村改革扎实推进乡村全面振兴的意见[Z]. (2025-02-24) [2026-01-13]. https://www.moa.gov.cn/ztzl/2025yhwj/zxgz_29966/202502/t20250224_6470398.htm.
The Central People's Government of the People's Republic of China. Opinion of the Central Committee of the Communist Party of China and the State Council on Further Deepening Rural Reform and Solidly Advancing the Comprehensive Revitalisation of Rural Areas[Z]. (2025-02-24)[2026-01-13]. https://www.moa.gov.cn/ztzl/2025yhwj/zxgz_29966/202502/t20250224_6470398.htm. (in Chinese)
[6]
East A J. What is a Carbon Footprint? An overview of definitions and methodologies: VG08107[R]. Sydney, Australia: Horticulture Australia Limited, 2008.
[7]
Weidema B P, Thrane M, Christensen P, Schmidt J, Løkke S. Carbon footprint[J]. Journal of Industrial Ecology, 2008, 12(1): 3-6.

doi: 10.1111/jiec.2008.12.issue-1
[8]
Campiglia E, Gobbi L, Marucci A, Rapa M, Ruggieri R, Vinci G. Hemp seed production: Environmental impacts of Cannabis sativa L. Agronomic practices by life cycle assessment (LCA) and carbon footprint methodologies [J]. Sustainability, 2020, 12(16): 6570.

doi: 10.3390/su12166570
[9]
温桂香, 姚金哲, 韩晴, 李鸽子, 王志勇, 张丛光, 李岚涛, 刘世亮, 王宜伦, 介晓磊, 柳海涛. 河南省小麦玉米生产体系碳氮足迹时空变化特征及驱动因素分析[J]. 环境科学, 2025, 46(2): 1002-1015.
Wen G X, Yao J Z, Han Q, Li G Z, Wang Z Y, Zhang C G, Li L T, Liu S L, Wang Y L, Jie X L, Liu H T. Spatial and temporal variation characteristics and driving factors of carbon and nitrogen footprint in wheat and maize production systems in Henan Province[J]. Environmental Science, 2025, 46(2): 1002-1015. (in Chinese)
[10]
张传红, 韩露, 谢佳男, 靳浩, 刘翠英, 樊建凌. 江苏省主要农作物碳足迹动态及其构成研究[J]. 南京信息工程大学学报(自然科学版), 2022, 14(1): 110-119.
Zhang C H, Han L, Xie J N, Jin H, Liu C Y, Fan J L. Carbon footprint dynamics and composition assessment of major crops production in Jiangsu Province[J]. Journal of Nanjing University of Information Science & Technology(Natural Science Edition), 2022, 14(1): 110-119. (in Chinese)
[11]
陈晗奕, 陈一灵, 洪志坤, 游璐萍, 郑先鑫, 王琳, 许章华. 黑龙江省大豆生产的碳足迹时空分布特征及生态优化研究[J]. 环境监测管理与技术, 2024, 36(3): 21-26.
Chen H Y, Chen Y L, Hong Z K, You L P, Zheng X X, Wang L, Xu Z H. Spatiotemporal distribution characteristics and ecological optimization of carbon footprint in soybean production in Heilongjiang[J]. The Administration and Technique of Environmental Monitoring, 2024, 36(3): 21-26. (in Chinese)
[12]
侯相成, 李涵, 董思奇, 于清军, 冯国忠, 李晓宇, 高强. 东北地区玉米种植系统碳足迹及氮足迹研究[J]. 吉林农业大学学报, 2024, 46(5): 911-922.
Hou X C, Li H, Dong S Q, Yu Q J, Feng G Z, Li X Y, Gao Q. Carbon footprint and nitrogen footprint of maize planting system in Northeast China[J]. Journal of Jilin Agricultural University, 2024, 46(5): 911-922. (in Chinese)
[13]
肖广敏, 茹淑华, 侯利敏, 王策, 赵欧亚, 孙世友, 王凌, 刘蕾, 张国印. 河北省小麦玉米生产体系碳足迹分析[J]. 生态与农村环境学报, 2022, 38(11): 1388-1395.
Xiao G M, Ru S H, Hou L M, Wang C, Zhao O Y, Sun S Y, Wang L, Liu L, Zhang G Y. Carbon footprint analysis of wheat-maize production system in Hebei Province[J]. Journal of Ecology and Rural Environment, 2022, 38(11): 1388-1395. (in Chinese)
[14]
王效琴, 梁东丽, 王旭东, 彭莎, 郑金正. 运用生命周期评价方法评估奶牛养殖系统温室气体排放量[J]. 农业工程学报, 2012, 28(13): 179-184.
Wang X Q, Liang D L, Wang X D, Peng S, Zheng J Z. Estimation of greenhouse gas emissions from dairy farming systems based on LCA[J]. Transactions of the Chinese Society of Agricultural Engineering, 2012, 28(13): 179-184. (in Chinese)
[15]
中华人民共和国国家统计局. 中国统计年鉴2023[M]. 北京: 中国统计出版社, 2023.
National Bureau of Statistics of the People's Republic of China. China Statistical Yearbook 2023[M]. Beijing: China Statistics Press, 2023. (in Chinese)
[16]
国家发展和改革委员会价格司. 全国农产品成本收益资料汇编2014[M]. 北京: 中国统计出版社, 2014.
Price Department of the National Development and Reform Commission. Compilation of National Agricultural Products Cost- Benefit Data in 2014[M]. Beijing: China Statistics Press, 2014. (in Chinese)
[17]
中国物价年鉴编委会. 中国物价年鉴2014- 2023[M]. 北京: 人民出版社, 2023.
Editorial Board of the China Price Yearbook. China Price Yearbook 2014-2023[M]. Beijing: People’s Publishing House, 2023. (in Chinese)
[18]
黄文强. 规模化养殖场牛奶生产碳足迹评估方法与案例分析[D]. 北京: 中国农业科学院, 2015.
Huang W Q. Carbon footprint assessment methodology of milk production in intensive dairy farm and case study[D]. Beijing: Chinese Academy of Agricultural Sciences, 2015. (in Chinese)
[19]
International Organization for Standardization ISO. ISO/TS14067: 2013: Greenhouse Gases-Carbon Footprint of Products Requirements and Guidelines for Quantification and Communication[EB/OL]. (2013-05-01)[2025-10-28]. https://www.iso.org/standard/59521.html.
[20]
谢光辉, 王晓玉, 韩东倩, 薛帅. 中国非禾谷类大田作物收获指数和秸秆系数[J]. 中国农业大学学报, 2011(1): 9-17.
Xie G H, Wang X Y, Han D Q, Xue S. Harvest index and residue factor of non-cereal crops in China[J]. Journal of China Agricultural University, 2011(1): 9-17. (in Chinese)
[21]
中华人民共和国中央人民政府. 农业农村部办公厅关于做好农作物秸秆秸秆资源台账建设工作的通知[EB/OL]. (2019-10-28)[2025- 10-08]. https://www.gov.cn/zhengce/zhengceku/2019-10/28/content_5445951.htm.
Central People's Government of the People's Republic of China. Notice from the general office of the ministry of agriculture and rural affairs on establishing resource ledgers for crop straw[EB/OL]. (2019-10-28)[2025-10-08]. in Chinese)
[22]
国家统计局农村社会经济调查司. 中国农产品价格调查年鉴-2023[M]. 北京: 中国统计出版社, 2023.
Department of Rural Socio-economic Surveys, National Bureau of Statistics. China Yearbook of Agricultural Price Survey[M]. Beijing: China Statistics Press, 2023. (in Chinese)
[23]
农业农村部畜牧兽医局监测信息处, 全国畜牧总站统计信息处. 2023年1月全国畜产品和饲料价格情况[J]. 中国畜牧业, 2023(5): 23-25.
Monitoring Information Division Bureau of Animal Husbandry and Veterinary Medicine Ministry of Agriculture and Rural Affairs. Price analysis of national animal products and feed in January 2023[J]. China Animal Industry, 2023(5): 23-25. (in Chinese)
[24]
IPCC. 2019 Refinement to the 2006 IPCC Guidelines for National Greenhouse Gas Inventories Volume 4 Agriculture, Forestry and Other Land Use[Z]. (2019)[2025-10-08]. https://www.ipcc-nggip.iges.or.jp/public/2019rf/vol4.html.
[25]
Ecoinvent Database [Z]. (2011-05-11)[2025-10-15]. http://www.ecoinvent.ch.
[26]
刘夏璐, 王洪涛, 陈建, 何琴, 张浩, 姜睿, 陈雪雪, 侯萍. 中国生命周期参考数据库的建立方法与基础模型[J]. 环境科学学报, 2010, 30(10): 2136-2144.
Liu X L, Wang H T, Chen J, He Q, Zhang H, Jiang R, Chen X X, Hou P. Method and basic model for development of Chinese reference life cycle database[J]. Acta Scientiae Circumstantiae, 2010, 30(10): 2136-2144. (in Chinese)
[27]
省级温室气体清单编制指南编写组. 省级温室气体清单编制指南(试行)[Z]. 北京: 国家发展和改革委员会, 2011.
Provincial Greenhouse Gas Inventory Compilation Guidelines Drafting Group. Guidelines for the Preparation of Provincial Greenhouse Gas Inventories (Trial Version)[Z]. Beijing: National Development and Reform Commission, 2011. (in Chinese)
[28]
中华人民共和国生态环境部. 关于发布2022年电力二氧化碳排放因子的公告[EB/OL]. (2024-12-26)[2025-10-15]. https://www.mee.gov.cn/xxgk2018/xxgk/xxgk01/202412/t20241226_1099413.html.
Ministry of Ecology and Environment of the People's Republic of China. Notice on the Publication of the 2022 Carbon Dioxide Emission Factor for Electricity[EB/OL]. (2024-12-26)[2025-10-15]. https://www.mee.gov.cn/xxgk2018/xxgk/xxgk01/202412/t20241226_1099413.html. (in Chinese)
[29]
生态环境部大气环境司. 大气污染物与温室气体融合排放清单编制技术指南(试行)[Z]. 北京: 生态环境部, 2024.
Department of Atmospheric Environment Ministry of Ecology and Environment. Technical guidelines for the preparation of integrated emission inventories for air pollutants and greenhouse gases (Trial Version) [Z]. Beijing: Ministry of Ecology and Environment, 2024. (in Chinese)
[30]
张振华, 胡凯, 曾德源. 基于LCA的江西省典型生猪供应链的碳排放测算[J]. 家畜生态学报, 2022, 43(10): 78-85.

doi: 10.3969/j.issn.1673-1182.2022.10.013
Zhang Z H, Hu K, Zeng D Y. Carbon emission estimate of typical swine supply chain in Jiangxi Province based on LCA[J]. Acta Ecologae Animalis Domastici, 2022, 43(10): 78-85. (in Chinese)
[31]
Life Cycle Assessment - steps- Blonk Consultants[Z].(2017-11-11) [2026-01-13] https://www.blonkconsultants.nl/wp-content/uploads/2017/11/Life-Cycle-Assessment-steps.pdf.
[32]
Empresa Brasileira De Pesquisa Agropecuaria[Z].(2024-02-05)[2026- 01-13] https://sbc.cnpso.embrapa.br/en/.
[33]
任科宇, 徐明岗, 张露, 段英华, 王伯仁. 我国不同区域粮食作物产量对有机肥施用的响应差异[J]. 农业资源与环境学报, 2021, 38(1): 143-150.
Ren K Y, Xu M G, Zhang L, Duan Y H, Wang B R. Response of grain crop yield to manure application in different regions of China[J]. Journal of Agricultural Resources and Environment, 2021, 38(1): 143-150. (in Chinese)
[34]
Lin J Y, Hu Y C, Cui S H, Kang J F, Xu L L. Carbon footprints of food production in China (1979-2009) [J]. Journal of Cleaner Production, 2015, 90: 97-103.

doi: 10.1016/j.jclepro.2014.11.072
[35]
修圣智, 李艳, 魏丹, 刘康萌, 李硕, 胡钰, 金梁, 丁建莉, 杨振国. 东北三省主要粮食作物生产碳足迹动态变化及其影响因子研究[J]. 土壤通报, 2025, 56(1): 27-36.
Xiu S Z, Li Y, Wei D, Liu K M, Li S, Hu Y, Jin L, Ding J L, Yang Z G. The dynamic changes of carbon footprint and its influencing factors in the production of major grain crops in the three provinces of Northeast China[J]. Chinese Journal of Soil Science, 2025, 56(1): 27-36. (in Chinese)
[36]
中华人民共和国农业部. 到2020年化肥使用量零增长行动方案[Z]. (2015-03-18)[2025-10-28]. http://jiuban.moa.gov.cn/zwllm/tzgg/tz/201503/t20150318_4444765.htm.
Ministry of Agriculture of the People's Republic of China. Action plan for zero growth in fertilizer use by 2020 [Z]. (2015-03-18)[2025-10-28]. http://jiuban.moa.gov.cn/zwllm/tzgg/tz/201503/t20150318_4444765.htm. (in Chinese)
[37]
王钰乔, 濮超, 赵鑫, 王兴, 刘胜利, 张海林. 中国小麦、玉米碳足迹历史动态及未来趋势[J]. 资源科学, 2018, 40(9): 1800-1811.

doi: 10.18402/resci.2018.09.10
Wang Y Q, Pu C, Zhao X, Wang X, Liu S L, Zhang H L. Historical dynamics and future trends of carbon footprint of wheat and maize in China[J]. Resources Science, 2018, 40(9): 1800-1811. (in Chinese)

doi: 10.18402/resci.2018.09.10
[38]
Xia L L, Xia Y Q, Ma S T, Wang J Y, Wang S W, Zhou W, Yan X Y. Greenhouse gas emissions and reactive nitrogen releases from rice production with simultaneous incorporation of wheat straw and nitrogen fertilizer[J]. Biogeosciences, 2016, 13(15): 4569-4579.

doi: 10.5194/bg-13-4569-2016
[39]
谭鑫, 李昊儒, 王子健, 巩娟弟, 郝卫平. 2015-2020年不同省份小麦生命周期碳足迹变化分析[J]. 中国农业气象, 2024, 45(8): 809-821.
Tan X, Li H R, Wang Z J, Gong J D, Hao W P. Analysis on change characteristics of carbon footprint of wheat life cycle in different provinces from 2015 to 2020[J]. Chinese Journal of Agrometeorology, 2024, 45(8): 809-821. (in Chinese)
[40]
吕沛颖, 任红阳, 王红亮. 我国生猪饲料原料农田生产过程碳氮足迹空间变异与分析[J]. 中国农业大学学报, 2024, 29(12): 127-140.
Lü P Y, Ren H Y, Wang H L. Spatial variation and analysis of carbon and nitrogen footprints during farmland production of pig feed ingredients in China[J]. Journal of China Agricultural University, 2024, 29(12): 127-140. (in Chinese)
[41]
Chen S T, Dong H C, Hong Y, Gao F, Guo S K, Mi W H. Long-term different fertilization practices restructured the functional carbon pools in a paddy soil through distinct mechanisms[J]. Agriculture, Ecosystems & Environment, 2024, 374: 109168.

doi: 10.1016/j.agee.2024.109168
[42]
Wang Y X, Xu Y R, Guo Q, Zhang P, Cai T, Jia Z K. Adopting nitrogen deep placement based on different simulated precipitation year types enhances wheat yield and resource utilization by promoting photosynthesis capacity[J]. Field Crops Research, 2023, 294: 108862.

doi: 10.1016/j.fcr.2023.108862
[43]
Zhang Q S, Chu Y Y, Xue Y F, Ying H, Chen X H, Zhao Y J, Ma W Q, Ma L, Zhang J Z, Yin Y L, Cui Z L. Outlook of China’s agriculture transforming from smallholder operation to sustainable production[J]. Global Food Security, 2020, 26: 100444.

doi: 10.1016/j.gfs.2020.100444
[44]
杜岳峰, 傅生辉, 毛恩荣, 朱忠祥, 李臻. 农业机械智能化设计技术发展现状与展望[J]. 农业机械学报, 2019, 50(9): 1-17.
Du Y F, Fu S H, Mao E R, Zhu Z X, Li Z. Development situation and prospects of intelligent design for agricultural machinery[J]. Transactions of the Chinese Society for Agricultural Machinery, 2019, 50(9): 1-17. (in Chinese)
[45]
刘玮琪, 钟太洋. 农药零增长政策对农药施用总量和强度的影响[J]. 农业资源与环境学报, 2024, 41(4): 964-975.
Liu W Q, Zhong T Y. Impact of pesticide use zero-growth policy on the total amount and intensity of pesticide utilization[J]. Journal of Agricultural Resources and Environment, 2024, 41(4): 964-975. (in Chinese)
[1] YAO ZhiZhen, YANG ZiHong, ZHANG YingNan, YIN ChangBin. Green Total Factor Productivity Growth of Rice in China: Spatiotemporal and Evolutionary Patterns [J]. Scientia Agricultura Sinica, 2026, 59(9): 1937-1954.
[2] ZHU Qi, JIA ZhenPeng, Tahir SHAH, XU ChenSheng, LI ZhiQi, LÜ HuiShuai, ZHU PengChao, WEI XiaoMin, HUANG DongLin, SUN YanNi, CAO WeiDong, GAO YaJun, WANG ZhaoHui, ZHANG DaBin. Green Manure Crops Combined with Enhanced-Efficiency Products Reduced Greenhouse Gas Emissions and Carbon Footprints in Dryland Wheat Fields [J]. Scientia Agricultura Sinica, 2026, 59(7): 1507-1522.
[3] SHEN YueYu, CHEN ShaoKan, MA YaDong, LIU JianYe, ZHANG YaYi, CHEN Tong, ZHAO Xin, ZHANG Xin, TU Yan. Effects of Low-Soybean Meal Diets on Dairy Cow Production Performance and Methane Emission [J]. Scientia Agricultura Sinica, 2026, 59(20): 4673-4683.
[4] ZHENG Yu, CHEN Yi, TI JinSong, SHI LongFei, XU XiaoBo, LI YuLin, GUO Rui. Evaluation of Carbon Footprint and Economic Benefit of Different Tobacco Rotation Patterns [J]. Scientia Agricultura Sinica, 2025, 58(4): 733-747.
[5] LIU RuoChen, ZHANG ShuiQin, XU Meng, XU JiuKai, YUAN Liang, GAO Qiang, LI YanTing, ZHAO BingQiang. Carbon Footprint Assessment for the Production Cycle of Value- Added Diammonium Phosphate Containing Humic Acid [J]. Scientia Agricultura Sinica, 2025, 58(19): 3946-3958.
[6] YIN MinHao, CHEN ChiBo, LU YiHeng, TIAN Yun. China's Agricultural Carbon Emission Density: Spatiotemporal Characteristics, Dynamic Evolution, and Spatial Effect [J]. Scientia Agricultura Sinica, 2025, 58(18): 3710-3727.
[7] WANG ChuFan, NIU Jun. Water and Carbon Footprint and Layout Optimization of Major Grain Crops in the Northwest China [J]. Scientia Agricultura Sinica, 2024, 57(6): 1137-1152.
[8] WU ChuanLei, HU XiaoYu, WANG Wei, MIAO Long, BAI PengYu, WANG GuoJi, LI Na, SHU Kuo, QIU LiJuan, WANG XiaoBo. Development and Identification of Molecular Markers for Oil-Related Functional Genes and Polymerization Analysis of Excellent Alleles in Soybean [J]. Scientia Agricultura Sinica, 2024, 57(22): 4402-4415.
[9] ZHOU YuanQing, DONG HongMin, ZHU ZhiPing, WANG Yue, LI NanXi. Review on Carbon Footprint Assessment of Pig Farming System [J]. Scientia Agricultura Sinica, 2024, 57(2): 379-389.
[10] CHEN XiaoWei, WANG XiaoLong. Accounting Framework of Carbon Footprint on Integrated Cropping-Breeding Farming System: A Case on Maize-Cow-Recycling Manure Model [J]. Scientia Agricultura Sinica, 2023, 56(2): 314-332.
[11] ZHENG ChunYu, SHA ShanYi, ZHU Lin, WANG ShaoJie, FENG GuoZhong, GAO Qiang, WANG Yin. Optimizing Nitrogen Fertilizer Rate for High-Yield Maize in Black Soil Region Based on Ecological and Social Benefits [J]. Scientia Agricultura Sinica, 2023, 56(11): 2129-2140.
[12] LI XiaoLi,HE TangQing,ZHANG ChenXi,TIAN MingHui,WU Mei,LI ChaoHai,YANG QingHua,ZHANG XueLin. Effect of Organic Fertilizer Replacing Chemical Fertilizers on Greenhouse Gas Emission Under the Conditions of Same Nitrogen Fertilizer Input in Maize Farmland [J]. Scientia Agricultura Sinica, 2022, 55(5): 948-961.
[13] QIAO Yuan,YANG Huan,LUO JinLin,WANG SiXian,LIANG LanYue,CHEN XinPing,ZHANG WuShuai. Inputs and Ecological Environment Risks Assessment of Maize Production in Northwest China [J]. Scientia Agricultura Sinica, 2022, 55(5): 962-976.
[14] CHEN XuHao,GAO Qiang,CHEN XinPing,ZHANG WuShuai. Temporal and Spatial Characteristics of Resources Input and Environmental Effects for Maize Production in the Three Provinces of Northeast China [J]. Scientia Agricultura Sinica, 2022, 55(16): 3170-3184.
[15] LIU XinChao,WANG LuLu,WU RuQun,XIN XiaoPing,SUN HaiLian,JIANG MingHong,LI XiaoShuang,WANG Miao,LIU Yun,SHAO ChangLiang. LCA-Based Assessment of Hulunber Ecological Grassland Technology Integration Demonstration [J]. Scientia Agricultura Sinica, 2020, 53(13): 2703-2714.
Viewed
Full text


Abstract

Cited

  Shared   
  Discussed   
No Suggested Reading articles found!