


中国农业科学 ›› 2022, Vol. 55 ›› Issue (5): 932-947.doi: 10.3864/j.issn.0578-1752.2022.05.008
刘苗( ),刘朋召,师祖姣,王小利,王瑞,李军()
收稿日期:2021-01-20
接受日期:2021-05-07
出版日期:2022-03-01
发布日期:2022-03-08
联系方式:
刘苗,E-mail: 3318757297@qq.com。
基金资助:
LIU Miao(),LIU PengZhao,SHI ZuJiao,WANG XiaoLi,WANG Rui,LI Jun()
Received:2021-01-20
Accepted:2021-05-07
Published:2022-03-01
Online:2022-03-08
摘要:
【目的】探究不同水平氮磷配施对夏玉米地上部生物量和氮素浓度的影响,构建临界氮浓度稀释曲线模型,并基于氮营养指数模型诊断和评价玉米在不同氮磷互作条件下的氮素营养状况,可为夏玉米氮磷肥合理施用提供理论依据。【方法】以玉米品种郑单958和豫玉22为试验材料,在陕西关中平原设置田间定位氮磷配施试验,设氮肥(N)用量0、75、150、225、300 kg·hm-2(分别用N0、N1、N2、N3和N4表示);磷肥(P2O5)用量0、60、120、180 kg·hm-2(分别用P0、P1、P2和P3表示),于2019—2020年在夏玉米拔节期、抽雄期、灌浆期和成熟期进行取样,分析不同水平氮磷配施对玉米地上部生物量累积、氮浓度动态变化和产量的影响,构建并验证临界氮浓度稀释曲线模型。【结果】氮磷配施能显著提高夏玉米地上部生物量、植株氮浓度及籽粒产量,在同一施磷水平下,随施氮水平的提高,夏玉米各生育时期地上部生物量和籽粒产量呈增加趋势,植株氮浓度随生育进程推进和地上部生物量积累的增加而降低,氮浓度和地上部生物量之间符合幂指数关系。同时,施磷能促进植株氮素吸收和地上部生物量积累,在相同施氮条件下,施磷各处理总体表现为P2>P3≈P1>P0,说明施磷可以提高植株氮容纳能力,减缓氮浓度下降速率。根据地上部生物量(DM)与其氮浓度变化关系构建不同施磷水平下夏玉米临界氮浓度(Nc)变化曲线(P0,Nc=27.98DM-0.249;P1,Nc= 29.77DM-0.182;P2,Nc=30.81DM-0.138;P3,Nc=30.06DM-0.187),模型拟合的植株氮浓度和实际氮浓度线性相关,稀释曲线模型的n-RMSE值分别为10.23%、6.67%、6.95%和7.19%,有很好的稳定性。基于临界氮浓度稀释曲线计算氮营养指数(NNI),同一施磷水平下玉米各生育时期NNI随氮肥用量的增加而增大,NNI与相对地上部生物量(RDW)和相对产量(RY)均呈极显著相关。【结论】基于临界氮浓度稀释曲线模型的氮营养指数对夏玉米适宜氮磷配施量的诊断结果为N2—N3、P1—P2处理为最佳条件,结合施氮量与产量的拟合方程,推荐关中平原夏玉米施氮量为187.5—205.7 kg·hm-2、施磷量为60—120 kg·hm-2。
刘苗,刘朋召,师祖姣,王小利,王瑞,李军. 氮磷配施下夏玉米临界氮浓度稀释曲线的构建与氮营养诊断[J]. 中国农业科学, 2022, 55(5): 932-947.
LIU Miao,LIU PengZhao,SHI ZuJiao,WANG XiaoLi,WANG Rui,LI Jun. Critical Nitrogen Dilution Curve and Nitrogen Nutrition Diagnosis of Summer Maize Under Different Nitrogen and Phosphorus Application Rates[J]. Scientia Agricultura Sinica, 2022, 55(5): 932-947.
表1
供试土壤基本养分状况"
| 年份 Year | 施氮水平 Nitrogen rate | 有机质 OM (g·kg-1) | 全氮 Total N (g·kg-1) | 全磷 Total P (g·kg-1) | 全钾 Total K (g·kg-1) | 速效磷 Available P (mg·kg-1) | 速效钾 Available K (mg·kg-1) | 硝态氮 Nitrate N (mg·kg-1) | 铵态氮 Ammonium N (mg·kg-1) |
|---|---|---|---|---|---|---|---|---|---|
| 2019 | N0 | 18.45 | 0.92 | 0.95 | 10.21 | 15.12 | 122.64 | 3.92 | 3.11 |
| N1 | 19.29 | 0.98 | 0.93 | 10.27 | 14.62 | 137.33 | 7.27 | 3.56 | |
| N2 | 19.02 | 1.04 | 0.94 | 10.26 | 13.31 | 128.93 | 8.29 | 3.80 | |
| N3 | 19.03 | 1.09 | 0.91 | 10.04 | 12.73 | 134.01 | 9.96 | 4.72 | |
| N4 | 19.56 | 1.09 | 0.98 | 10.28 | 11.36 | 130.26 | 10.63 | 4.16 | |
| 2020 | N0 | 18.08 | 0.95 | 0.92 | 10.04 | 12.98 | 163.51 | 3.86 | 2.59 |
| N1 | 19.14 | 0.98 | 0.97 | 10.14 | 10.76 | 178.96 | 13.94 | 3.44 | |
| N2 | 19.19 | 1.07 | 1.01 | 9.89 | 11.15 | 162.25 | 14.73 | 4.01 | |
| N3 | 18.76 | 1.05 | 0.97 | 9.96 | 13.33 | 157.29 | 15.63 | 4.91 | |
| N4 | 19.23 | 1.02 | 0.96 | 9.65 | 12.57 | 152.86 | 16.98 | 4.68 |
表2
夏玉米不同生育时期地上部生物量、植株氮含量及产量的方差分析"
| 年份 Year | 因子 Factor | V6 | VT | R2 | R6 | 产量 Yield | ||||
|---|---|---|---|---|---|---|---|---|---|---|
| DM | Na | DM | Na | DM | Na | DM | Na | |||
| 2019 | V | 1.36NS | 0.14NS | 7.62* | 3.61* | 1.79NS | 2.72NS | 4.42NS | 4.19NS | 4.64NS |
| P | 113.9*** | 146.1*** | 110.9*** | 389.9*** | 9.84*** | 308.3*** | 4.14* | 490.8*** | 32.12*** | |
| N | 103.2*** | 145.9*** | 811.2*** | 692.8*** | 105.8*** | 744.5*** | 169.4*** | 131.9*** | 679.2*** | |
| V×P | 2.48NS | 4.95NS | 1.25NS | 5.89NS | 5.69* | 3.65NS | 1.09NS | 6.98* | 1.19NS | |
| V×N | 8.44* | 1.15NS | 1.12NS | 3.75* | 5.56NS | 1.42NS | 1.24NS | 2.42NS | 0.19NS | |
| P×N | 5.06*** | 7.02*** | 4.98*** | 5.36*** | 17.09*** | 6.87*** | 2.64* | 13.29*** | 2.61** | |
| V×P×N | 3.29* | 2.59NS | 2.20* | 1.42* | 1.21NS | 2.21NS | 1.69NS | 3.45* | 0.26NS | |
| 2020 | V | 1.87NS | 4.12NS | 3.17NS | 0.54NS | 7.44* | 1.79NS | 3.77NS | 1.84NS | 0.83NS |
| P | 48.19*** | 843.2*** | 31.15*** | 770.4*** | 194.2*** | 626.6*** | 92.42*** | 559.7*** | 22.07*** | |
| N | 525.4*** | 127.1*** | 355.1*** | 146.4*** | 140.1*** | 109.4*** | 136.6*** | 128.6*** | 756.9*** | |
| V×P | 3.99* | 5.03* | 0.36NS | 3.22NS | 3.74NS | 2.42NS | 1.43NS | 2.23NS | 0.74NS | |
| V×N | 2.86NS | 2.00NS | 3.47* | 4.04* | 7.11* | 3.07NS | 0.54NS | 3.65NS | 0.03NS | |
| P×N | 5.27*** | 2.82NS | 5.98*** | 2.18NS | 19.08*** | 1.55NS | 9.21*** | 1.06NS | 3.98*** | |
| V×P×N | 2.69* | 1.47NS | 1.42NS | 1.84NS | 5.73* | 1.66NS | 2.63NS | 2.16NS | 0.55NS | |
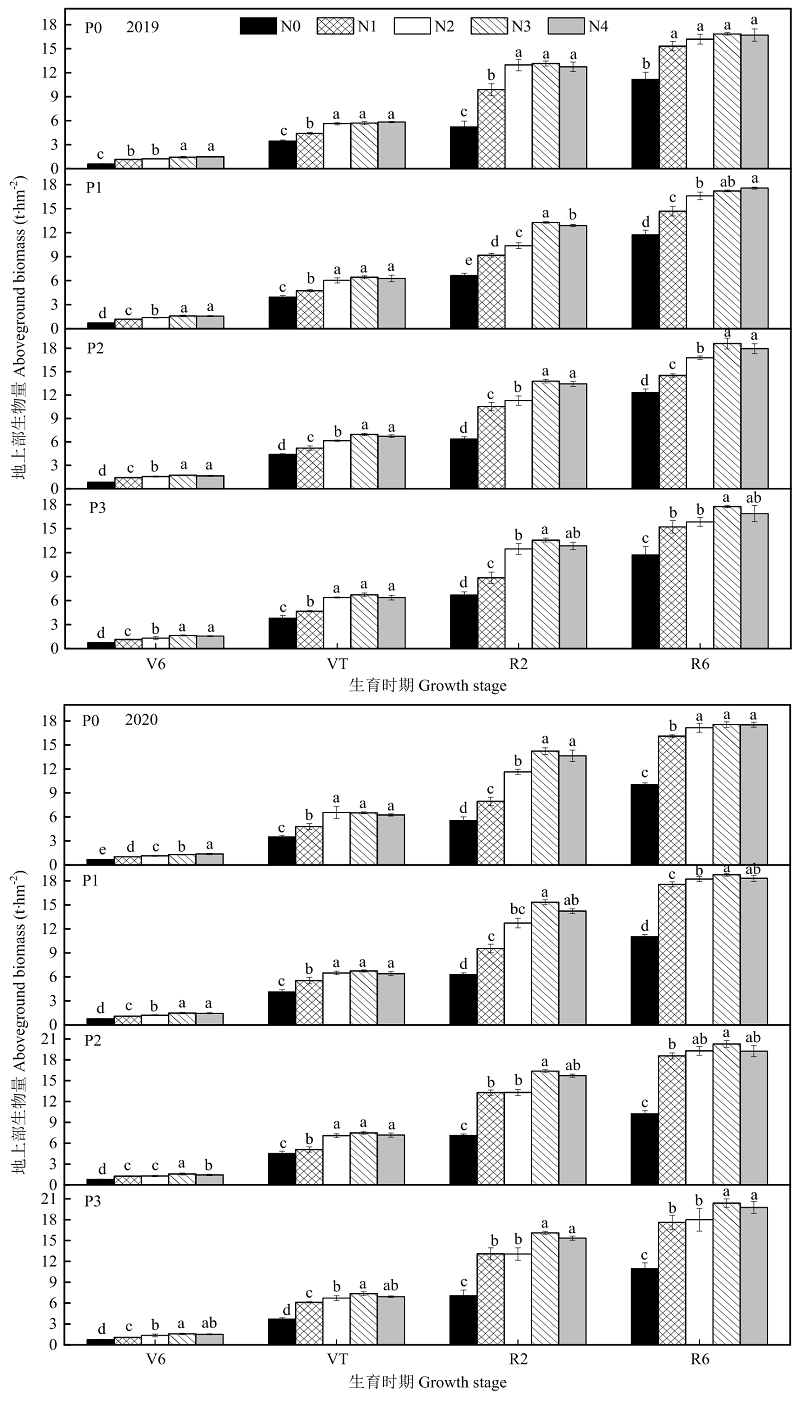
图1
不同水平氮磷配施对夏玉米地上部生物量累积的影响 柱上不同字母表示同一年内不同处理间差异达到显著水平(P<0.05)。下同"
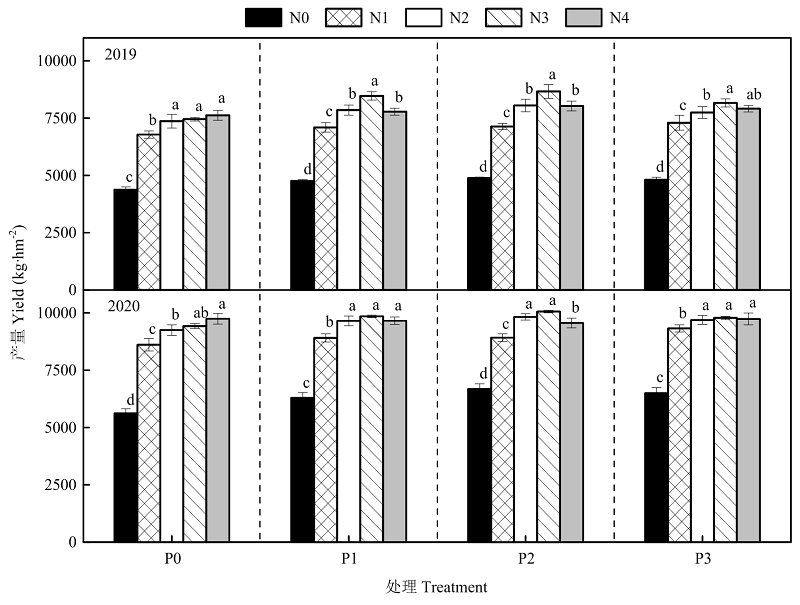
图2
不同水平氮磷配施对夏玉米产量的影响"
表3
不同水平氮磷配施下夏玉米产量效应方程"
| 年份 Year | 施磷水平 Phosphorus rate | 拟合方程 Regression equation | R2 | 最高产量 Maximum yield (kg·hm-2) | 最高产量施氮量 Optimum nitrogen rate (kg·hm-2) | 经济最佳施氮量 Optimum economic nitrogen rate (kg·hm-2) |
|---|---|---|---|---|---|---|
| 2019 | P0 | y=-0.063x2+28.53x+4573.22 | 0.898* | 7790.00 | 225.54 | 215.65 |
| P1 | y=-0.079x2+33.44x+4824.29 | 0.975* | 8385.22 | 212.97 | 205.01 | |
| P2 | y=-0.077x2+33.63x+4916.68 | 0.987** | 8572.61 | 217.43 | 209.35 | |
| P3 | y=-0.070x2+30.43x+4980.28 | 0.922* | 8288.92 | 217.45 | 208.52 | |
| 2020 | P0 | y=-0.074x2+34.22x+5886.84 | 0.886* | 9853.29 | 231.82 | 223.35 |
| P1 | y=-0.078x2+33.64x+6463.53 | 0.946* | 10086.82 | 215.40 | 207.40 | |
| P2 | y=-0.078x2+32.58x+6752.42 | 0.988** | 10155.48 | 208.93 | 200.91 | |
| P3 | y=-0.076x2+32.12x+6762.87 | 0.851* | 10144.10 | 210.51 | 202.32 |
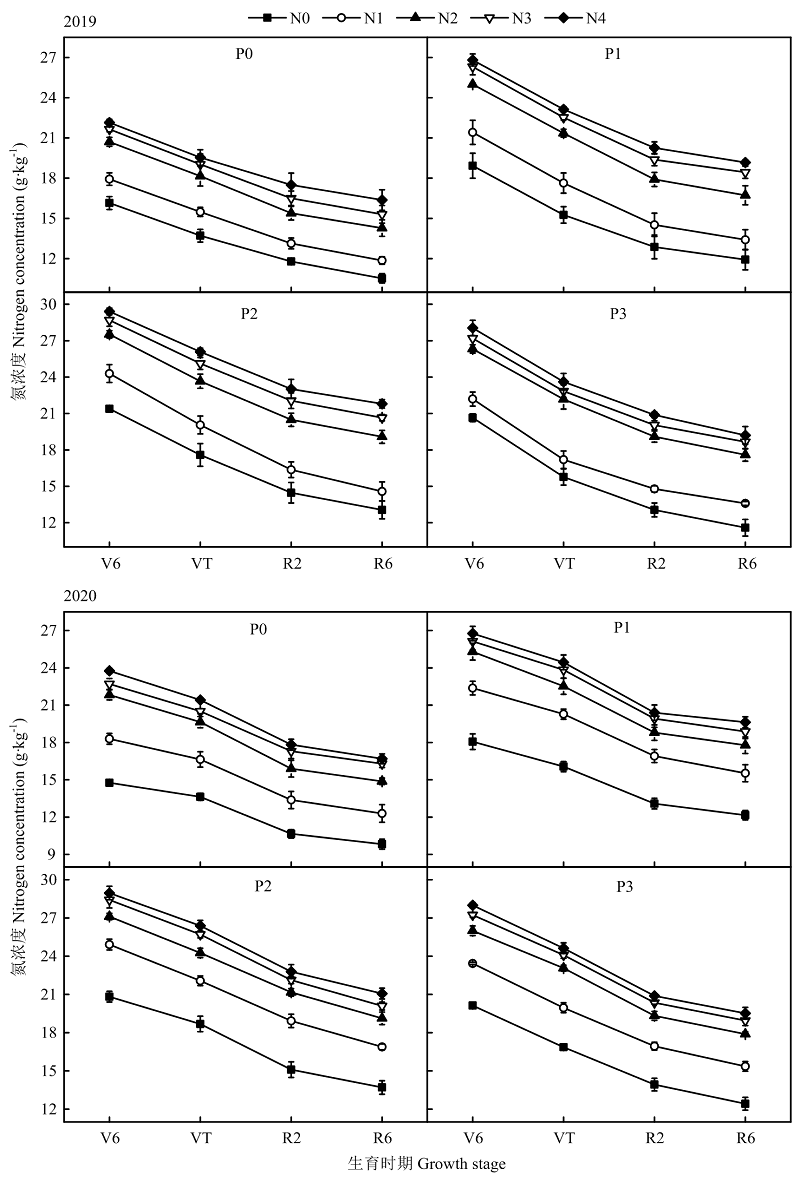
图3
不同水平氮磷配施对夏玉米植株氮浓度变化的影响"
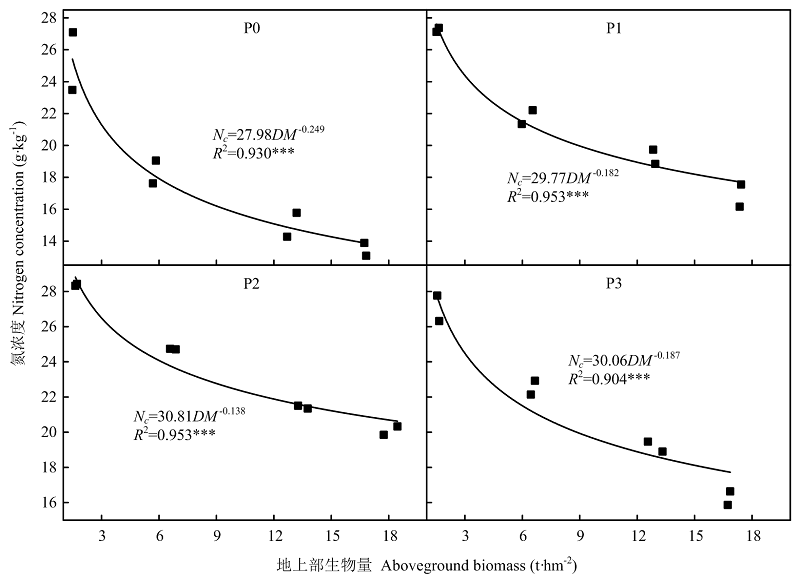
图4
不同施磷水平下夏玉米地上部生物量氮稀释曲线"
表4
不同施磷水平下夏玉米临界氮浓度(g·kg-1)测定值与模拟值"
| 生育时期 Growth stage | P0 | P1 | P2 | P3 | ||||
|---|---|---|---|---|---|---|---|---|
| 实测值Observed value | 模拟值Simulated value | 实测值Observed value | 模拟值Simulated value | 实测值Observed value | 模拟值Simulated value | 实测值Observed value | 模拟值Simulated value | |
| 拔节期 V6 | 25.36 | 25.65 | 26.38 | 27.78 | 27.09 | 29.54 | 26.39 | 28.05 |
| 23.53 | 26.09 | 26.08 | 27.86 | 27.91 | 28.84 | 26.79 | 27.61 | |
| 抽雄期 VT | 18.66 | 17.62 | 21.33 | 21.19 | 24.41 | 23.42 | 22.88 | 20.76 |
| 20.29 | 17.69 | 23.51 | 21.20 | 25.23 | 23.42 | 22.91 | 20.88 | |
| 灌浆期 R2 | 16.25 | 14.77 | 18.45 | 18.41 | 22.05 | 21.04 | 19.04 | 18.02 |
| 17.99 | 14.46 | 20.63 | 18.33 | 21.92 | 21.07 | 20.25 | 18.07 | |
| 成熟期 R6 | 14.01 | 13.72 | 16.85 | 17.49 | 18.67 | 20.38 | 17.99 | 17.10 |
| 14.39 | 13.74 | 17.78 | 17.54 | 18.25 | 20.48 | 18.35 | 17.32 | |
| RMSE | 1.925 | 1.426 | 1.611 | 1.570 | ||||
| n-RMSE | 10.23% | 6.67% | 6.95% | 7.19% | ||||
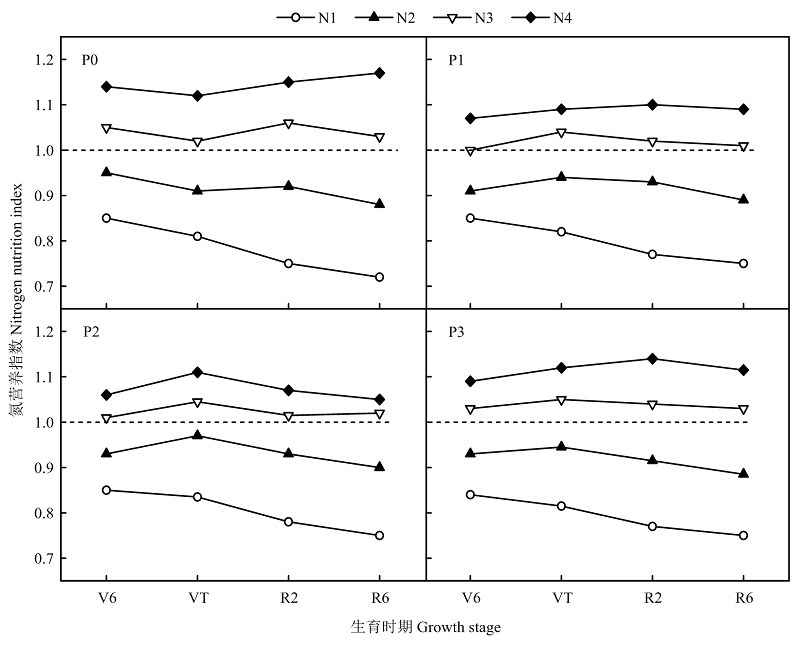
图5
不同水平氮磷配施下夏玉米氮营养指数(NNI)动态变化"
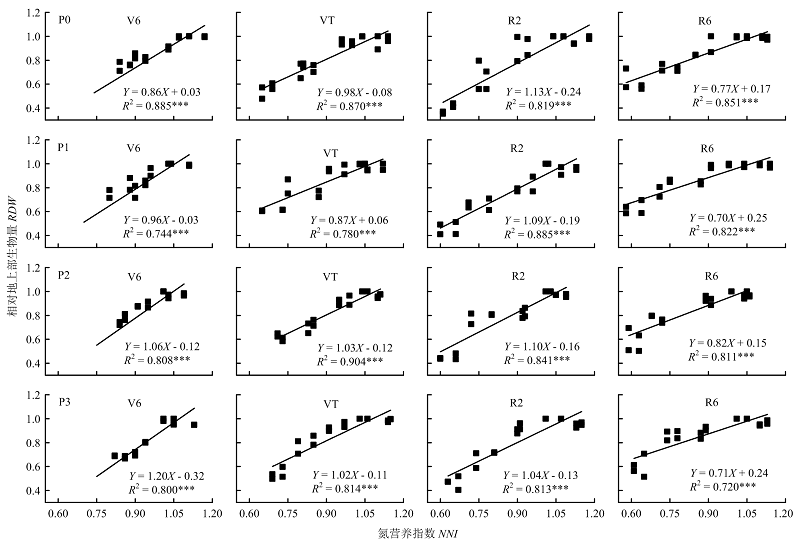
图6
不同施磷水平下夏玉米氮营养指数与相对地上部生物量的关系"
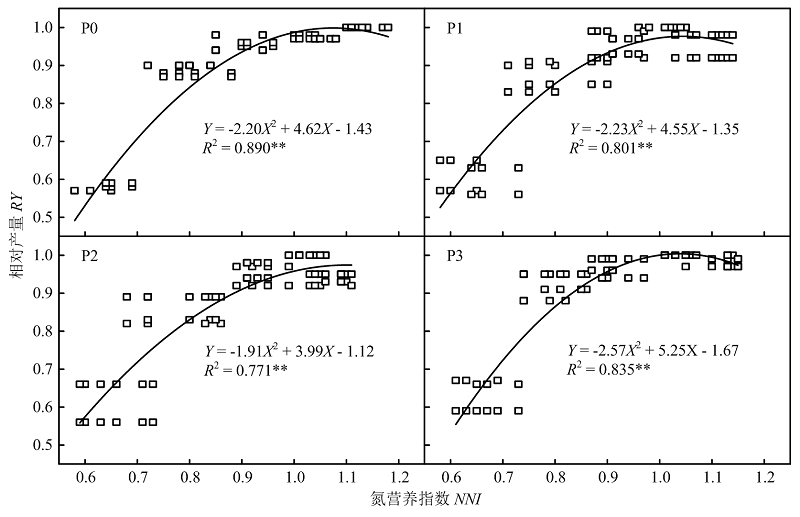
图7
不同施磷水平下夏玉米氮营养指数与相对产量的关系"
| [37] |
LEMAIRE G, JEUFFROY M H, GASTAL F. Diagnosis tool for plant and crop N status in vegetative stage. European Journal of Agronomy, 2008, 28(4):614-624. doi: 10.1016/j.eja.2008.01.005.
doi: 10.1016/j.eja.2008.01.005 |
| [38] |
王宜伦, 李潮海, 谭金芳, 韩燕来, 张许. 超高产夏玉米植株氮素积累特征及一次性施肥效果研究. 中国农业科学, 2010, 43(15):3151-3158. doi: 10.3864/j.issn.0578-1752.2010.15.012.
doi: 10.3864/j.issn.0578-1752.2010.15.012 |
|
WANG Y L, LI C H, TAN J F, HAN Y L, ZHANG X. Studies on plant nitrogen accumulation characteristics and the effect of single application of base fertilizer on super-high-yield summer maize. Scientia Agricultura Sinica, 2010, 43(15):3151-3158. doi: 10.3864/j.issn.0578-1752.2010.15.012. (in Chinese)
doi: 10.3864/j.issn.0578-1752.2010.15.012 |
|
| [39] | 王宜伦, 刘天学, 赵鹏, 张许, 谭金芳, 李潮海. 施氮量对超高产夏玉米产量与氮素吸收及土壤硝态氮的影响. 中国农业科学, 2013, 46(12):2483-2491. |
| WANG Y L, LIU T X, ZHAO P, ZHANG X, TAN J F, LI C H. Effect of nitrogen fertilizer application on yield, nitrogen absorption and soil nitric N in super-high-yield summer maize. Scientia Agricultura Sinica, 2013, 46(12):2483-2491. (in Chinese) | |
| [40] |
杨宪龙, 路永莉, 同延安, 马海洋, 陈毓君, 丁燕. 陕西关中小麦-玉米轮作区协调作物产量和环境效应的农田适宜氮肥用量. 生态学报, 2014, 34(21):6115-6123. doi: 10.5846/stxb201301280182.
doi: 10.5846/stxb201301280182 |
|
YANG X L, LU Y L, TONG Y N, MA H Y, CHEN Y J, DING Y. Optimum-N application rate to maximize yield and protect the environment in a wheat-maize rotation system on the Guanzhong Plain, Shaanxi Province. Acta Ecologica Sinica, 2014, 34(21):6115-6123. doi: 10.5846/stxb201301280182. (in Chinese)
doi: 10.5846/stxb201301280182 |
|
| [1] |
BURKART M R, KOLPIN D W. Hydrologic and land-use factors associated with herbicides and nitrate in near-surface aquifers. Journal of Environmental Quality, 1993, 22(4):646-656. doi: 10.2134/jeq1993.00472425002200040002x.
doi: 10.2134/jeq1993.00472425002200040002x |
| [2] |
HEUER S, GAXIOLA R, SCHILLING R, HERRERA-ESTRELLA L, LÓPEZ-ARREDONDO D, WISSUWA M, DELHAIZE E, ROUACHED H. Improving phosphorus use efficiency: A complex trait with emerging opportunities. The Plant Journal, 2017, 90(5):868-885. doi: 10.1111/tpj.13423.
doi: 10.1111/tpj.13423 |
| [3] |
刘凯, 张吉旺, 郭艳青, 裴书君, 董树亭, 刘鹏, 杨今胜, 赵斌. 施磷量对高产夏玉米产量和磷素利用的影响. 山东农业科学, 2016, 48(4):61-65. doi: 10.14083/j.issn.1001-4942.2016.04.015.
doi: 10.14083/j.issn.1001-4942.2016.04.015 |
|
LIU K, ZHANG J W, GUO Y Q, PEI S J, DONG S T, LIU P, YANG J S, ZHAO B. Effects of phosphorus fertilization on yield and phosphorus use efficiency of high-yielding summer maize. Shandong Agricultural Sciences, 2016, 48(4):61-65. doi: 10.14083/j.issn.1001-4942.2016.04.015. (in Chinese)
doi: 10.14083/j.issn.1001-4942.2016.04.015 |
|
| [4] |
陈书强, 许海涛, 段翠平. 施磷量对玉米生长发育产量构成因子及品质的影响. 河北农业科学, 2011, 15(2):62-64, 95. doi: 10.16318/j.cnki.hbnykx.2011.02.042.
doi: 10.16318/j.cnki.hbnykx.2011.02.042 |
|
CHEN S Q, XU H T, DUAN C P. Effects of phosphorus application amount on growth and development, yield components and quality of maize. Journal of Hebei Agricultural Sciences, 2011, 15(2):62-64, 95. doi: 10.16318/j.cnki.hbnykx.2011.02.042. (in Chinese)
doi: 10.16318/j.cnki.hbnykx.2011.02.042 |
|
| [5] |
BAI Z H, LI H G, YANG X Y, ZHOU B K, SHI X J, WANG B R, LI D C, SHEN J B, CHEN Q, QIN W, OENEMA O, ZHANG F S. The critical soil P levels for crop yield, soil fertility and environmental safety in different soil types. Plant and Soil, 2013, 372(1):27-37. doi: 10.1007/s11104-013-1696-y.
doi: 10.1007/s11104-013-1696-y |
| [6] |
常艳丽, 刘俊梅, 李玉会, 孙本华, 张树兰, 杨学云. 陕西关中平原小麦/玉米轮作体系施肥现状调查与评价. 西北农林科技大学学报(自然科学版), 2014, 42(8):51-61. doi: 10.13207/j.cnki.jnwafu.2014.08.033.
doi: 10.13207/j.cnki.jnwafu.2014.08.033 |
|
CHANG Y L, LIU J M, LI Y H, SUN B H, ZHANG S L, YANG X Y. Investigation and evaluation of fertilization under winter wheat and summer maize rotation system in Guanzhong Plain, Shaanxi Province. Journal of Northwest A & F University (Natural Science Edition), 2014, 42(8):51-61. doi: 10.13207/j.cnki.jnwafu.2014.08.033. (in Chinese)
doi: 10.13207/j.cnki.jnwafu.2014.08.033 |
|
| [7] |
陈祥, 同延安, 杨倩. 氮磷钾平衡施肥对夏玉米产量及养分吸收和累积的影响. 中国土壤与肥料, 2008(6):19-22. doi: 10.3969/j.issn.1673-6257.2008.06.005
doi: 10.3969/j.issn.1673-6257.2008.06.005 |
|
CHEN X, TONG Y N, YANG Q. Effect of balanced fertilization on the yield, nutrients absorption and accumulation of summer maize. Soils and Fertilizers Sciences in China, 2008(6):19-22. doi: 10.3969/j.issn.1673-6257.2008.06.005 (in Chinese)
doi: 10.3969/j.issn.1673-6257.2008.06.005 |
|
| [8] |
PLÉNET D, LEMAIRE G. Relationships between dynamics of nitrogen uptake and dry matter accumulation in maize crops. Determination of critical N concentration. Plant and Soil, 1999, 216(1):65-82. doi: 10.1023/A:1004783431055.
doi: 10.1023/A:1004783431055 |
| [9] |
LEMAIRE G, OOSTEROM E V, SHEEHY J, JEUFFROY M H, MASSIGNAM A, ROSSATO L. Is crop N demand more closely related to dry matter accumulation or leaf area expansion during vegetative growth? Field Crops Research, 2007, 100(1):91-106. doi: 10.1016/j.fcr.2006.05.009.
doi: 10.1016/j.fcr.2006.05.009 |
| [10] | 张加康, 李斐, 李跃进, 杨海波, 贾禹泽, 刘玉峰, 石焱. 基于全株生物量和全株氮浓度的马铃薯氮临界浓度稀释模型的构建及验证. 植物营养与肥料学报, 2020, 26(9):1691-1701. |
| ZHANG J K, LI F, LI Y J, YANG H B, JIA Y Z, LIU Y F, SHI Y. Establishment and validation of critical nitrogen dilution curve based on the total plant biomass and nitrogen concentration. Plant Nutrition and Fertilizer Science, 2020, 26(9):1691-1701. (in Chinese) | |
| [11] |
薛晓萍, 王建国, 郭文琦, 陈兵林, 王友华, 张丽娟, 周治国. 棉花花后果枝叶生物量和氮累积特征及临界氮浓度稀释模型的研究. 作物学报, 2007, 33(4):669-676. doi: 10.3321/j.issn:0496-3490.2007.04.023.
doi: 10.3321/j.issn:0496-3490.2007.04.023 |
|
XUE X P, WANG J G, GUO W Q, CHEN B L, WANG Y H, ZHANG L J, ZHOU Z G. Accumulation characters of biomass and nitrogen and critical nitrogen concentration dilution model of cotton fruit-branch leaf after flowering. Acta Agronomica Sinica, 2007, 33(4):669-676. doi: 10.3321/j.issn:0496-3490.2007.04.023. (in Chinese)
doi: 10.3321/j.issn:0496-3490.2007.04.023 |
|
| [12] |
牟思维, 解君, 罗成, 刘铁宁, 杨宝平, 韩清芳, 刘晓雪. 关中地区大蒜临界氮浓度稀释曲线及验证. 农业工程学报, 2019, 35(19):126-133. doi: 10.11975/j.issn.1002-6819.2019.19.015.
doi: 10.11975/j.issn.1002-6819.2019.19.015 |
|
MOU S W, XIE J, LUO C, LIU T N, YANG B P, HAN Q F, LIU X X. Establishment and verification of critical nitrogen concentration dilution curve of garlic in Guanzhong plain. Transactions of the Chinese Society of Agricultural Engineering, 2019, 35(19):126-133. doi: 10.11975/j.issn.1002-6819.2019.19.015. (in Chinese)
doi: 10.11975/j.issn.1002-6819.2019.19.015 |
|
| [13] |
强生才, 张富仓, 田建柯, 吴悠, 闫世程, 范军亮. 基于叶片干物质的冬小麦临界氮稀释曲线模拟研究. 农业机械学报, 2015, 46(11):121-128. doi: 10.6041/j.issn.1000-1298.2015.11.017.
doi: 10.6041/j.issn.1000-1298.2015.11.017 |
|
QIANG S C, ZHANG F C, TIAN J K, WU Y, YAN S C, FAN J L. Development of critical nitrogen dilution curve in winter wheat based on leaf dry matter. Transactions of the Chinese Society for Agricultural Machinery, 2015, 46(11):121-128. doi: 10.6041/j.issn.1000-1298.2015.11.017. (in Chinese)
doi: 10.6041/j.issn.1000-1298.2015.11.017 |
|
| [14] |
王新, 马富裕, 刁明, 樊华, 崔静, 贾彪, 何海兵, 刘其. 滴灌番茄临界氮浓度、氮素吸收和氮营养指数模拟. 农业工程学报, 2013, 29(18):99-108. doi: 10.3969/j.issn.1002-6819.2013.18.013
doi: 10.3969/j.issn.1002-6819.2013.18.013 |
|
WANG X, MA F Y, DIAO M, FAN H, CUI J, JIA B, HE H B, LIU Q. Simulation of critical nitrogen concentration, nitrogen uptake and nitrogen nutrition index of processing tomato with drip irrigation. Transactions of the Chinese Society of Agricultural Engineering, 2013, 29(18):99-108. doi: 10.3969/j.issn.1002-6819.2013.18.013. (in Chinese)
doi: 10.3969/j.issn.1002-6819.2013.18.013 |
|
| [15] |
YUE S C, MENG Q F, ZHAO R F, LI F, CHEN X P, ZHANG F S, CUI Z L. Critical nitrogen dilution curve for optimizing nitrogen management of winter wheat production in the North China plain. Agronomy Journal, 2012, 104(2):523-529. doi: 10.2134/agronj2011.0258.
doi: 10.2134/agronj2011.0258 |
| [16] | 陕西省统计局. 陕西统计年鉴. 北京: 中国统计出版社, 2010. |
| Shaanxi Bureau of Statistics. Shaanxi Statistical Yearbook. Beijing: China Statistics Press, 2010. (in Chinese) | |
| [17] |
李正鹏, 宋明丹, 冯浩. 关中地区玉米临界氮浓度稀释曲线的建立和验证. 农业工程学报, 2015, 31(13):135-141. doi: 10.11975/j.issn.1002-6819.2015.13.019.
doi: 10.11975/j.issn.1002-6819.2015.13.019 |
|
LI Z P, SONG M D, FENG H. Development and validation of critical nitrogen content curve for maize in Guanzhong area. Transactions of the Chinese Society of Agricultural Engineering, 2015, 31(13):135-141. doi: 10.11975/j.issn.1002-6819.2015.13.019. (in Chinese)
doi: 10.11975/j.issn.1002-6819.2015.13.019 |
|
| [18] |
强生才, 张富仓, 向友珍, 张燕, 闫世程, 邢英英. 关中平原不同降雨年型夏玉米临界氮稀释曲线模拟及验证. 农业工程学报, 2015, 31(17):168-175. doi: 10.11975/j.issn.1002-6819.2015.17.022.
doi: 10.11975/j.issn.1002-6819.2015.17.022 |
|
QIANG S C, ZHANG F C, XIANG Y Z, ZHANG Y, YAN S C, XING Y Y. Simulation and validation of critical nitrogen dilution curve for summer maize in Guanzhong Plain during different rainfall years. Transactions of the Chinese Society of Agricultural Engineering, 2015, 31(17):168-175. doi: 10.11975/j.issn.1002-6819.2015.17.022. (in Chinese)
doi: 10.11975/j.issn.1002-6819.2015.17.022 |
|
| [19] |
苏文楠, 解君, 韩娟, 刘铁宁, 韩清芳. 夏玉米不同部位干物质临界氮浓度稀释曲线的构建及对产量的估计. 作物学报, 2021, 47(3):530-545. doi: 10.3724/SP.J.1006.2021.03021.
doi: 10.3724/SP.J.1006.2021.03021 |
|
SU W N, XIE J, HAN J, LIU T N, HAN Q F. Construction of critical nitrogen dilution curve based on dry matter in different organs of summer maize and estimation of grain yield. Acta Agronomica Sinica, 2021, 47(3):530-545. doi: 10.3724/SP.J.1006.2021.03021. (in Chinese)
doi: 10.3724/SP.J.1006.2021.03021 |
|
| [20] |
张英利, 许安民, 尚浩博, 马爱生. AA3型连续流动分析仪测定土壤和植物全氮的方法研究. 西北农林科技大学学报(自然科学版), 2006, 34(10):128-132. doi: 10.13207/j.cnki.jnwafu.2006.10.026.
doi: 10.13207/j.cnki.jnwafu.2006.10.026 |
|
ZHANG Y L, XU A M, SHANG H B, MA A S. Determination study of total nitrogen in soil and plant by continuous flow analytical system. Journal of Northwest Sci- Tech University of Agriculture and Forestry (Natural Science Edition), 2006, 34(10):128-132. doi: 10.13207/j.cnki.jnwafu.2006.10.026. (in Chinese)
doi: 10.13207/j.cnki.jnwafu.2006.10.026 |
|
| [21] |
JUSTES E, MARY B, MEYNARD J M, MACHET J M, THELIER- HUCHE L. Determination of a critical nitrogen dilution curve for winter wheat crops. Annals of Botany, 1994, 74(4):397-407. doi: 10.1006/anbo.1994.1133.
doi: 10.1006/anbo.1994.1133 |
| [22] |
NULL. Some comments on the evaluation of model performance. Bulletin of the American Meteorological Society, 1982, 63(11):1309-1313.
doi: 10.1175/1520-0477(1982)063<1309:SCOTEO>2.0.CO;2 |
| [23] |
YANG J, GREENWOOD D J, ROWELL D L, WADSWORTH G A, BURNS I G. Statistical methods for evaluating a crop nitrogen simulation model, N_ABLE. Agricultural Systems, 2000, 64(1):37-53. doi: 10.1016/S0308-521X(00)00010-X.
doi: 10.1016/S0308-521X(00)00010-X |
| [24] |
JAMIESON P D, PORTER J R, WILSON D R. A test of the computer simulation model ARCWHEAT1 on wheat crops grown in New Zealand. Field Crops Research, 1991, 27(4):337-350. doi: 10.1016/0378-4290(91)90040-3.
doi: 10.1016/0378-4290(91)90040-3 |
| [25] |
GASTAL F, LEMAIRE G. N uptake and distribution in crops: An agronomical and ecophysiological perspective. Journal of Experimental Botany, 2002, 53(370):789-799. doi: 10.1093/jexbot/53.370.789.
doi: 10.1093/jexbot/53.370.789 |
| [26] |
安志超, 黄玉芳, 汪洋, 赵亚南, 岳松华, 师海斌, 叶优良. 不同氮效率夏玉米临界氮浓度稀释模型与氮营养诊断. 植物营养与肥料学报, 2019, 25(1):123-133. doi: 10.11674/zwyf.18020.
doi: 10.11674/zwyf.18020 |
|
AN Z C, HUANG Y F, WANG Y, ZHAO Y N, YUE S H, SHI H B, YE Y L. Critical nitrogen concentration dilution model and nitrogen nutrition diagnosis in summer maize with different nitrogen efficiencies. Journal of Plant Nutrition and Fertilizer, 2019, 25(1):123-133. doi: 10.11674/zwyf.18020. (in Chinese)
doi: 10.11674/zwyf.18020 |
|
| [27] | 付江鹏, 贺正, 贾彪, 刘慧芳, 李振洲, 刘志. 滴灌玉米临界氮稀释曲线与氮素营养诊断研究. 作物学报, 2020, 46(2):290-299. |
| FU J P, HE Z, JIA B, LIU H F, LI Z Z, LIU Z. Critical nitrogen dilution curve and nitrogen nutrition diagnosis of maize with drip irrigation. Acta Agronomica Sinica, 2020, 46(2):290-299. (in Chinese) | |
| [28] |
卢宪菊, 郭新宇, 温维亮, 于泽涛. 东北地区春玉米临界氮浓度稀释曲线的建立和验证. 中国农业科技导报, 2019, 21(11):77-83. doi: 10.13304/j.nykjdb.2018.0588.
doi: 10.13304/j.nykjdb.2018.0588 |
|
LU X J, GUO X Y, WEN W L, YU Z T. Development and validation of critical nitrogen dilution curve for spring maize in northeast China. Journal of Agricultural Science and Technology, 2019, 21(11):77-83. doi: 10.13304/j.nykjdb.2018.0588. (in Chinese)
doi: 10.13304/j.nykjdb.2018.0588 |
|
| [29] |
刘朋召, 师祖姣, 宁芳, 王瑞, 王小利, 李军. 不同降雨状况下渭北旱地春玉米临界氮稀释曲线与氮素营养诊断. 作物学报, 2020, 46(8):1225-1237. doi: 10.3724/SP.J.1006.2020.03007.
doi: 10.3724/SP.J.1006.2020.03007 |
|
LIU P Z, SHI Z J, NING F, WANG R, WANG X L, LI J. Critical nitrogen dilution curves and nitrogen nutrition diagnosis of spring maize under different precipitation patterns in Weibei dryland. Acta Agronomica Sinica, 2020, 46(8):1225-1237. doi: 10.3724/SP.J.1006.2020.03007. (in Chinese)
doi: 10.3724/SP.J.1006.2020.03007 |
|
| [30] | 梁效贵, 张经廷, 周丽丽, 李旭辉, 周顺利. 华北地区夏玉米临界氮稀释曲线和氮营养指数研究. 作物学报, 2013, 39(2):292-299. |
| LIANG X G, ZHANG J T, ZHOU L L, LI X H, ZHOU S L. Critical nitrogen dilution curve and nitrogen nutrition index for summer maize in North China plain. Acta Agronomica Sinica, 2013, 39(2):292-299. (in Chinese) | |
| [31] | 刘小刚, 张富仓, 杨启良, 李志军. 玉米叶绿素、脯氨酸、根系活力对调亏灌溉和氮肥处理的响应. 华北农学报, 2009, 24(4):106-111. |
| LIU X G, ZHANG F C, YANG Q L, LI Z J. Response of chlorophyll, proline and root activity of maize to regulated deficit irrigation and N fertilization treatment. Acta Agriculturae Boreali-Sinica, 2009, 24(4):106-111. (in Chinese) | |
| [32] |
曹彩云, 郑春莲, 李科江, 马俊永, 崔彦宏. 长期定位施肥对夏玉米光合特性及产量的影响研究. 中国生态农业学报, 2009, 17(6):1074-1079. doi: 10.3724/SP.J.1011.2009.01074.
doi: 10.3724/SP.J.1011.2009.01074 |
|
CAO C Y, ZHENG C L, LI K J, MA J Y, CUI Y H. Effect of long-term fertilization on photosynthetic property and yield of summer maize(Zea mays L.). Chinese Journal of Eco-Agriculture, 2009, 17(6):1074-1079. doi: 10.3724/SP.J.1011.2009.01074. (in Chinese)
doi: 10.3724/SP.J.1011.2009.01074 |
|
| [33] | 华伟, 曹国军, 耿玉辉, 车明, 韩圆圆, 黄岩. 氮磷互作对春玉米产量及氮素吸收积累的影响. 中国农学通报, 2017, 33(6):27-33. |
| HUA W, CAO G J, GENG Y H, CHE M, HAN Y Y, HUANG Y. Interaction of nitrogen and phosphorus affecting spring maize yield and N uptake accumulation. Chinese Agricultural Science Bulletin, 2017, 33(6):27-33. (in Chinese) | |
| [34] | 史桂清, 石书亚, 赵颖佳, 肖凯. 氮磷钾施用方式对夏玉米植株、产量和土壤养分的影响. 中国农学通报, 2019, 35(13):23-30. |
| SHI G Q, SHI S Y, ZHAO Y J, XIAO K. NPK application modes affect plants and yield of summer maize and soil nutrients. Chinese Agricultural Science Bulletin, 2019, 35(13):23-30. (in Chinese) | |
| [35] |
侯云鹏, 杨建, 孔丽丽, 尹彩侠, 李前, 秦裕波, 王立春, 谢佳贵. 不同施磷水平对春玉米产量、养分吸收及转运的影响. 玉米科学, 2017, 25(3):123-130. doi: 10.13597/j.cnki.maize.science.20170321.
doi: 10.13597/j.cnki.maize.science.20170321 |
|
HOU Y P, YANG J, KONG L L, YIN C X, LI Q, QIN Y B, WANG L C, XIE J G. Effect of different phosphorus levels on yield, nitrogen, phosphorus and potassium absorption and translocation of spring maize. Journal of Maize Sciences, 2017, 25(3):123-130. doi: 10.13597/j.cnki.maize.science.20170321. (in Chinese)
doi: 10.13597/j.cnki.maize.science.20170321 |
|
| [36] |
王子凤, 李絮花, 王鹏. 长期定位施肥条件下土壤理化性质的演变. 山东农业科学, 2020, 52(6):65-70. doi: 10.14083/j.issn.1001-4942.2020.06.011.
doi: 10.14083/j.issn.1001-4942.2020.06.011 |
|
WANG Z F, LI X H, WANG P. Evolution analysis of soil physical and chemical properties under long-term positioning fertilization condition. Shandong Agricultural Sciences, 2020, 52(6):65-70. doi: 10.14083/j.issn.1001-4942.2020.06.011. (in Chinese)
doi: 10.14083/j.issn.1001-4942.2020.06.011 |
| [1] | 王亚菲, 闫鹏, 薛金涛, 董学瑞, 孟凡琦, 郭丽娜, 罗艺, 张娟, 董志强, 卢霖. 乙烯利-甜菜碱-水杨酸合剂对高温胁迫下玉米根系建构、生理功能和产量的影响[J]. 中国农业科学, 2026, 59(7): 1439-1455. |
| [2] | 薛钰琦, 赵继玉, 孙旺胜, 任佰朝, 赵斌, 刘鹏, 张吉旺. 不同氮素形态对夏玉米产量和品质的影响[J]. 中国农业科学, 2025, 58(8): 1535-1549. |
| [3] | 王同超, 于宁宁, 崔栋, 任佰朝, 赵斌, 刘鹏, 任昊, 熊伟, 张吉旺. 滴灌水肥一体化条件下种植密度对夏玉米受精结实特性的调控[J]. 中国农业科学, 2025, 58(24): 5156-5174. |
| [4] | 高春华, 赵海军, 赵逢涛, 孔玮琳, 巨飞燕, 李宗新, 石德杨, 刘苹. 生长调节剂对玉米大豆带状间作下夏玉米茎秆特性与产量的影响[J]. 中国农业科学, 2025, 58(23): 4920-4935. |
| [5] | 高尚洁, 刘杏认, 李迎春, 柳晓婉. 施用生物炭和秸秆还田对农田温室气体排放及增温潜势的影响[J]. 中国农业科学, 2024, 57(5): 935-949. |
| [6] | 石德杨, 李艳红, 王飞飞, 夏德君, 矫岩林, 孙妮娜, 赵健. 高密度下扩行缩株对夏玉米干物质与养分积累、转运的调控效应[J]. 中国农业科学, 2024, 57(23): 4658-4672. |
| [7] | 郭娅, 任昊, 王洪章, 张吉旺, 赵斌, 任佰朝, 刘鹏. 高温干旱复合胁迫抑制夏玉米光系统Ⅱ性能降低籽粒产量[J]. 中国农业科学, 2024, 57(21): 4205-4220. |
| [8] | 齐欣, 汪洋, 黄玉芳, 叶优良, 郭宇龙, 赵亚南. 基于直方图的手机玉米冠层数字图像氮素诊断方法[J]. 中国农业科学, 2024, 57(20): 4094-4106. |
| [9] | 刘水苗, 关小康, 赵志恒, 王景辉, 刘世龙, 高培萌, 王艳丽, 吴鹏年, 高晨凯, 李煜铭, 邵京, 于昊琳, 王同朝, 温鹏飞. 冬麦播前耕作方式对麦玉轮作体系中玉米季土壤水分、籽粒灌浆特征及产量的影响[J]. 中国农业科学, 2024, 57(18): 3568-3585. |
| [10] | 赵花荣, 周广胜, 齐月, 耿金剑, 田晓丽. 播期调整对华北北部冬小麦、夏玉米产量和品质的影响[J]. 中国农业科学, 2024, 57(15): 2964-2985. |
| [11] | 马胜兰, 况福虹, 林洪羽, 崔俊芳, 唐家良, 朱波, 蒲全波. 秸秆还田量对川中丘陵冬小麦-夏玉米轮作体系土壤物理特性的影响[J]. 中国农业科学, 2023, 56(7): 1344-1358. |
| [12] | 刘梦, 张垚, 葛均筑, 杨永安, 吴锡冬, 侯海鹏. 不同降雨年型施氮量对延迟收获夏玉米产量、强弱势粒形态与粒重的影响[J]. 中国农业科学, 2023, 56(20): 3975-3995. |
| [13] | 于浩东, 初振宇, 汪顺源, 郭艳青, 任佰朝, 张吉旺. 不同控释氮素比例对夏玉米叶片衰老和籽粒灌浆特性的影响[J]. 中国农业科学, 2023, 56(18): 3511-3529. |
| [14] | 赵政鑫,王晓云,田雅洁,王锐,彭青,蔡焕杰. 未来气候条件下秸秆还田和氮肥种类对夏玉米产量及土壤氨挥发的影响[J]. 中国农业科学, 2023, 56(1): 104-117. |
| [15] | 房孟颖, 卢霖, 王庆燕, 董学瑞, 闫鹏, 董志强. 乙矮合剂对不同施氮量夏玉米根系形态构建和产量的影响[J]. 中国农业科学, 2022, 55(24): 4808-4822. |
|
||