


中国农业科学 ›› 2024, Vol. 57 ›› Issue (6): 1137-1152.doi: 10.3864/j.issn.0578-1752.2024.06.009
王楚凡1,3( ), 牛俊1,2,3()
收稿日期:2023-04-11
接受日期:2023-05-10
出版日期:2024-03-16
发布日期:2024-03-25
通信作者:
联系方式:
王楚凡,E-mail:ww9906@sina.cn。
基金资助:
WANG ChuFan1,3(), NIU Jun1,2,3()
Received:2023-04-11
Accepted:2023-05-10
Published:2024-03-16
Online:2024-03-25
摘要:
【目的】 对西北地区主要粮食作物碳足迹和水足迹进行评估,并基于碳足迹和水足迹建立多目标种植结构优化模型,对各省(区)粮食作物进行空间布局调整,为减少碳排放量和强化水资源管理提供理论依据。【方法】 以西北地区小麦、玉米和水稻种植面积、产量和农资投入量等为基础数据,利用生命周期法(LCA)对碳足迹进行评估;以蒸散量和有效降水量为基础数据,利用Penman-Monteith公式对水足迹进行评估;基于熵权法对西北五省(区)三大粮食作物布局进行多目标优化。【结果】 1999—2020年西北地区小麦、玉米、水稻的碳足迹和水足迹在不同省(区)表现出明显的差异性。西北地区3种粮食作物小麦、玉米、水稻碳排放呈现出东西部较高,中部较低的分布特点,其单位产量碳足迹(PCF)的范围分别为:0.36—0.63、0.33—0.56、0.57—0.97 t CO2-eq·t-1,单位面积碳足迹(FCF)分别为:(2.46±0.77)、(3.21±0.49)、(5.57±0.91)t CO2-eq·hm-2。2010—2018年西北地区小麦、玉米绿水总量呈平稳上升趋势,水稻绿水总量变化不显著。平均绿水总量较高的地区分布在陕西、甘肃和宁夏。蓝水总量在2010—2015年呈上升趋势,2016—2018年呈现下降趋势,平均蓝水总量较高的地区分布在甘肃、宁夏和新疆。玉米是西北地区三大粮食作物中蓝水足迹最小的作物,平均蓝水足迹为0.45 m3·kg-1;水稻的蓝水足迹最大,平均蓝水足迹为0.77 m3·kg-1。基于碳足迹和水足迹进行粮食作物种植结构优化,以各省(区)不同作物种植面积为决策变量,并根据不同权重设置重点减少碳排放(生态效益)和重点增加绿水利用(水资源效益)的优化情景。情景1碳排放总量减少1.9%,绿水利用总量增加5.0%;情景2碳排放总量减少11.8%;情景3绿水利用总量增加6.7%。【结论】 西北地区三大粮食作物碳排放和水总量时空差异显著。碳足迹方面,该地区三大粮食作物平均FCF呈现增加,PCF呈现降低的变化趋势。水足迹方面,该地区三大粮食作物绿水足迹高于全国均值,其中玉米绿水足迹最大,水稻绿水足迹最小。在粮食作物安全保障的前提下,小麦种植面积增加6.7%、玉米和水稻种植面积分别减少5.8%和8.0%,经济、资源和生态效益均有一定的改进。综上所述,多目标优化后可以提高绿水资源利用,减少碳排放量,缓解环境压力。
王楚凡, 牛俊. 西北地区主要粮食作物种植的水、碳足迹及布局优化[J]. 中国农业科学, 2024, 57(6): 1137-1152.
WANG ChuFan, NIU Jun. Water and Carbon Footprint and Layout Optimization of Major Grain Crops in the Northwest China[J]. Scientia Agricultura Sinica, 2024, 57(6): 1137-1152.
表1
投入农资的排放系数"
| 项目 Item | 排放系数 Emission factor | 参考文献Reference |
|---|---|---|
| 氮肥Nitrogenous fertilizer | 7.759 t CO2-eq·t-1 | [ |
| 磷肥Phosphate fertilizer | 2.332 t CO2-eq·t-1 | [ |
| 钾肥Potassic fertilizer | 0.66 t CO2-eq·t-1 | [ |
| 农药 Pesticides | 18.08 t CO2-eq·t-1 | [ |
| 柴油 Diesel fuel | 4.63 t CO2-eq·L-1 | [ |
| 塑料薄膜 Plastic film | 5.18 t CO2-eq·t-1 | [ |
| 灌溉电力 Irrigation electricity | 266.48 kg CO2-eq·hm-2 | [ |
| 小麦种子 Wheat seeds | 1.22 t CO2-eq·t-1 | [ |
| 玉米种子 Maize seeds | 1.16 t CO2-eq·t-1 | [ |
| 水稻种子 Rice seeds | 1.84 t CO2-eq·t-1 | [ |
| 氮肥引起农田N2O直接排放 Direct N2O emission from N fertilizer | 小麦Wheat 0.0105 kg N2O-N·kg-1N | [ |
| 玉米Maize 0.0105 kg N2O-N·kg-1N | [ | |
| 水稻Rice 0.0042 kg N2O-N·kg-1N | [ |
表2
西北五省(区)水稻CH4排放系数[33]"
| 作物 Crop | 陕西 Shaanxi | 甘肃 Gansu | 青海 Qinghai | 宁夏 Ningxia | 新疆 Xinjiang |
|---|---|---|---|---|---|
| 水稻 Rice | 125.1 | 68.3 | — | 73.5 | 105.0 |
表3
西北五省(区)秸秆占作物产量的比例[24]"
| 省(区) Province | 小麦 Wheat | 玉米 Maize | 水稻 Rice |
|---|---|---|---|
| 陕西 Shaanxi | 1.27 | 1.1 | 0.94 |
| 甘肃 Gansu | 1.26 | 1.11 | 0.84 |
| 青海 Qinghai | 1.31 | 1.1 | 0 |
| 宁夏 Ningxia | 1.08 | 1.21 | 0.99 |
| 新疆 Xinjiang | 1.36 | 1.15 | 0.74 |
表4
西北五省(区)秸秆燃烧率和还田比例[24]"
| 省(区) Province | 室内秸秆燃烧率 Domestic straw burning percentage (%) | 田间秸秆燃烧率 In-field straw burning percentage (%) | 秸秆还田比例 Proportion of straw returning (%) |
|---|---|---|---|
| 陕西Shaanxi | 10.24 | 8.4 | 33.4 |
| 甘肃 Gansu | 23.1 | 9.9 | 6.5 |
| 青海 Qinghai | 19.6 | 8.4 | 7.7 |
| 宁夏 Ningxia | 11.2 | 4.8 | 19.6 |
| 新疆 Xinjiang | 15 | 15 | 47.2 |
表5
不同作物秸秆燃烧效率和干物质分数[24]"
| 作物 Crop | CEi | CEj | D |
|---|---|---|---|
| 小麦 Wheat | 86 | 92 | 89 |
| 玉米 Maize | 92 | 92 | 87 |
| 水稻 Rice | 89 | 93 | 89 |
表6
秸秆燃烧温室气体排放系数[24]"
| 燃烧模式 Burning mode | 作物 Crop | CO2排放系数 CO2 emission factors (g·kg-1) | N2O排放系数 N2O emission factors (g·kg-1) | CH4排放系数 CH4 emission factors (g·kg-1) |
|---|---|---|---|---|
| 室内秸秆燃烧 Domestic straw burning | 小麦 Wheat | 1246.7 | 1.19 | 8.3 |
| 玉米 Maize | 1491 | 1.86 | 3.91 | |
| 水稻 Rice | 1147.4 | 1.92 | 4.8 | |
| 田间秸秆燃烧 In-field straw burning | 小麦 Wheat | 1390 | 3.3 | 3.4 |
| 玉米 Maize | 1350 | 4.3 | 4.4 | |
| 水稻 Rice | 1393 | 1.42 | 3.9 |
表7
各发育阶段作物系数(Kc)及各生长期比例"
| 作物Crop | Kcb(tab)_ini | Kcb(tab)_mid | Kcb(tab)_end | L_ini | L_dep | L_mid | L_end |
|---|---|---|---|---|---|---|---|
| 小麦 Wheat | 0.15 | 1.1 | 0.15 | 0.15 | 0.25 | 0.4 | 0.2 |
| 玉米 Maize | 0.15 | 1.15 | 0.5 | 0.17 | 0.28 | 0.33 | 0.22 |
| 水稻 Rice | 1.0 | 1.15 | 0.6 | 0.17 | 0.18 | 0.44 | 0.21 |
表8
修正后的各发育阶段作物系数"
| 作物Crop | Kcb_ini | Kcb_mid | Kcb_end | Kc_ini | Kc_dep | Kc_mid | Kc_end |
|---|---|---|---|---|---|---|---|
| 小麦 Wheat | 0.15 | 1.148 | 0.15 | 0.43 | 0.85 | 1.18 | 0.83 |
| 玉米 Maize | 0.15 | 1.177 | 0.516 | 0.33 | 0.71 | 1.18 | 0.92 |
| 水稻 Rice | 1.0 | 1.172 | 0.623 | 1.16 | 1.13 | 1.18 | 0.94 |
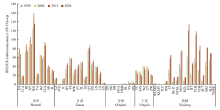
图1
西北各地区粮食作物碳排放总量 XA:西安市Xi’an;TCA:铜川市Tongchuan;BJ:宝鸡市Baoji;XY:咸阳市Xianyang;WN:渭南市Weinan;YA:延安市Yan’an;HZ:汉中市Hanzhong;YLA:榆林市Yulin;AK:安康市Ankang;SL:商洛市Shangluo;LZ:兰州市Lanzhou;JYG:嘉峪关市Jiayuguan;JC:金昌市Jinchang;BY:白银市Baiyin;TS:天水市Tianshui;WW:武威市Wuwei;ZY:张掖市Zhangye;PL:平凉市Pingliang;JQ:酒泉市Jiuquan;QY:庆阳市Qingyang;DX:定西市Dingxi;LN:陇南市Longnan;LX:临夏回族自治州Linxia Hui Autonomous Prefecture;GN:甘南藏族自治州Gannan Tibetan Autonomous Prefecture;XZ:西宁市Xining;HD:海东市Haidong;HB:海北藏族自治州Haibei Tibetan Autonomous Prefecture;HNA:黄南藏族自治州Huangnan Tibetan Autonomous Prefecture;HNB:海南藏族自治州Hainan Tibetan Autonomous Prefecture;GL:果洛藏族自治州Guoluo Tibetan Autonomous Prefecture;YS:玉树藏族自治州Yushu Tibetan Autonomous Prefecture;HX:海西蒙古族藏族自治州Haixi Mongolian and Tibetan Autonomous Prefecture;YC:银川市Yinchuan;SZS:石嘴山市Shizuishan;WZ:吴忠市Wuzhong;GY:固原市Guyuan;ZW:中卫市Zhongwei;WLMQ:乌鲁木齐市Urumqi;KLMY:克拉玛依市Kelamayi;TLF:吐鲁番市Tulufan;HM:哈密市Hami;CJ:昌吉回族自治州Changji Hui Autonomous Prefecture;BETL:博尔塔拉蒙古自治州Bortala Mongolian Autonomous Prefecture;BYGL:巴音郭楞蒙古自治州Bayingol Mongolian Autonomous Prefecture;AKS:阿克苏地区Aksu;KZL:克孜勒苏柯尔克孜自治州Kizilsu Kirgiz Autonomous Prefecture;KS:喀什地区Kashgar;HT:和田地区Hotan;YLB:伊犁哈萨克自治州Ili Kazakh Autonomous Prefecture;TCB:塔城地区Tarbagatay;ALT:阿勒泰地区Altay;SHZ:石河子市Shihezi;ALE:阿拉尔市Alaer;TMSK:图木舒克市Tumushuke"
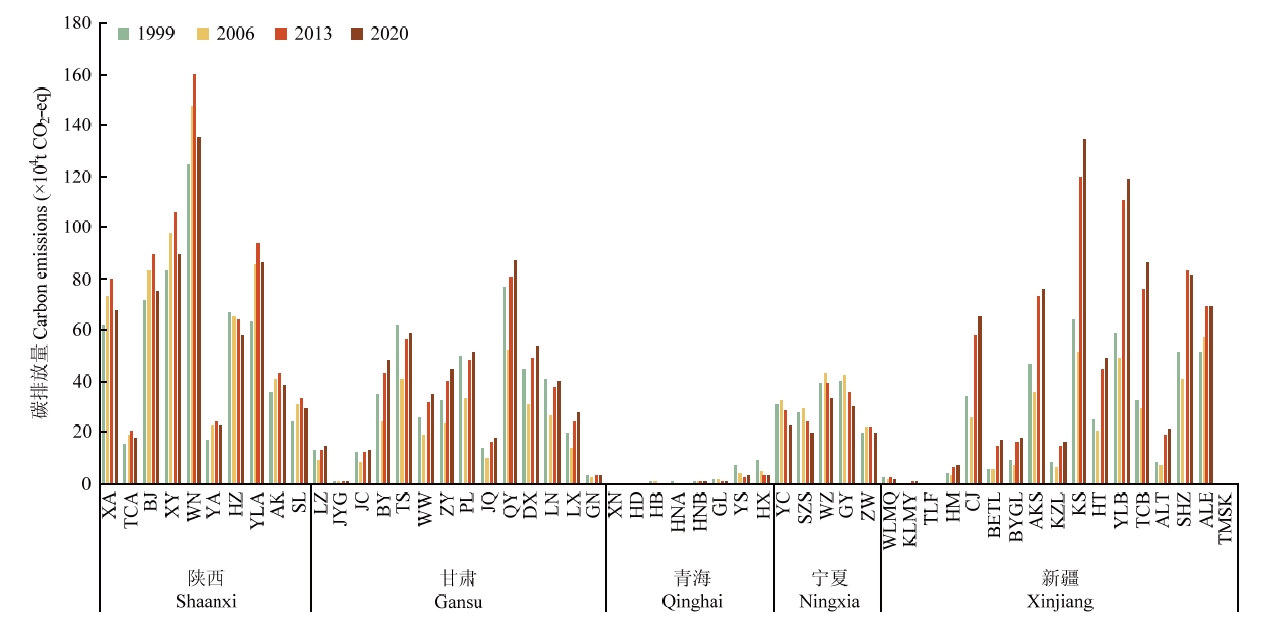

图2
西北地区粮食作物单位产量碳足迹和单位面积碳足迹"
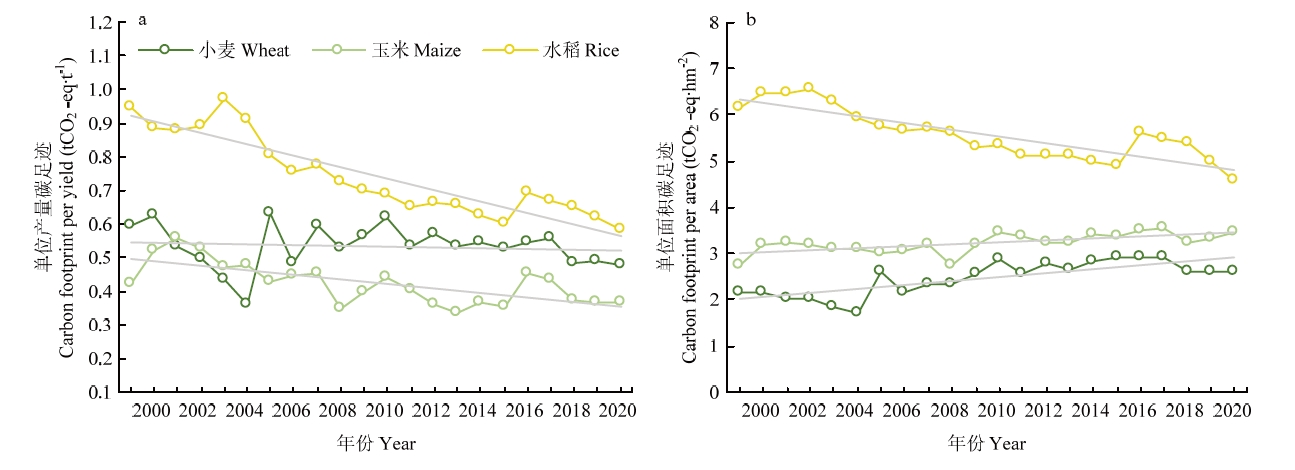

图3
西北地区粮食作物绿水总量和蓝水总量变化"
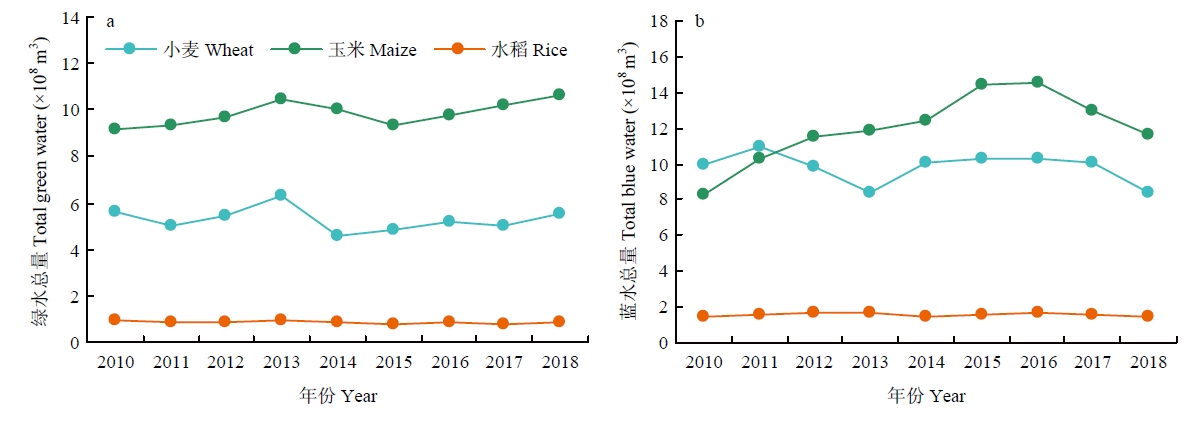
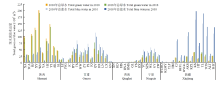
图4
2010和2018年西北地区粮食作物绿水、蓝水总量"
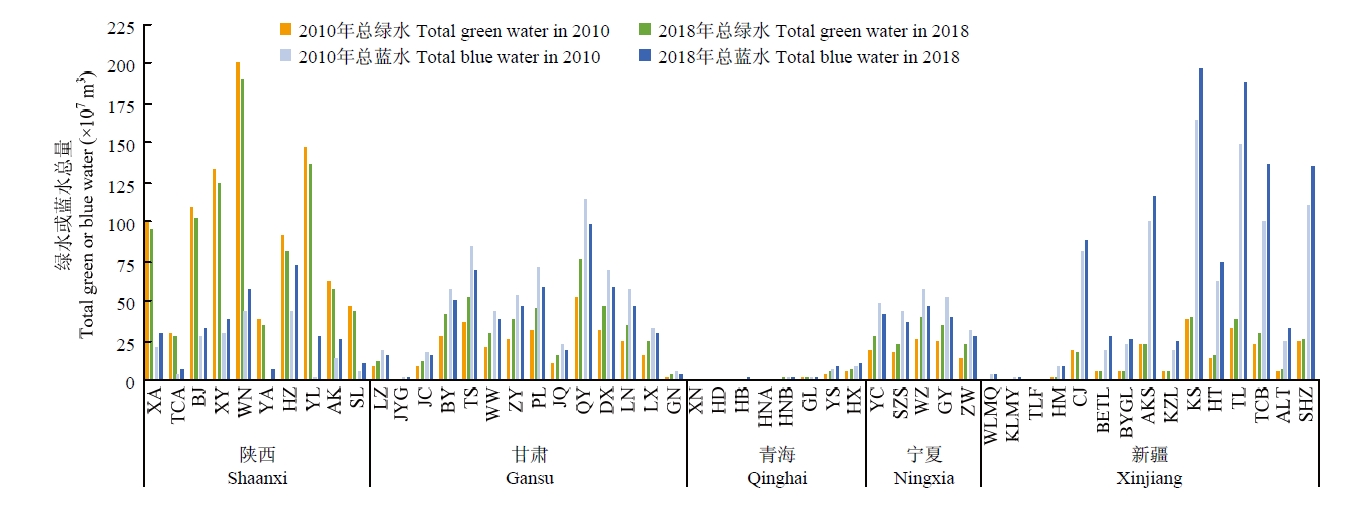
表9
不同优化情景西北五省(区)粮食作物种植面积变化"
| 作物 Crop | 优化前 Before optimization | 情景1 Scenario 1 | 情景2 Scenario 2 | 情景3 Scenario 3 | |
|---|---|---|---|---|---|
| 陕西 Shaanxi | 小麦 Wheat | 964190 | 974192 | 996224 | 953174 |
| 玉米 Maize | 1179440 | 1297384 | 943552 | 1415328 | |
| 水稻 Rice | 105090 | 94581 | 84072 | 105090 | |
| 甘肃 Gansu | 小麦 Wheat | 708720 | 779592 | 738268 | 850464 |
| 玉米 Maize | 1000810 | 850688.5 | 800648 | 903143 | |
| 水稻 Rice | 3390 | 3051 | 2712 | 3220.5 | |
| 青海 Qinghai | 小麦 Wheat | 94790 | 102132 | 87448 | 102132 |
| 玉米 Maize | 21370 | 23507 | 17096 | 25644 | |
| 宁夏 Ningxia | 小麦 Wheat | 92920 | 92920 | 111504 | 74336 |
| 玉米 Maize | 322730 | 355003 | 258184 | 385920 | |
| 水稻 Rice | 60820 | 63861 | 59135 | 63861 | |
| 新疆 Xinjiang | 小麦 Wheat | 1069020 | 1175922 | 1071986 | 1282824 |
| 玉米 Maize | 1051050 | 840840 | 840840 | 852206 | |
| 水稻 Rice | 47630 | 38104 | 38104 | 38104 |
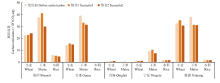
图5
不同优化情景下西北五省(区)粮食作物碳排放量变化"


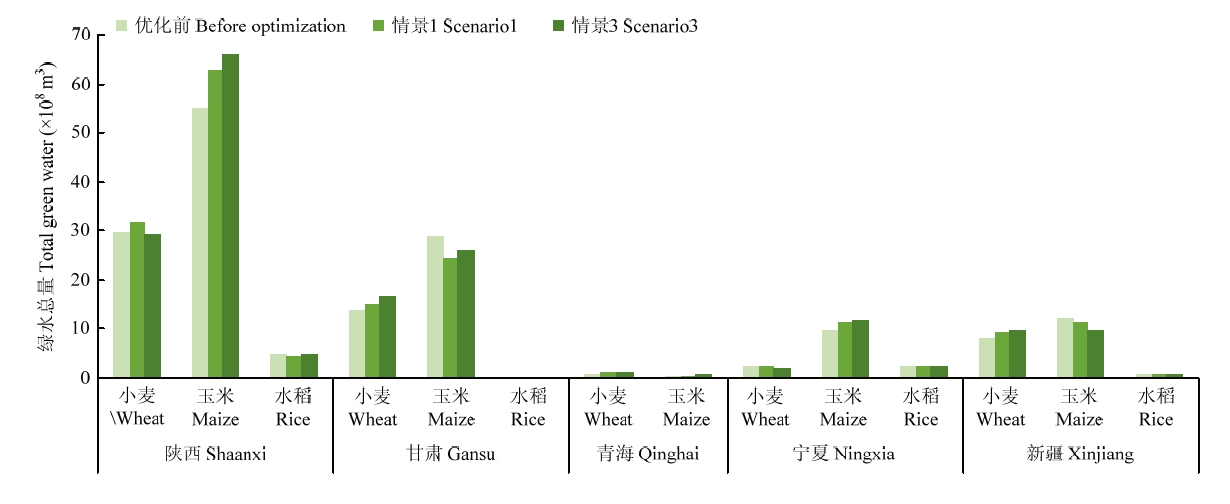
图6
不同优化情景下西北五省(区)粮食作物绿水总量变化"
| [1] |
张帆, 宣鑫, 金贵, 吴锋. 农业源非二氧化碳温室气体排放及情景模拟. 地理学报, 2023, 78(1): 35-53.
doi: 10.11821/dlxb202301003 |
|
doi: 10.11821/dlxb202301003 |
|
| [2] |
范紫月, 齐晓波, 曾麟岚, 吴锋. 中国农业系统近40年温室气体排放核算. 生态学报, 2022, 42(23): 9470-9482.
|
|
|
|
| [3] |
孙世坤, 刘文艳, 刘静, 王玉宝, 陈帝伊, 吴普特. 河套灌区春小麦生产水足迹影响因子敏感性及贡献率分析. 中国农业科学, 2016, 49(14): 2751-2762.doi: 10.3864/j.issn.0578-1752.2016.14.009.
|
|
|
|
| [4] |
doi: 10.1016/j.jclepro.2020.123347 |
| [5] |
doi: 10.1016/j.scitotenv.2021.149220 |
| [6] |
doi: 10.1016/S2095-3119(18)61928-8 |
| [7] |
doi: 10.1007/s11367-018-1481-5 |
| [8] |
doi: 10.1016/j.jclepro.2016.11.131 |
| [9] |
郭萍, 赵敏, 张妍, 张效星, 张帆. 基于水足迹的河套灌区多目标种植结构优化调整与评价. 农业机械学报, 2021, 52(12): 346-357.
|
|
|
|
| [10] |
聂媛, 李晓云, 江文曲, 刘念洁. 基于水足迹视角的中国北方10省三大粮食作物种植结构优化. 资源科学, 2022, 44(11): 2315-2329.
doi: 10.18402/resci.2022.11.12 |
|
doi: 10.18402/resci.2022.11.12 |
|
| [11] |
陈绪昊, 高强, 陈新平, 张务帅. 东北三省玉米生产资源投入和环境效应的时空特征. 中国农业科学, 2022, 55(16): 3170-3184. doi: 10.3864/j.issn.0578-1752.2022.16.009.
|
|
|
|
| [12] |
张惠云. 基于LCA的吉林省水稻生产水足迹和碳足迹的时空分异与影响因素研究[D]. 哈尔滨: 东北师范大学, 2021.
|
|
|
|
| [13] | |
|
|
|
| [14] |
|
| [15] |
|
| [16] |
doi: 10.1016/j.agwat.2021.107451 |
| [17] |
doi: 10.1016/j.agwat.2020.106473 |
| [18] |
罗万琦, 吕辛未, 吴从林, 杨洋, 崔远来, 罗玉峰. 中国主要稻区水稻灌溉需求变化及其规律分析. 节水灌溉, 2021(12): 1-7.
|
|
|
|
| [19] |
doi: 10.5194/bg-8-3011-2011 |
| [20] |
doi: 10.1016/j.atmosenv.2007.06.049 |
| [21] |
doi: 10.1016/j.envpol.2009.08.026 pmid: 19762135 |
| [22] |
doi: 10.1021/acs.est.9b01285 |
| [23] |
doi: 10.1016/j.ecolind.2016.01.001 |
| [24] |
doi: 10.1016/j.jclepro.2022.132285 |
| [25] |
doi: 10.1016/j.jclepro.2018.05.024 |
| [26] |
周志花. 利用LCA法核算农作物生产碳足迹[D]. 北京: 中国农业科学院, 2018.
|
|
|
|
| [27] |
冯靖仪. 稻田作物生产的碳足迹及化肥减施的温室气体减排潜力研究[D]. 杭州: 浙江大学, 2020.
|
|
|
|
| [28] |
冉锦成. 西北五省农业碳排放及影响因素研究[D]. 乌鲁木齐: 新疆农业大学, 2017.
|
|
|
|
| [29] |
李明琦, 刘世梁, 武雪, 孙永秀, 侯笑云, 赵爽. 云南省农田生态系统碳足迹时空变化及其影响因素. 生态学报, 2018, 38(24): 8822-8834.
|
|
|
|
| [30] |
林志敏, 李洲, 翁佩莹, 吴冬青, 邹京南, 庞孜钦, 林文雄. 再生稻田温室气体排放特征及碳足迹. 应用生态学报, 2022, 33(5): 1340-1351.
doi: 10.13287/j.1001-9332.202205.013 |
|
|
|
| [31] |
陈晓炜, 王小龙. 种养循环农作制度碳足迹评估: 以鲜食玉米-奶牛-粪便还田循环模式为例. 中国农业科学, 2023, 56(2): 314-332. doi: 10.3864/j.issn.0578-1752.2023.02.009.
|
|
|
|
| [32] |
刘巽浩, 徐文修, 李增嘉, 褚庆全, 杨晓琳, 陈阜. 农田生态系统碳足迹法: 误区、改进与应用: 兼析中国集约农作碳效率. 中国农业资源与区划, 2013, 34(6): 1-11.
|
|
|
|
| [33] |
doi: 10.3390/ijerph16173105 |
| [34] |
赵丽雯, 吉喜斌. 基于FAO-56双作物系数法估算农田作物蒸腾和土壤蒸发研究—以西北干旱区黑河流域中游绿洲农田为例. 中国农业科学, 2010, 43(19): 4016-4026.doi: 10.3864/j.issn.0578-1752.2010.19.014.
|
|
|
|
| [35] |
文冶强, 杨健, 尚松浩. 基于双作物系数法的干旱区覆膜农田耗水及水量平衡分析. 农业工程学报, 2017, 33(1): 138-147.
|
|
|
|
| [36] |
赵锦江, 马娟娟, 郑利剑, 孙西欢, 武朝宝. 基于双作物系数法估算晋南地区冬小麦-夏玉米轮作系统蒸散量. 节水灌溉, 2023(2): 28-37.
doi: 10.12396/jsgg.2022223 |
|
|
|
| [37] |
殷杰玲. 基于水足迹与虚拟水的灌区种植结构优化[D]. 杨凌: 西北农林科技大学, 2022.
|
|
|
|
| [38] |
陈世超, 刘文丰, 杜太生. 基于水氮管理与种植结构优化的作物丰产高效管理策略. 农业工程学报, 2022, 38(16): 144-152.
|
|
|
|
| [39] |
张传红, 韩露, 谢佳男, 靳浩, 刘翠英, 樊建凌. 江苏省主要农作物碳足迹动态及其构成研究. 南京信息工程大学学报(自然科学版), 2022, 14(1): 110-119.
|
|
|
|
| [40] |
doi: 10.1038/nature13609 |
| [41] |
王钰乔, 濮超, 赵鑫, 王兴, 刘胜利, 张海林. 中国小麦、 玉米碳足迹历史动态及未来趋势. 资源科学, 2018, 40(9): 1800-1811.
doi: 10.18402/resci.2018.09.10 |
|
doi: 10.18402/resci.2018.09.10 |
|
| [42] |
黄晓敏, 陈长青, 陈铭洲, 宋振伟, 邓艾兴, 张俊, 郑成岩, 张卫建. 2004—2013年东北三省主要粮食作物生产碳足迹. 应用生态学报, 2016, 27(10): 3307-3315.
doi: 10.13287/j.1001-9332.201610.036 |
|
|
|
| [43] |
doi: 10.1016/j.jclepro.2016.11.181 |
| [44] |
王玉宝, 吴楠, 张富尧, 李鑫, 刘荣, 殷杰玲. 基于三维水足迹模型的农业用水可持续性评估. 农业机械学报, 2023, 54(1): 287-295.
|
|
|
|
| [45] |
王圣云, 林玉娟. 中国区域农业生态效率空间演化及其驱动因素: 水足迹与灰水足迹视角. 地理科学, 2021, 41(2): 290-301.
doi: 10.13249/j.cnki.sgs.2021.02.012 |
|
|
|
| [46] |
doi: 10.1016/j.jclepro.2019.118939 |
| [1] | 周元清, 董红敏, 朱志平, 王悦, 李南西. 生猪养殖系统碳足迹评估研究进展[J]. 中国农业科学, 2024, 57(2): 379-389. |
| [2] | 陈晓炜, 王小龙. 种养循环农作制度碳足迹评估—以鲜食玉米-奶牛-粪便还田循环模式为例[J]. 中国农业科学, 2023, 56(2): 314-332. |
| [3] | 马佳玉, 王涛, 刘小利, 王丽, 张学成, 王文涛, 孔繁盛, 黄学郡, 王子怡, 王彦东, 甄文超. 覆盖作物对我国粮食作物的产量效应及影响因素的Meta分析[J]. 中国农业科学, 2023, 56(10): 1871-1880. |
| [4] | 乔远,杨欢,雒金麟,汪思娴,梁蓝月,陈新平,张务帅. 西北地区玉米生产投入及生态环境风险评价[J]. 中国农业科学, 2022, 55(5): 962-976. |
| [5] | 李晓立,何堂庆,张晨曦,田明慧,吴梅,李潮海,杨青华,张学林. 等氮量条件下有机肥替代化肥对玉米农田温室气体排放的影响[J]. 中国农业科学, 2022, 55(5): 948-961. |
| [6] | 邓远建,超博. 灰水足迹视角下我国省域农业生态效率及其影响因素[J]. 中国农业科学, 2022, 55(24): 4879-4894. |
| [7] | 陈绪昊,高强,陈新平,张务帅. 东北三省玉米生产资源投入和环境效应的时空特征[J]. 中国农业科学, 2022, 55(16): 3170-3184. |
| [8] | 吴秋琳,姜玉英,刘媛,刘杰,马景,胡高,杨明进,吴孔明. 草地贪夜蛾在中国西北地区的迁飞路径[J]. 中国农业科学, 2022, 55(10): 1949-1960. |
| [9] | 雷豪杰,李贵春,柯华东,魏崃,丁武汉,徐驰,李虎. 滴灌施肥对两种典型作物系统土壤N2O排放的影响及其调控差异[J]. 中国农业科学, 2021, 54(4): 768-779. |
| [10] | 张欣欣,石磊,何刚,王朝辉. 陕西省粮食生产的减肥潜力及经济环境效益[J]. 中国农业科学, 2020, 53(19): 4010-4023. |
| [11] | 刘松, 王效琴, 胡继平, 李强, 崔利利, 段雪琴, 郭亮. 施肥与灌溉对甘肃省苜蓿碳足迹的影响[J]. 中国农业科学, 2018, 51(3): 556-565. |
| [12] | 孙世坤,刘文艳,刘 静,王玉宝,陈帝伊,吴普特. 河套灌区春小麦生产水足迹影响因子敏感性及贡献率分析[J]. 中国农业科学, 2016, 49(14): 2751-2762. |
| [13] | 黄文强,董红敏,朱志平,刘翀,陶秀萍,王悦. 畜禽产品碳足迹研究进展与分析[J]. 中国农业科学, 2015, 48(1): 93-111. |
| [14] | 王占彪,王猛,陈阜. 华北平原作物生产碳足迹分析[J]. 中国农业科学, 2015, 48(1): 83-92. |
| [15] | 刘宪锋, 任志远. 西北地区植被覆盖变化及其与气候因子的关系[J]. 中国农业科学, 2012, 45(10): 1954-1963. |
|
||