


中国农业科学 ›› 2024, Vol. 57 ›› Issue (2): 379-389.doi: 10.3864/j.issn.0578-1752.2024.02.012
周元清1( ), 董红敏2(), 朱志平2, 王悦2, 李南西3
收稿日期:2023-05-12
接受日期:2023-09-15
出版日期:2024-01-16
发布日期:2024-01-19
通信作者:
联系方式:
周元清,E-mail:zyq732769@163.com。
基金资助:
ZHOU YuanQing1(), DONG HongMin2(), ZHU ZhiPing2, WANG Yue2, LI NanXi3
Received:2023-05-12
Accepted:2023-09-15
Published:2024-01-16
Online:2024-01-19
摘要:
【目的】 畜禽养殖业是重要的温室气体排放源,我国是生猪养殖大国,科学评估生猪养殖系统碳足迹,能够为畜牧业深入推进减排降碳提供参考借鉴。【方法】 本文中从碳足迹评估模型、评估方法和主要排放源三方面对国内外生猪养殖系统碳足迹评估研究现状进行梳理,围绕系统边界、排放源、核算方法以及单位选择等因素深入分析了评估结果差异性的成因,解析了饲料生产、粪污处理等环节对评估结果的影响。【结果】 目前国外对生猪养殖生产全生命周期的碳足迹评估形成了较为成熟的评估模型。每生产1 kg功能单位的猪肉碳足迹为2.2—10.3 kg CO2-eq。各研究中,不同评估方法会对评估结果产生较大影响。划定不同的系统边界、采用不同的功能单位,均会导致碳足迹评估结果出现差异。同时,在相同系统边界内,核算的排放源不同、同一排放源选取的参数不同,或者选择不同的分配方法也会影响评估结果。在生猪养殖生产系统中,饲料生产是对生猪生产系统碳足迹贡献最大的环节,占比为49%—83%。粪便管理环节的排放仅次于饲料生产环节,占比为12%—41%。【结论】 为了使我国生猪养殖系统的碳足迹评估更加精准和广泛,应开展针对中国不同区域不同养殖模式下温室气体排放关键参数的监测,根据我国生猪养殖系统发展现状建立适合本国国情的碳足迹评估数据库,统一评估方法,规范评估要求,创建符合地区实践的评估模型,为我国生猪养殖产业的可持续发展提供数据参考。
周元清, 董红敏, 朱志平, 王悦, 李南西. 生猪养殖系统碳足迹评估研究进展[J]. 中国农业科学, 2024, 57(2): 379-389.
ZHOU YuanQing, DONG HongMin, ZHU ZhiPing, WANG Yue, LI NanXi. Review on Carbon Footprint Assessment of Pig Farming System[J]. Scientia Agricultura Sinica, 2024, 57(2): 379-389.
表1
典型碳足迹评估模型"
| 模型名称 Model | 应用对象 Objective | 展现形式 Form | 系统边界 System boundary | 分配方法 Allocation method | 温室气体类型 GHGs | 核算方法 Method |
|---|---|---|---|---|---|---|
| GLEAM | 全球 Global | 无 None | 从饲料生产到零售消费 From feed production to consumption | 经济分配 Economic allocation | CO2、CH4、N2O、HCFs | IPCC (2006) Tier1 |
| CAPRI | 欧盟 EU | 网页 Website | 从饲料生产到零售消费 From feed production to consumption | 系统扩展 System expansion | CO2、CH4、 N2O | IPCC (2006) Tier1、GAINS数据库GAINS Database |
| ULICEES | 加拿大 Canada | 无 None | 从饲料生产到屠宰加工 From feed production to slaughter | 不分配、物理分配、经济分配 No allocation,physical allocation and economic allocation | CO2、CH4、 N2O | IPCC (2006) Tier2 |
| SustainPork | 企业 Enterprise | Excel | 从饲料生产到屠宰加工 From feed production to slaughter | 不分配、经济分配 No allocation,economic allocation | CO2、CH4、 N2O | IPCC (2006) Tier1 |
表2
国内外关于生猪养殖生产碳足迹研究的比较"
| 国家 Country | 碳足迹 CF (kg CO2-eq/FU) | 功能单位 Functional unit (FU) | 来源 Source |
|---|---|---|---|
| 全球 Global | 6.10 | 1 kg carcass weight | [ |
| 美国 America | 2.47 | 1 kg liveweight pig meat | [ |
| 2.70 | 1 kg carcass weight | [ | |
| 加拿大 Canada | 2.88a | 1 kg pork | [ |
| 4.15b | |||
| 4.43c | |||
| 中国(四川)China (Sichuan) | 5.42hou、4.29agg | 1 kg carcass weight | [ |
| 中国 China | 2.20 | 1 kg product | [ |
| 中国(河北)China (Hebei) | 2.72 | 1 kg liveweight | [ |
| 欧盟 EU | 4.80 | 1 kg pig meat slaughter weight | [ |
| 3.07n-LUC、5.37LUC | 1 kg carcass weight | [ | |
| 4.46n-LUC、5.79LUC | 1 kg carcass weight | [ | |
| 荷兰 Netherlands | 5.46 | 1 kg liveweight pig meat | [ |
| 瑞典 Sweden | 3.60 | 1 kg of bone and fat free meat | [ |
| 丹麦 Denmark | 3.60 | 1 kg pork | [ |
| 3.10 | 1 kg pork | [ | |
| 德国 Germany | 3.22 | 1 kg carcass deadweight | [ |
| 英国 UK | 6.40 | 1 kg carcass deadweight | [ |
| 3.30 | 1 kg liveweight pig meat | [ | |
| 3.50con 4.40org | 1 kg carcass deadweight | [ | |
| 法国 France | 2.30 | 1 kg liveweight pig meat | [ |
| 2.77 | 1 kg liveweight pig meat | [ | |
| 比利时 Belgium | 2.55 | 1 kg carcass weight pig meat | [ |
| 4.80 | 1 kg deboned pig meat | [ | |
| 西班牙 Spain | 6.70 | 1 kg of liveweight pork at farm gate | [ |
| 8.70 | 1 kg of carcass pork at slaughterhouse gate | ||
| 10.30 | 1 kg fresh/frozen cut pork | ||
| 10.70 | 1 kg ham (slicing and packaging) | ||
| 澳大利亚 Australia | 5.50 | 1 kg carcass weight | [ |
| 日本 Japan | 3.16 | 1 kg liveweight from 1 pig marketed at 115 kg | [ |
表3
生猪养殖生产系统碳足迹评估分配方法的总结"
| 来源 Source | 饲料生产子系统 Feed supply chain | 养殖场子系统(粪便施用) Farm (manure application) | 屠宰加工子系统 Slaughter-process |
|---|---|---|---|
| [ | 经济分配 Economic allocation | 系统分割(归入作物种植) System segmentation (subsumed into crop planting) | 系统分割(归入可食用部分)System segmentation (subsumed into edible parts) |
| [ | 经济分配 Economic allocation | 系统分割(归入作物种植) System segmentation (subsumed into crop planting) | -- |
| [ | 经济分配 Economic allocation | 系统扩展(抵消化肥施用) System expansion (offset fertilizer application) | 系统分割 System segmentation |
| [ | 经济分配 Economic allocation | 系统分割(归入作物种植) System segmentation (subsumed into crop planting) | -- |
| [ | 系统扩展 System expansion | 系统扩展(抵消化肥施用) System expansion (offset fertilizer application) | 系统扩展 System expansion |
| [ | 经济分配 Economic allocation | 系统分割(归入动物养殖) System segmentation (subsumed into animal feeding) | 系统分割 System segmentation |
| [ | 经济分配 Economic allocation | 物理分配(基于活性氮量) Physical allocation (based on active nitrogen content) | 经济分配 Economic allocation |
| [ | 系统扩展 System expansion | 系统扩展 System expansion | -- |
| [ | 物理分配(基于质量分数) Physical allocation (based on mass) | 系统扩展(抵消化肥施用) System expansion (offset fertilizer application) | -- |
| [ | 物理分配(基于能量值) Physical allocation (based on energy value) | 系统扩展(归入动物养殖) System expansion(subsumed into animal feeding) | -- |
| [ | 系统扩展 System expansion | 系统扩展 System expansion | 系统扩展 System expansion |
| [ | 经济分配 Economic allocation | 系统扩展 System expansion | 系统扩展 System expansion |
| [ | 经济分配 Economic allocation | 系统扩展(归入动物养殖) System expansion(subsumed into animal feeding) | 经济分配 Economic allocation |
| [ | 经济分配 Economic allocation | 经济分配 Economic allocation | -- |
| [ | 经济分配 Economic allocation | 系统扩展 System expansion | 系统分割(归入胴体可食部分) System segmentation (subsumed into edible parts of the carcass) |
| [ | 物理分配(基于含氮量) Physical allocation (based on nitrogen content) | 系统扩展 System expansion | 系统分割(归入胴体可食部分) System segmentation (subsumed into edible parts of the carcass) |
| [ | 经济分配 Economic allocation | 系统扩展 System expansion | 物理分配(基于质量分数) Physical allocation (based on mass) |

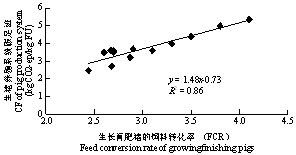
图1
生长育肥猪饲料转化率与生猪养殖生产系统总碳足迹的相关关系"
| [1] |
doi: 10.1016/j.ecolind.2011.06.017 |
| [2] |
doi: 10.1016/j.livsci.2009.11.007 |
| [3] |
国家统计局农村社会经济调查司, 2022中国农村统计年鉴. 中国统计出版社, 2022.
|
|
China Rual Statistical Yearbook, 2022, China Statistics Press. 2022. (in Chinese)
|
|
| [4] |
doi: 10.1016/j.jclepro.2015.10.059 |
| [5] |
姜明红, 刘欣超, 唐华俊, 辛晓平, 陈吉泉, 董刚, 吴汝群, 邵长亮. 生命周期评价在畜牧生产中的应用研究现状及展望. 中国农业科学, 2019, 52(9): 1635-1645. doi: 10.3864/j.issn.0578-1752.2019.09.014.
|
|
|
|
| [6] |
黄文强, 董红敏, 朱志平, 刘翀, 陶秀萍, 王悦. 畜禽产品碳足迹研究进展与分析. 中国农业科学, 2015, 48(1): 93-111.
doi: 10.3864/j.issn.0578-1752.2015.01.10 |
|
|
|
| [7] |
王效琴, 梁东丽, 王旭东, 彭莎, 郑金正. 运用生命周期评价方法评估奶牛养殖系统温室气体排放量. 农业工程学报, 2012, 28(13): 179-184.
|
|
|
|
| [8] |
周捷, 陈理, 吴树彪, 董仁杰, 庞昌乐. 猪粪管理系统温室气体排放研究. 十一五农业环境研究回顾与展望——第四届全国农业环境科学学术研讨会论文集. 呼和浩特, 2011: 687-692.
|
|
|
|
| [9] |
doi: 10.1016/j.aninu.2015.08.001 pmid: 29767170 |
| [10] |
doi: 10.1023/B:FRES.0000029678.25083.fa |
| [11] |
doi: 10.1021/acs.est.6b06430 |
| [12] |
doi: 10.1016/j.anifeedsci.2011.04.079 |
| [13] |
周谈龙, 尚斌, 董红敏, 朱志平, 陶秀萍, 张万钦. 低碳氮比条件下猪粪堆肥氨气和温室气体排放. 中国农业气象, 2017, 38(11): 689-698.
doi: 10.3969/j.issn.1000-6362.2017.11.001 |
|
|
|
| [14] |
|
| [15] |
doi: 10.1016/j.scitotenv.2017.12.197 |
| [16] |
doi: 10.1016/j.agsy.2017.11.001 |
| [17] |
doi: 10.1016/j.jclepro.2017.10.063 |
| [18] |
|
| [19] |
doi: 10.1016/j.jclepro.2016.06.078 |
| [20] |
doi: 10.1016/j.idairyj.2014.02.005 |
| [21] |
doi: 10.1016/j.gloenvcha.2014.02.004 |
| [22] |
doi: 10.1016/j.ecolind.2012.08.004 |
| [23] |
doi: 10.1021/es9032748 |
| [24] |
|
| [25] |
doi: 10.1021/es702969f |
| [26] |
doi: 10.1016/j.jclepro.2013.08.012 |
| [27] |
doi: 10.1007/s11367-014-0813-3 |
| [28] |
doi: 10.1016/j.jclepro.2011.11.046 |
| [29] |
|
| [30] |
ISO, 14044:Environmental Management - Life Cycle Assessment - Equirements and Guidelines. International Organization for Standardization, 2006.
|
| [31] |
BSI. Specification for the Assessment of the Life Cycle Greenhouse Gas Emissions of Goods and Services. BSI British Standards. ISBN, 2008, 978(0):580.
|
| [32] |
IPCC, 2006 IPCC Guidelines for National Greenhouse Gas Inventories. Institute for Global Environmental Strategies, Hayama, Kanagawa, Japan. 2006.
|
| [33] |
doi: 10.1016/j.agee.2011.12.015 |
| [34] |
doi: 10.1016/j.anifeedsci.2011.04.058 |
| [35] |
doi: 10.1016/j.jclepro.2015.11.046 |
| [36] |
doi: S0301-4797(16)30037-8 pmid: 26861226 |
| [37] |
doi: 10.1016/j.agsy.2010.07.001 |
| [38] |
|
| [39] |
doi: 10.1016/j.jclepro.2015.04.077 |
| [40] |
doi: 10.13031/trans.12805 |
| [41] |
doi: 10.1016/j.enpol.2009.12.051 |
| [42] |
doi: 10.1016/j.livsci.2012.07.008 |
| [43] |
|
| [44] |
doi: 10.1065/lca2007.06.342 |
| [45] |
|
| [46] |
doi: 10.1016/j.livsci.2013.09.001 |
| [47] |
|
| [48] |
|
| [49] |
|
| [50] |
doi: 10.1016/j.agee.2004.05.007 |
| [51] |
doi: 10.1016/j.livsci.2013.11.027 |
| [52] |
doi: 10.1080/03031853.2012.741208 |
| [53] |
doi: 10.1080/14735903.2013.798896 |
| [54] |
|
| [55] |
doi: 10.1080/00380768.2012.730476 |
| [56] |
|
| [57] |
|
| [58] |
doi: 10.1065/lca2004.06.160 |
| [59] |
|
| [60] |
|
| [61] |
ISO, Environmental Management-Life Cycle Assessment - Principles and Framework. International Organization for Standardization. 2006, 14040.
|
| [62] |
doi: 10.1088/1748-9326/8/3/034015 |
| [63] |
doi: 10.1071/AN15881 |
| [64] |
董红敏, 李玉娥, 陶秀萍, 彭小培, 李娜, 朱志平. 中国农业源温室气体排放与减排技术对策. 农业工程学报, 2008, 24(10): 269-273.
|
|
|
|
| [65] |
朱志平, 董红敏, 尚斌, 康国虎, 朱海生, 石谊. 规模化猪场固体粪便收集系数与成分测定. 农业工程学报, 2006, 22(S2): 179-182.
|
|
|
|
| [66] |
|
| [1] | 张晓战, 董轩志, 吕楠楠, 刘懿雯, 马新甜, 王林青, 夏艳勋, 蒋增海, 郭运泽, 赵攀登, 宋予震, 杨德成, 边传周. IRES核心区12-bp非连续插入突变对猪塞内卡病毒复制和细胞嗜性的影响[J]. 中国农业科学, 2024, 57(7): 1407-1416. |
| [2] | 王楚凡, 牛俊. 西北地区主要粮食作物种植的水、碳足迹及布局优化[J]. 中国农业科学, 2024, 57(6): 1137-1152. |
| [3] | 高尚洁, 刘杏认, 李迎春, 柳晓婉. 施用生物炭和秸秆还田对农田温室气体排放及增温潜势的影响[J]. 中国农业科学, 2024, 57(5): 935-949. |
| [4] | 郭娅, 任昊, 王洪章, 张吉旺, 赵斌, 任佰朝, 刘鹏. 高温干旱复合胁迫抑制夏玉米光系统Ⅱ性能降低籽粒产量[J]. 中国农业科学, 2024, 57(21): 4205-4220. |
| [5] | 龙怀玉, 卢昌艾, 冀宏杰, 张认连. 《第三次全国土壤普查暂行土壤分类系统》土类检索系统构建[J]. 中国农业科学, 2024, 57(21): 4264-4275. |
| [6] | 牛坤玉, 葛若昊, 陈美安, 金书秦, 刘静. 双碳目标下中国农食系统温室气体排放结构、发展趋势及国际比较[J]. 中国农业科学, 2024, 57(21): 4290-4307. |
| [7] | 陈妞, 余成敏, 崔百明, 任彩霞, 杨丽颖, 董钰, 刘琳, 郑银英. 解淀粉欧文氏菌噬菌体Kuerle的分离、基因组测定及其裂解功能分析[J]. 中国农业科学, 2024, 57(2): 295-305. |
| [8] | 江东, 王旭, 李仁静, 赵晓东, 戴祥生, 柳正葳. 基于GBS技术开展柚类资源群体遗传评价并发掘酸含量相关基因[J]. 中国农业科学, 2023, 56(8): 1547-1560. |
| [9] | 谢军, 尹学伟, 魏灵, 王子芳, 李清虎, 张晓春, 鲁远源, 王秋月, 高明. 垄作直播控制灌溉对水稻产量和温室气体排放的影响[J]. 中国农业科学, 2023, 56(4): 697-710. |
| [10] | 张卫建, 尚子吟, 张俊, 严圣吉, 邓艾兴, 张鑫, 郑成岩, 宋振伟. 农业温室气体排放统计核算体系的规范化建设[J]. 中国农业科学, 2023, 56(22): 4467-4477. |
| [11] | 唐伟, 张成玲, 杨冬静, 马居奎, 陈晶伟, 高方园, 谢逸萍, 孙厚俊. 我国甘薯E病毒全基因组序列特征及荧光定量检测技术的建立[J]. 中国农业科学, 2023, 56(20): 4010-4020. |
| [12] | 樊自尧, 李奎, 李家洋, 黄三文. “稻薯猪”生态循环农业的设想[J]. 中国农业科学, 2023, 56(20): 4067-4071. |
| [13] | 陈晓炜, 王小龙. 种养循环农作制度碳足迹评估—以鲜食玉米-奶牛-粪便还田循环模式为例[J]. 中国农业科学, 2023, 56(2): 314-332. |
| [14] | 刘蕾, 史建硕, 张国印, 郜静, 李玭, 任燕利, 王丽英. 长期施有机肥对设施番茄土壤稀有和丰富细菌亚群落的影响[J]. 中国农业科学, 2023, 56(18): 3615-3628. |
| [15] | 杜炳辰, 王铭, 刘春国, 王世达, 魏新宇, 路雅曼, 孙振钊, 刘在斯, 魏丽丽, 王靖飞, 杨德成. 盖塔病毒SC483株cDNA感染性克隆的构建[J]. 中国农业科学, 2023, 56(17): 3479-3486. |
|
||