


中国农业科学 ›› 2022, Vol. 55 ›› Issue (16): 3170-3184.doi: 10.3864/j.issn.0578-1752.2022.16.009
陈绪昊1( ),高强2,陈新平1,张务帅1()
收稿日期:2021-06-03
接受日期:2021-07-28
出版日期:2022-08-16
发布日期:2022-08-11
通讯作者:
张务帅
作者简介:陈绪昊,E-mail: 基金资助:
CHEN XuHao1(),GAO Qiang2,CHEN XinPing1,ZHANG WuShuai1()
Received:2021-06-03
Accepted:2021-07-28
Online:2022-08-16
Published:2022-08-11
Contact:
WuShuai ZHANG
摘要:
【目的】玉米的总产量在我国三大主粮作物中最高,位居世界第二位。东北三省玉米种植面积占全国的39%,而资源投入相对较低。本研究旨在明确东北三省玉米生产资源投入和环境效应的时空特征。【方法】基于生命周期评价(life cycle assessment)方法,采用适用于东北三省玉米生产的活性氮损失模型,定量化评价东北三省2007—2016年玉米生产系统的资源投入(肥料、农药和柴油等)及其相关的活性氮损失和温室气体排放等环境风险。【结果】东北三省玉米生产资源投入在时空尺度上均存在较大差异。吉林省玉米生产的平均总施肥量为400 kg·hm-2,单产为7 065 kg·hm-2,平均单位面积温室气体(GHG)排放量为2 965 kg CO2 eq·hm-2,均为三省最高,而碳、氮足迹较低,平均单位面积活性氮(Nr)损失量为中间水平且年际间变化不大。辽宁省的平均氮肥投入量为198 kg·hm-2,Nr损失量为20.8 kg N·hm-2,碳、氮足迹为493 kg CO2 eq·Mg-1和3.53 kg N·Mg-1,均为最高。单产为5 966 kg·hm-2,处于中等水平,GHG排放量年际间变化不大。黑龙江省平均施氮量为149 kg·hm-2,单产水平为5 318 kg·hm-2,Nr损失量和GHG排放量等均为三省最低,碳、氮足迹均处于中等水平。时间尺度上,2008—2015年东北三省玉米种植面积逐年增大,累积增加了5.73 Mhm2。2015年东北三省玉米产量最高,达91.2 Mt(百万吨);2007—2016年玉米平均总产量占全国的32%,其中黑龙江省、吉林省和辽宁省分别占13.9%、11.7%和6.7%;10年平均种植面积占全国的30%,其中黑龙江省、吉林省和辽宁省分别占14.7%、9.3%和6.4%。东北三省玉米10年平均单产为6 116 kg·hm-2,平均单产最高年份为2013年,为6 824 kg·hm-2。2007—2016年10年间东北三省玉米生产的肥料投入整体呈上升趋势,氮肥稳中有降,磷钾肥逐年升高,2014—2016年3年肥料增长趋势大幅减缓,逐渐趋于稳定,10年间氮、磷、钾肥平均用量分别为177、101和70.2 kg·hm-2。2007—2016年,东北玉米生产农药投入量呈现稳步上升趋势;柴油投入量前4年较为稳定,后逐渐上升。东北玉米生产10年间的平均农药用量为10.2 kg·hm-2,平均柴油用量为94.6 L·hm-2。10年间玉米生产(2007—2016)平均单位面积Nr损失量和GHG排放量分别为19.0 kg N·hm-2和2 770 kg CO2 eq·hm-2。Nr损失量10年间较为稳定。2007—2008和2009—2011年玉米生产的平均GHG排放量呈下降趋势,2012—2016年呈稳定上升趋势,2016年达到最高的3 045 kg CO2 eq·hm-2。氮肥田间施用产生的氨挥发是玉米生产中活性氮损失的主要途径,硝酸盐淋洗损失次之,而氧化亚氮排放占比最低。温室气体的主要排放环节为肥料生产运输与田间施用。10年间,东北玉米生产的平均氮足迹和碳足迹分别为3.16 kg N·Mg-1和459 kg CO2 eq·Mg-1。【结论】东北三省玉米生产的资源利用和环境代价在空间尺度上差异较明显,吉林省的平均肥料投入量比黑龙江省高124 kg·hm-2,GHG排放量高524 kg CO2 eq·hm-2;在时间尺度上,10年间东北三省玉米生产的氮肥投入量为170—182 kg·hm-2,Nr损失量变化范围为18.4—19.4 kg N·hm-2,为我国玉米主产区中较低的氮肥投入与损失量。玉米生产碳、氮足迹的高低主要取决于资源投入(尤其是氮肥投入)与单产水平之间的平衡。东北三省玉米生产资源投入和环境效应的时空特征分析有助于明确现阶段限制因素与主控因子,为优化养分管理实现粮食安全和碳减排的双赢提供理论支撑。
陈绪昊,高强,陈新平,张务帅. 东北三省玉米生产资源投入和环境效应的时空特征[J]. 中国农业科学, 2022, 55(16): 3170-3184.
CHEN XuHao,GAO Qiang,CHEN XinPing,ZHANG WuShuai. Temporal and Spatial Characteristics of Resources Input and Environmental Effects for Maize Production in the Three Provinces of Northeast China[J]. Scientia Agricultura Sinica, 2022, 55(16): 3170-3184.
表1
东北三省玉米生产2007—2016年的平均养分、农药和柴油投入量"
| 省份 Province | N (kg·hm-2) | P2O5 (kg·hm-2) | K2O (kg·hm-2) | 农药 Pesticide (kg·hm-2) | 柴油 Diesel (L·hm-2) |
|---|---|---|---|---|---|
| 辽宁Liaoning | 198±10.5 | 101±13.5 | 69.6±17.3 | 12.4±3.4 | 145±52.5 |
| 吉林Jilin | 184±7.9 | 122±18.1 | 93.7±21.2 | 9.7± 1.6 | 117±27.3 |
| 黑龙江Heilongjiang | 149±14.8 | 79.1±12.4 | 47.4±9.9 | 6.8±1.6 | 110±26.8 |
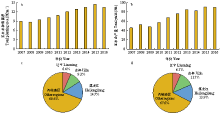
图1
2007—2016年东北三省玉米总种植面积(a)和总产量(b)以及平均种植面积(c)和平均总产量(d)在全国的占比"
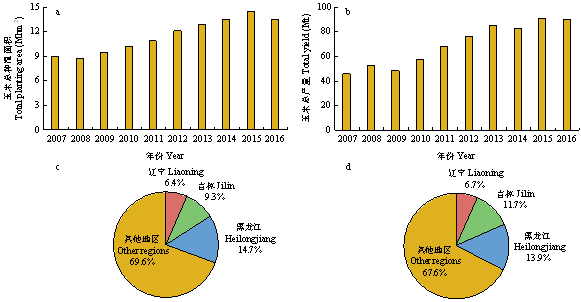
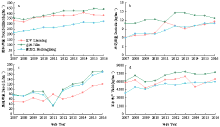
图2
东北三省玉米生产的肥料(a)、农药(b)、柴油(c)用量和单位面积产量(d)的年际变化"
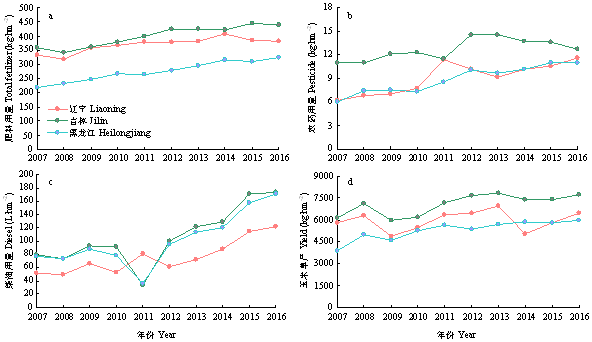
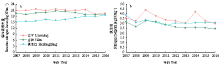
图3
东北三省玉米生产的活性氮损失(a)与氮足迹(b)的年际变化"

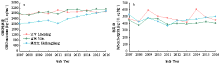
图4
东北三省玉米生产的温室气体排放(a)与碳足迹(b)的年际变化"
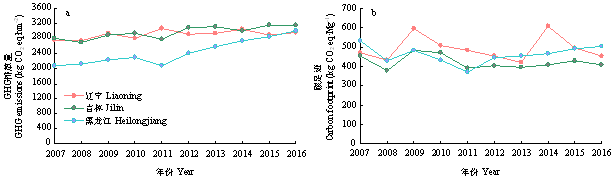
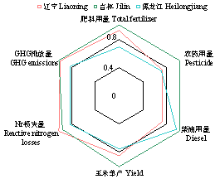
图5
东北三省资源投入与环境效应雷达图"
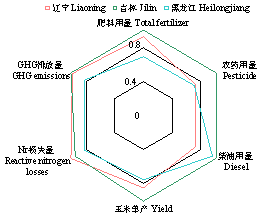
表2
东北三省和其余主产区玉米生产环境代价"
| 地区 Region | 活性氮损失量 Reactive N lossess (kg N·hm-2) | 氮足迹 N footprint (kg N·Mg-1) | GHG排放量 GHG emission (kg CO2 eq·hm-2) | 碳足迹 Carbon footprint (kg CO2 eq·Mg-1) | 数据来源 Data source |
|---|---|---|---|---|---|
| 辽宁 Liaoning | 20.8 | 3.53 | 2904 | 493 | 本文 This study |
| 吉林 Jiling | 19.6 | 2.80 | 2965 | 422 | 本文This study |
| 黑龙江 Heilongjiang | 16.7 | 3.17 | 2441 | 461 | 本文 This study |
| 黄淮海夏玉米区 HHH summer maize region | 79.3 | 14.7 | 3235 | 436 | [4,12] |
| 西北春玉米区 Northwest spring maize region | 24.8 | 4.52 | 3691 | 487 | [4,12] |
| 西南玉米区 Southwest maize region | 56.7 | 12.0 | 3870 | 710 | [4,12] |
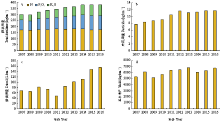
图6
不同年份东北三省玉米种植的肥料(a)、农药(b)、柴油(c)总用量和单位面积产量(d)的变化趋势"
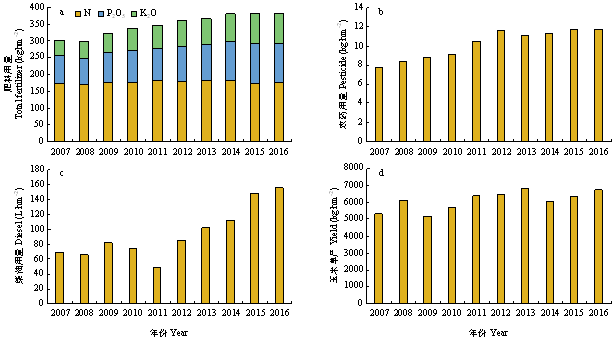

图7
不同年份东北三省玉米生产的活性氮损失(a)和氮足迹(b)"
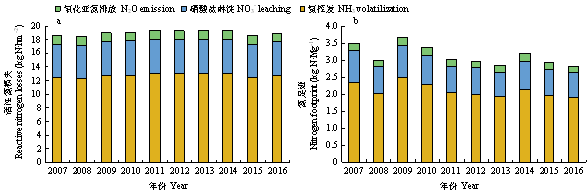
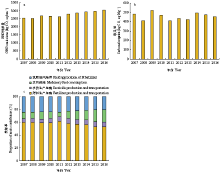
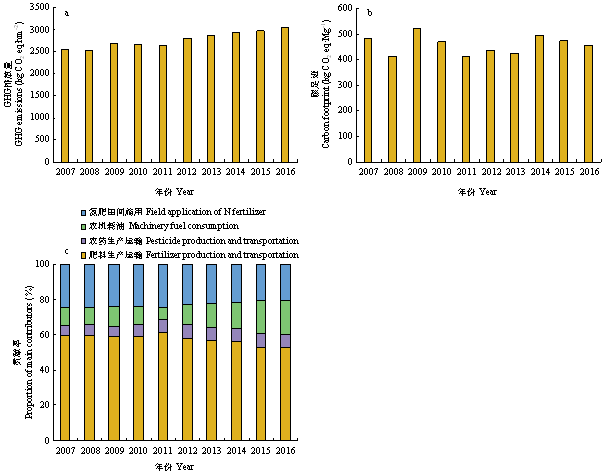
图8
东北三省不同年份玉米生产的温室气体总排放量(a)、碳足迹(b)与温室气体主要贡献环节占比(c)"
| [1] | 吴良泉, 武良, 崔振岭, 陈新平, 张福锁. 中国玉米区域氮磷钾肥推荐用量及肥料配方研究. 土壤学报, 2015, 52(4): 802-817. |
| WU L Q, WU L, CUI Z L, CHEN X P, ZHANG F S. Basic npk fertilizer recommendation and fertilizer formula for maize production regions in China. Acta Pedologica Sinica, 2015, 52(4): 802-817. (in Chinese) | |
| [2] | 中国农业年鉴编委会. 中国农业年鉴. 北京: 中国农业出版社, 2018. |
| China Agricultural Yearbook Editorial Board. China Agriculture Yearbook. Beijing: China Agriculture Press, 2018. (in Chinese) | |
| [3] | 中国农业年鉴编委会. 中国农业年鉴. 北京: 中国农业出版社, 2020. |
| China Agricultural Yearbook Editorial Board. China Agriculture Yearbook. Beijing: China Agriculture Press, 2020. (in Chinese) | |
| [4] | 武良. 基于总量控制的中国农业氮肥需求及温室气体减排潜力研究[D]. 北京: 中国农业大学, 2014. |
| WU L. Nitrogen fertilizer demand and greenhouse gas mitigation potential under nitrogen limiting conditions for Chinese agriculture production[D]. Beijing: China Agricultural University, 2014. (in Chinese) | |
| [5] |
JU X T, KOU C L, CHRISTIE P, DOU Z X, ZHANG F S. Changes in the soil environment from excessive application of fertilizers and manures to two contrasting intensive cropping systems on the North China Plain. Environmental Pollution, 2007, 145(2): 497-506. doi: 10.1016/j.envpol.2006.04.017.
doi: 10.1016/j.envpol.2006.04.017 |
| [6] | 王占彪, 王猛, 陈阜. 华北平原作物生产碳足迹分析. 中国农业科学, 2015, 48(1): 83-92. |
| WANG Z B, WANG M, CHEN F. Carbon footprint analysis of crop production in North China plain. Scientia Agricultura Sinica, 2015, 48(1): 83-92. (in Chinese) | |
| [7] |
CARLSON K M, GERBER J S, MUELLER N D, HERRERO M, MACDONALD G K, BRAUMAN K A, HAVLIK P, O’CONNELL C S, JOHNSON J A, SAATCHI S, WEST P C. Greenhouse gas emissions intensity of global croplands. Nature Climate Change, 2017, 7(1): 63-68. doi: 10.1038/nclimate3158.
doi: 10.1038/nclimate3158 |
| [8] | NDRC (National Development and Reform Commission of China) (2012). Second National Communication on Climate Change. The People’s Republic of China. Beijing: National Development and Reform Commission of China. Available from: http://nc.ccchina.gov.cn/WebSite/NationalCCC/UpFile/File116.pdf (verified 5 June 2012). |
| [9] |
CHEN X P, CUI Z L, FAN M S, VITOUSEK P, ZHAO M, MA W Q, WANG Z L, ZHANG W J, YAN X Y, YANG J C, DENG X P, GAO Q, ZHANG Q, GUO S W, REN J, LI S Q, YE Y L, WANG Z H, HUANG J L, TANG Q Y, SUN Y X, PENG X L, ZHANG J W, HE M R, ZHU Y J, XUE J Q, WANG G L, WU L, AN N, WU L Q, MA L, ZHANG W F, ZHANG F S. Producing more grain with lower environmental costs. Nature, 2014, 514(7523): 486-489. doi: 10.1038/ nature13609.
doi: 10.1038/ nature13609 |
| [10] |
张国, 逯非, 黄志刚, 陈舜, 王效科. 我国主粮作物的化学农药用量及其温室气体排放估算. 应用生态学报, 2016, 27(9): 2875-2883. doi: 10.13287/j.1001-9332.201609.031.
doi: 10.13287/j.1001-9332.201609.031 |
|
ZHANG G, LU F, HUANG Z G, CHEN S, WANG X K. Estimations of application dosage and greenhouse gas emission of chemical pesticides in staple crops in China. Chinese Journal of Applied Ecology, 2016, 27(9): 2875-2883. doi: 10.13287/j.1001-9332.201609. 031. (in Chinese)
doi: 10.13287/j.1001-9332.201609.031 |
|
| [11] |
ZHANG G, WANG X K, SUN B F, ZHAO H, LU F, ZHANG L. Status of mineral nitrogen fertilization and net mitigation potential of the state fertilization recommendation in Chinese cropland. Agricultural Systems, 2016, 146: 1-10. doi: 10.1016/j.agsy.2016. 03.012.
doi: 10.1016/j.agsy.2016. 03.012 |
| [12] | 张务帅. 我国玉米生产温室气体排放和活性氮损失评价及其减排潜力与调控途[D]. 北京: 中国农业大学, 2019. |
| ZHANG W S. Greenhouse gas emissions and reactive nitrogen losses assessment, mitigation potentials and management approaches of maize production in China[D]. Beijing: China Agricultural University, 2019. (in Chinese) | |
| [13] | 姜明红, 刘欣超, 唐华俊, 辛晓平, 陈吉泉, 董刚, 吴汝群, 邵长亮. 生命周期评价在畜牧生产中的应用研究现状及展望. 中国农业科学, 2019, 52(9): 1635-1645. |
| JIANG M H, LIU X C, TANG H J, XIN X P, CHEN J Q, DONG G, WU R Q, SHAO C L. Research progress and prospect of life cycle assessment in animal husbandry. Scientia Agricultura Sinica, 2019, 52(9): 1635-1645. (in Chinese) | |
| [14] |
CUI Z L, ZHANG H Y, CHEN X P, ZHANG C C, MA W Q, HUANG C D, ZHANG W F, MI G H, MIAO Y X, LI X L, GAO Q, YANG J C, WANG Z H, YE Y L, GUO S W, LU J W, HUANG J L, LV S H, SUN Y X, LIU Y Y, PENG X L, REN J, LI S Q, DENG X P, SHI X J, ZHANG Q, YANG Z P, TANG L, WEI C Z, JIA L L, ZHANG J W, HE M R, TONG Y N, TANG Q Y, ZHONG X H, LIU Z H, CAO N, KOU C L, YING H, YIN Y L, JIAO X Q, ZHANG Q S, FAN M S, JIANG R F, ZHANG F S, DOU Z X. Pursuing sustainable productivity with millions of smallholder farmers. Nature, 2018, 555(7696): 363-366. doi: 10.1038/nature25785.
doi: 10.1038/nature25785 |
| [15] | IPCC. Climate Change 2013:The physical science basis. Contribution of Working Group I to the Fifth Assessment Report of the Intergovernmental Panel on Climate Change. Cambridge: Cambridge University Press, 2013. |
| [16] |
ZHANG W F, DOU Z X, HE P, JU X T, POWLSON D, CHADWICK D, NORSE D, LU Y L, ZHANG Y, WU L, CHEN X P, CASSMAN K G, ZHANG F S. New technologies reduce greenhouse gas emissions from nitrogenous fertilizer in China. Proceedings of the National Academy of Sciences of the United States of America, 2013, 110(21): 8375-8380. doi: 10.1073/pnas.1210447110.
doi: 10.1073/pnas.1210447110 |
| [17] | IPCC. Guildelines for National Greenhouse Gas Inventories, vol. 4: Agriculture, Forestry and Other Land Use. Prepared by the National Greenhouse Gas Inventories Programmer. Japan, 2006. |
| [18] |
狄向华, 聂祚仁, 左铁镛. 中国火力发电燃料消耗的生命周期排放清单. 中国环境科学, 2005, 25(5): 632-635. doi: 10.3321/j.issn:1000-6923.2005.05.029.
doi: 10.3321/j.issn:1000-6923.2005.05.029 |
|
DI X H, NIE Z R, ZUO T Y. Life cycle emission inventories for the fuels consumed by thermal power in China. China Environmental Science, 2005, 25(5): 632-635. doi: 10.3321/j.issn:1000-6923.2005.05.029. (in Chinese)
doi: 10.3321/j.issn:1000-6923.2005.05.029 |
|
| [19] |
袁宝荣, 聂祚仁, 狄向华, 左铁镛. 中国化石能源生产的生命周期清单(Ⅰ): 能源消耗与直接排放. 现代化工, 2006, 26(3): 59-62, 64. doi: 10.16606/j.cnki.issn0253-4320.2006.03.017.
doi: 10.16606/j.cnki.issn0253-4320.2006.03.017 |
|
YUAN B R, NIE Z R, DI X H, ZUO T Y. Life cycle inventories of fossil fuels in China(Ⅰ): energy sources consumption and direct pollutant emissions. Modern Chemical Industry, 2006, 26(3): 59-62, 64. doi: 10.16606/j.cnki.issn0253-4320.2006.03.017. (in Chinese)
doi: 10.16606/j.cnki.issn0253-4320.2006.03.017 |
|
| [20] |
袁宝荣, 聂祚仁, 狄向华, 左铁镛. 中国化石能源生产的生命周期清单(Ⅱ): 生命周期清单的编制结果. 现代化工, 2006, 26(4): 59-61. doi: 10.16606/j.cnki.issn0253-4320.2006.04.019.
doi: 10.16606/j.cnki.issn0253-4320.2006.04.019 |
|
YUAN B R, NIE Z R, DI X H, ZUO T Y. Life cycle inventories of fossil fuels in China(Ⅱ): final life cycle inventories. Modern Chemical Industry, 2006, 26(4): 59-61. doi: 10.16606/j.cnki.issn0253-4320.2006.04.019. (in Chinese)
doi: 10.16606/j.cnki.issn0253-4320.2006.04.019 |
|
| [21] | WILLIAMS A G, AUDSLEY E, SANDARS D L. Determining the environmental burdens and resource use in the production of agricultural and horticultural commodities. Final report to Defra on project IS0205. Available on www.agrilca.org and www.defra.gov.uk. 2006. |
| [22] |
李晓立, 何堂庆, 张晨曦, 田明慧, 吴梅, 李潮海, 杨青华, 张学林. 等氮量条件下有机肥替代化肥对玉米农田温室气体排放的影响. 中国农业科学, 2022, 55(5): 948-961. doi: 10.3864/j.issn.0578-1752.2022.05.009.
doi: 10.3864/j.issn.0578-1752.2022.05.009 |
|
LI X L, HE T Q, ZHANG C X, TIAN M H, WU M, LI C H, YANG Q H, ZHANG X L. Effect of organic fertilizer replacing chemical fertilizers on greenhouse gas emission under the conditions of same nitrogen fertilizer input in maize farmland. Scientia Agricultura Sinica, 2022, 55(5): 948-961. doi: 10.3864/j.issn.0578-1752.2022.05.009. (in Chinese)
doi: 10.3864/j.issn.0578-1752.2022.05.009 |
|
| [23] |
JAYASUNDARA S, WAGNER-RIDDLE C, DIAS G, KARIYAPPERUMA K A. Energy and greenhouse gas intensity of corn (Zea mays L.) production in Ontario: a regional assessment. Canadian Journal of Soil Science, 2014, 94(1): 77-95. doi: 10.4141/cjss2013-044.
doi: 10.4141/cjss2013-044 |
| [24] | 齐晔, 李惠民, 王晓. 农业与中国的低碳发展战略. 中国农业科学, 2012, 45(1): 1-6. |
| QI Y, LI H M, WANG X. Agriculture and low-carbon development strategy in China. Scientia Agricultura Sinica, 2012, 45(1): 1-6. (in Chinese) | |
| [25] |
GRASSINI P, CASSMAN K G. High-yield maize with large net energy yield and small global warming intensity. Proceedings of the National Academy of Sciences of the United States of America, 2012, 109(4): 1074-1079. doi: 10.1073/pnas.1116364109.
doi: 10.1073/pnas.1116364109 |
| [26] |
FELTEN D, FRÖBA N, FRIES J, EMMERLING C. Energy balances and greenhouse gas-mitigation potentials of bioenergy cropping systems (Miscanthus, rapeseed, and maize) based on farming conditions in Western Germany. Renewable Energy, 2013, 55: 160-174. doi: 10.1016/j.renene.2012.12.004.
doi: 10.1016/j.renene.2012.12.004 |
| [27] |
FORTE A, FAGNANO M, FIERRO A. Potential role of compost and green manure amendment to mitigate soil GHGs emissions in Mediterranean drip irrigated maize production systems. Journal of Environmental Management, 2017, 192: 68-78. doi: 10.1016/j. jenvman.2017.01.037.
doi: 10.1016/j. jenvman.2017.01.037 |
| [28] |
MA B L, LIANG B C, BISWAS D K, MORRISON M J, MCLAUGHLIN N B. The carbon footprint of maize production as affected by nitrogen fertilizer and maize-legume rotations. Nutrient Cycling in Agroecosystems, 2012, 94(1): 15-31. doi: 10.1007/s10705- 012-9522-0.
doi: 10.1007/s10705- 012-9522-0 |
| [29] |
DENDOOVEN L, GUTIÉRREZ-OLIVA V F, PATIÑO-ZÚÑIGA L, RAMÍREZ-VILLANUEVA D A, VERHULST N, LUNA-GUIDO M, MARSCH R, MONTES-MOLINA J, GUTIÉRREZ-MICELI F A, VÁSQUEZ-MURRIETA S, GOVAERTS B. Greenhouse gas emissions under conservation agriculture compared to traditional cultivation of maize in the central Highlands of Mexico. Science of the Total Environment, 2012, 431: 237-244. doi: 10.1016/j.scitotenv. 2012.05.029.
doi: 10.1016/j.scitotenv. 2012.05.029 |
| [30] |
HE X Q, QIAO Y H, LIU Y X, DENDLER L, YIN C, MARTIN F. Environmental impact assessment of organic and conventional tomato production in urban greenhouses of Beijing City, China. Journal of Cleaner Production, 2016, 134: 251-258. doi: 10.1016/j.jclepro.2015. 12.004.
doi: 10.1016/j.jclepro.2015. 12.004 |
| [31] |
MUELLER N D, GERBER J S, JOHNSTON M, RAY D K, RAMANKUTTY N, FOLEY J A. Closing yield gaps through nutrient and water management. Nature, 2012, 490(7419): 254-257. doi: 10. 1038/nature11420.
doi: 10. 1038/nature11420 |
| [32] |
ZHANG Z S, GUO L J, LIU T Q, LI C F, CAO C G. Effects of tillage practices and straw returning methods on greenhouse gas emissions and net ecosystem economic budget in rice-wheat cropping systems in central China. Atmospheric Environment, 2015, 122: 636-644. doi: 10.1016/j.atmosenv.2015.09.065.
doi: 10.1016/j.atmosenv.2015.09.065 |
| [33] |
丁相鹏, 李广浩, 张吉旺, 刘鹏, 任佰朝, 赵斌. 控释尿素基施深度对夏玉米产量和氮素利用的影响. 中国农业科学, 2020, 53(21): 4342-4354. doi: 10.3864/j.issn.0578-1752.2020.21.004.
doi: 10.3864/j.issn.0578-1752.2020.21.004 |
|
DING X P, LI G H, ZHANG J W, LIU P, REN B Z, ZHAO B. Effects of base application depths of controlled release urea on yield and nitrogen utilization of summer maize. Scientia Agricultura Sinica, 2020, 53(21): 4342-4354. doi: 10.3864/j.issn.0578-1752.2020.21.004. (in Chinese)
doi: 10.3864/j.issn.0578-1752.2020.21.004 |
|
| [34] | GRANT C. Policy aspects related to the use of enhanced-efficiency fertilizers:viewpoint of the scientific community. In: IFA International Workshop on Enhanced-Efficiency Fertilizers. Frankfurt: International Fertilizer Association, 2005: 1-11. |
| [35] |
BOLAN N S, SAGGAR S, LUO J F, BHANDRAL R, SINGH J. Gaseous emissions of nitrogen from grazed pastures: processes, measurements and modelling, environmental implications, and mitigation. Advances in Agronomy. Amsterdam: Elsevier, 2004: 37-120. doi: 10.1016/s0065-2113(04)84002-1.
doi: 10.1016/s0065-2113(04)84002-1 |
| [36] |
LI T Y, ZHANG W F, YIN J, CHADWICK D, NORSE D, LU Y L, LIU X J, CHEN X P, ZHANG F S, POWLSON D, DOU Z X. Enhanced-efficiency fertilizers are not a panacea for resolving the nitrogen problem. Global Change Biology, 2018, 24(2): e511-e521. doi: 10.1111/gcb.13918.
doi: 10.1111/gcb.13918 |
| [37] |
HAN J P, SHI L S, WANG Y K, CHEN Z W, WU L S. The regulatory role of endogenous iron on greenhouse gas emissions under intensive nitrogen fertilization in subtropical soils of China. Environmental Science and Pollution Research International, 2018, 25(15): 14511-14520. doi: 10.1007/s11356-018-1666-2.
doi: 10.1007/s11356-018-1666-2 |
| [38] |
ZHANG X X, SUN H F, WANG J L, ZHANG J N, LIU G L, ZHOU S. Effect of moisture gradient on rice yields and greenhouse gas emissions from rice paddies. Environmental Science and Pollution Research International, 2019, 26(32): 33416-33426. doi: 10.1007/ s11356-019-06451-w.
doi: 10.1007/ s11356-019-06451-w |
| [39] |
RADA N E, FUGLIE K O. New perspectives on farm size and productivity. Food Policy, 2019, 84: 147-152. doi: 10.1016/j.foodpol.2018.03.015.
doi: 10.1016/j.foodpol.2018.03.015 |
| [40] |
SYP A, FABER A, BORZECKA-WALKER M, OSUCH D. Assessment of greenhouse gas emissions in winter wheat farms using data envelopment analysis approach. Polish Journal of Environmental Studies, 2015, 24: 2197-2203. doi: 10.15244/pjoes/39682.
doi: 10.15244/pjoes/39682 |
| [41] |
ZHANG W S, QIAN C R, CARLSON K M, GE X L, WANG X B, CHEN X P. Increasing farm size to improve energy use efficiency and sustainability in maize production. Food and Energy Security, 2021, 10(1): e271. doi: 10.1002/fes3.271.
doi: 10.1002/fes3.271 |
| [42] |
ZHU Y C, WAQAS M A, LI Y E, ZOU X X, JIANG D F, WILKES A, QIN X B, GAO Q Z, WAN Y F, HASBAGAN G. Large-scale farming operations are win-win for grain production, soil carbon storage and mitigation of greenhouse gases. Journal of Cleaner Production, 2018, 172: 2143-2152. doi: 10.1016/j.jclepro.2017.11.205.
doi: 10.1016/j.jclepro.2017.11.205 |
| [1] | 陈晓炜, 王小龙. 种养循环农作制度碳足迹评估—以鲜食玉米-奶牛-粪便还田循环模式为例[J]. 中国农业科学, 2023, 56(2): 314-332. |
| [2] | 柴海燕,贾娇,白雪,孟玲敏,张伟,金嵘,吴宏斌,苏前富. 吉林省玉米穗腐病致病镰孢菌的鉴定与部分菌株对杀菌剂的敏感性[J]. 中国农业科学, 2023, 56(1): 64-78. |
| [3] | 赵政鑫,王晓云,田雅洁,王锐,彭青,蔡焕杰. 未来气候条件下秸秆还田和氮肥种类对夏玉米产量及土壤氨挥发的影响[J]. 中国农业科学, 2023, 56(1): 104-117. |
| [4] | 李周帅,董远,李婷,冯志前,段迎新,杨明羡,徐淑兔,张兴华,薛吉全. 基于杂交种群体的玉米产量及其配合力的全基因组关联分析[J]. 中国农业科学, 2022, 55(9): 1695-1709. |
| [5] | 熊伟仡,徐开未,刘明鹏,肖华,裴丽珍,彭丹丹,陈远学. 不同氮用量对四川春玉米光合特性、氮利用效率及产量的影响[J]. 中国农业科学, 2022, 55(9): 1735-1748. |
| [6] | 李易玲,彭西红,陈平,杜青,任俊波,杨雪丽,雷鹿,雍太文,杨文钰. 减量施氮对套作玉米大豆叶片持绿、光合特性和系统产量的影响[J]. 中国农业科学, 2022, 55(9): 1749-1762. |
| [7] | 郭世博,张方亮,张镇涛,周丽涛,赵锦,杨晓光. 全球气候变暖对中国种植制度的可能影响XIV.东北大豆高产稳产区及农业气象灾害分析[J]. 中国农业科学, 2022, 55(9): 1763-1780. |
| [8] | 马小艳,杨瑜,黄冬琳,王朝辉,高亚军,李永刚,吕辉. 小麦化肥减施与不同轮作方式的周年养分平衡及经济效益分析[J]. 中国农业科学, 2022, 55(8): 1589-1603. |
| [9] | 李前,秦裕波,尹彩侠,孔丽丽,王蒙,侯云鹏,孙博,赵胤凯,徐晨,刘志全. 滴灌施肥模式对玉米产量、养分吸收及经济效益的影响[J]. 中国农业科学, 2022, 55(8): 1604-1616. |
| [10] | 张家桦,杨恒山,张玉芹,李从锋,张瑞富,邰继承,周阳晨. 不同滴灌模式对东北春播玉米籽粒淀粉积累及淀粉相关酶活性的影响[J]. 中国农业科学, 2022, 55(7): 1332-1345. |
| [11] | 谭先明,张佳伟,王仲林,谌俊旭,杨峰,杨文钰. 基于PLS的不同水氮条件下带状套作玉米产量预测[J]. 中国农业科学, 2022, 55(6): 1127-1138. |
| [12] | 冯宣军, 潘立腾, 熊浩, 汪青军, 李静威, 张雪梅, 胡尔良, 林海建, 郑洪建, 卢艳丽. 南方地区120份甜、糯玉米自交系重要目标性状和育种潜力分析[J]. 中国农业科学, 2022, 55(5): 856-873. |
| [13] | 刘苗,刘朋召,师祖姣,王小利,王瑞,李军. 氮磷配施下夏玉米临界氮浓度稀释曲线的构建与氮营养诊断[J]. 中国农业科学, 2022, 55(5): 932-947. |
| [14] | 李晓立,何堂庆,张晨曦,田明慧,吴梅,李潮海,杨青华,张学林. 等氮量条件下有机肥替代化肥对玉米农田温室气体排放的影响[J]. 中国农业科学, 2022, 55(5): 948-961. |
| [15] | 乔远,杨欢,雒金麟,汪思娴,梁蓝月,陈新平,张务帅. 西北地区玉米生产投入及生态环境风险评价[J]. 中国农业科学, 2022, 55(5): 962-976. |
|
||