


中国农业科学 ›› 2024, Vol. 57 ›› Issue (8): 1469-1489.doi: 10.3864/j.issn.0578-1752.2024.08.005
张素心1( ), 申格2, 余强毅1(), 吴文斌1
收稿日期:2023-07-07
接受日期:2023-10-09
出版日期:2024-04-16
发布日期:2024-04-24
通信作者:
联系方式:
张素心,E-mail:82101212294@caas.cn。
基金资助:
ZHANG SuXin1(), SHEN Ge2, YU QiangYi1(), WU WenBin1
Received:2023-07-07
Accepted:2023-10-09
Published:2024-04-16
Online:2024-04-24
摘要:
【目的】耕地种植制度是农业生产方式的具体体现,其形成受自然资源要素与人类土地利用行为综合影响,反映了“人类-自然”的耦合关系。本研究旨在科学掌握全国耕地种植制度格局,为优化农业生产布局、提高农业生产能力、推动农业可持续性发展提供依据。【方法】结合遥感监测与空间决策树模型等手段,构建适合我国农情的跨年度种植制度探测方法体系,并开展空间格局分析。首先,通过辨析种植强度、复种指数等概念,从长期性、周期性、稳定性等方面,定义种植制度的内涵;其次,构建连续度、频度指标,并利用基于时序遥感的2001—2018年中国复种指数监测结果,结合时间滑动窗口方法,在像元尺度分别计算两个指标的具体值;最后,评估耕地的种植强度与种植制度特征的显著性,利用决策树方法确定种植制度类型,从区域差异、动态规律等方面分析不同区域种植制度的时空异质特征。【结果】(1)面积上看,一年一熟所占面积最大,占53.52%,超过耕地总面积的一半;其次是一年两熟,占23.28%,季节性休耕(如两年三熟)与年度休耕分别占12.80%和6.94%。(2)空间上看,一年一熟、一年两熟、季节性休耕与年度休耕的集中分布区分别为东北地区、华北地区、长江以南地区与“镰刀弯”地区。(3)时间上看,动态稳定的种植制度从时间维度上揭示了静态复种指数背后的异质性,例如,2018年复种指数为1的区域,其中75.18%属于一年一熟、6.60%属于一年两熟、8.92%属于季节性休耕、8.02%属于年度休耕。【结论】本研究提出了一种结合时序遥感监测与空间决策树模型的跨年度分类体系,揭示了中国耕地种植制度分区聚集、种植强度南高北低的空间格局,直观展现了松嫩平原、“镰刀弯”等空间聚集区;分析了耕地复种与种植制度的时空差异特征,主要表现在种植制度与年度复种指数的空间不一致性,以及种植制度特有的周期性。研究结果可为合理提高耕地复种强度、推动实施“藏粮于地”战略提供案例支撑。
张素心, 申格, 余强毅, 吴文斌. 中国耕地种植制度遥感探测及其时空特征[J]. 中国农业科学, 2024, 57(8): 1469-1489.
ZHANG SuXin, SHEN Ge, YU QiangYi, WU WenBin. Remote Sensing Detection of Cropping System and Its Spatial-Temporal Pattern in China[J]. Scientia Agricultura Sinica, 2024, 57(8): 1469-1489.
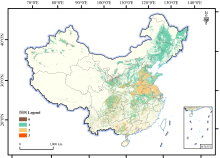
图1
2018年全国复种指数图 审图号:GS京(2024)0621号"

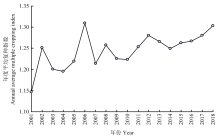
图2
2001—2018年复种指数年度均值变化图"
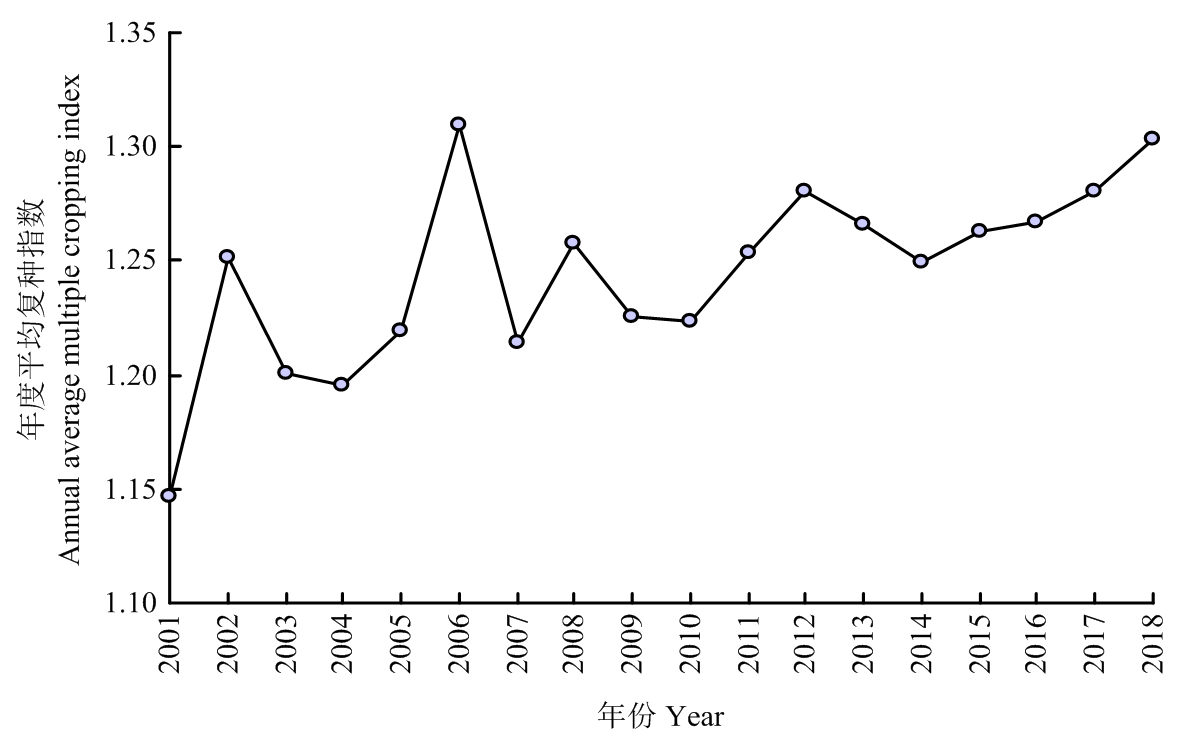
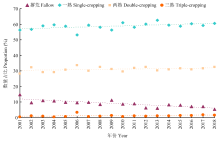
图3
2001—2018年复种指数占比变化图"
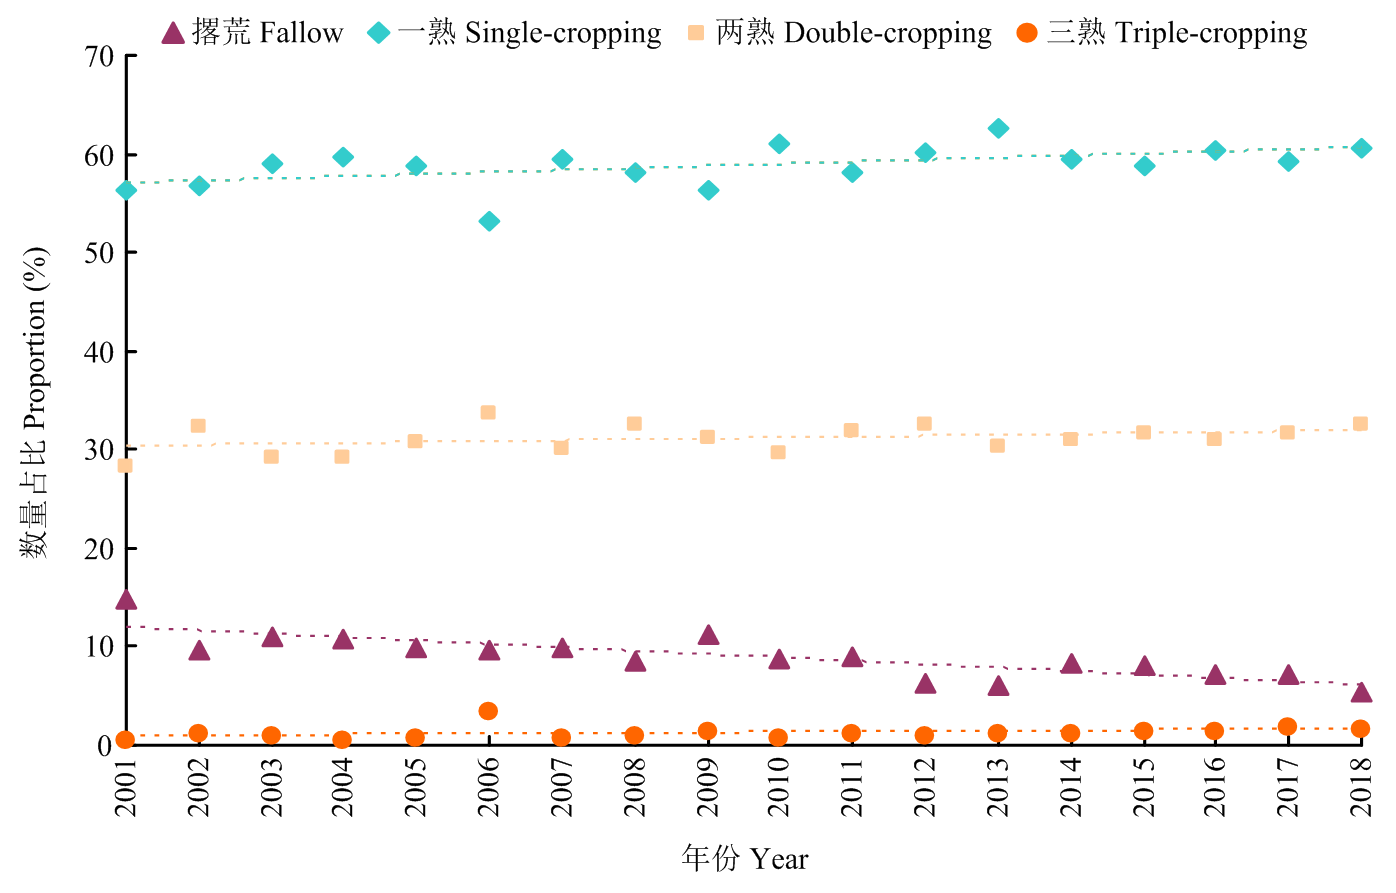
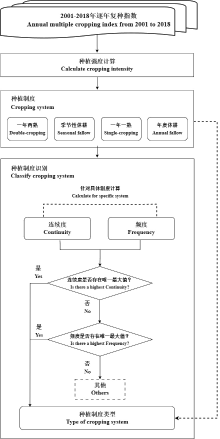
图4
种植制度跨年度分类体系"
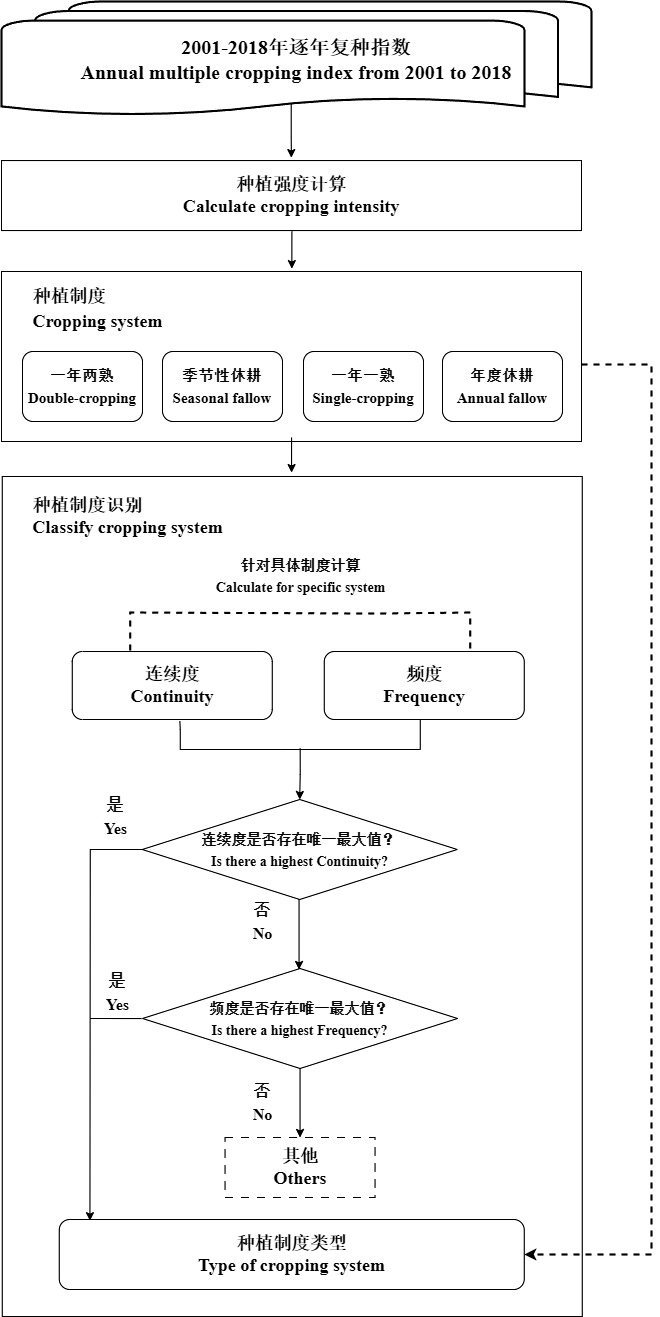
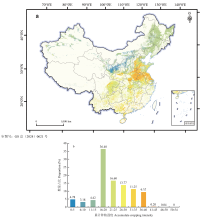
图5
种植强度空间与数量特征 a:累计种植强度空间分布图The spatial distribution of accumulate cropping intensity;b:累计种植强度数量直方图The statistical diagram of accumulate cropping intensity"

表1
年均种植强度各区间占比"
| 年均种植强度<BOLD>A</BOLD>verage cropping intensity | [0,1) | 1 | (1,2) | 2 | (2,3] |
|---|---|---|---|---|---|
| 占比Proportion (%) | 16.93 | 24.72 | 48.74 | 8.52 | 1.09 |

图6
种植制度连续度空间分布图 审图号:GS京(2024)0621号 a:一年两熟制度Double-cropping system;b:季节性休耕制度Seasonal fallow system;c:一年一熟制度Single-cropping system;d:年度休耕制度Annual fallow system。图7同The same as Fig. 7"
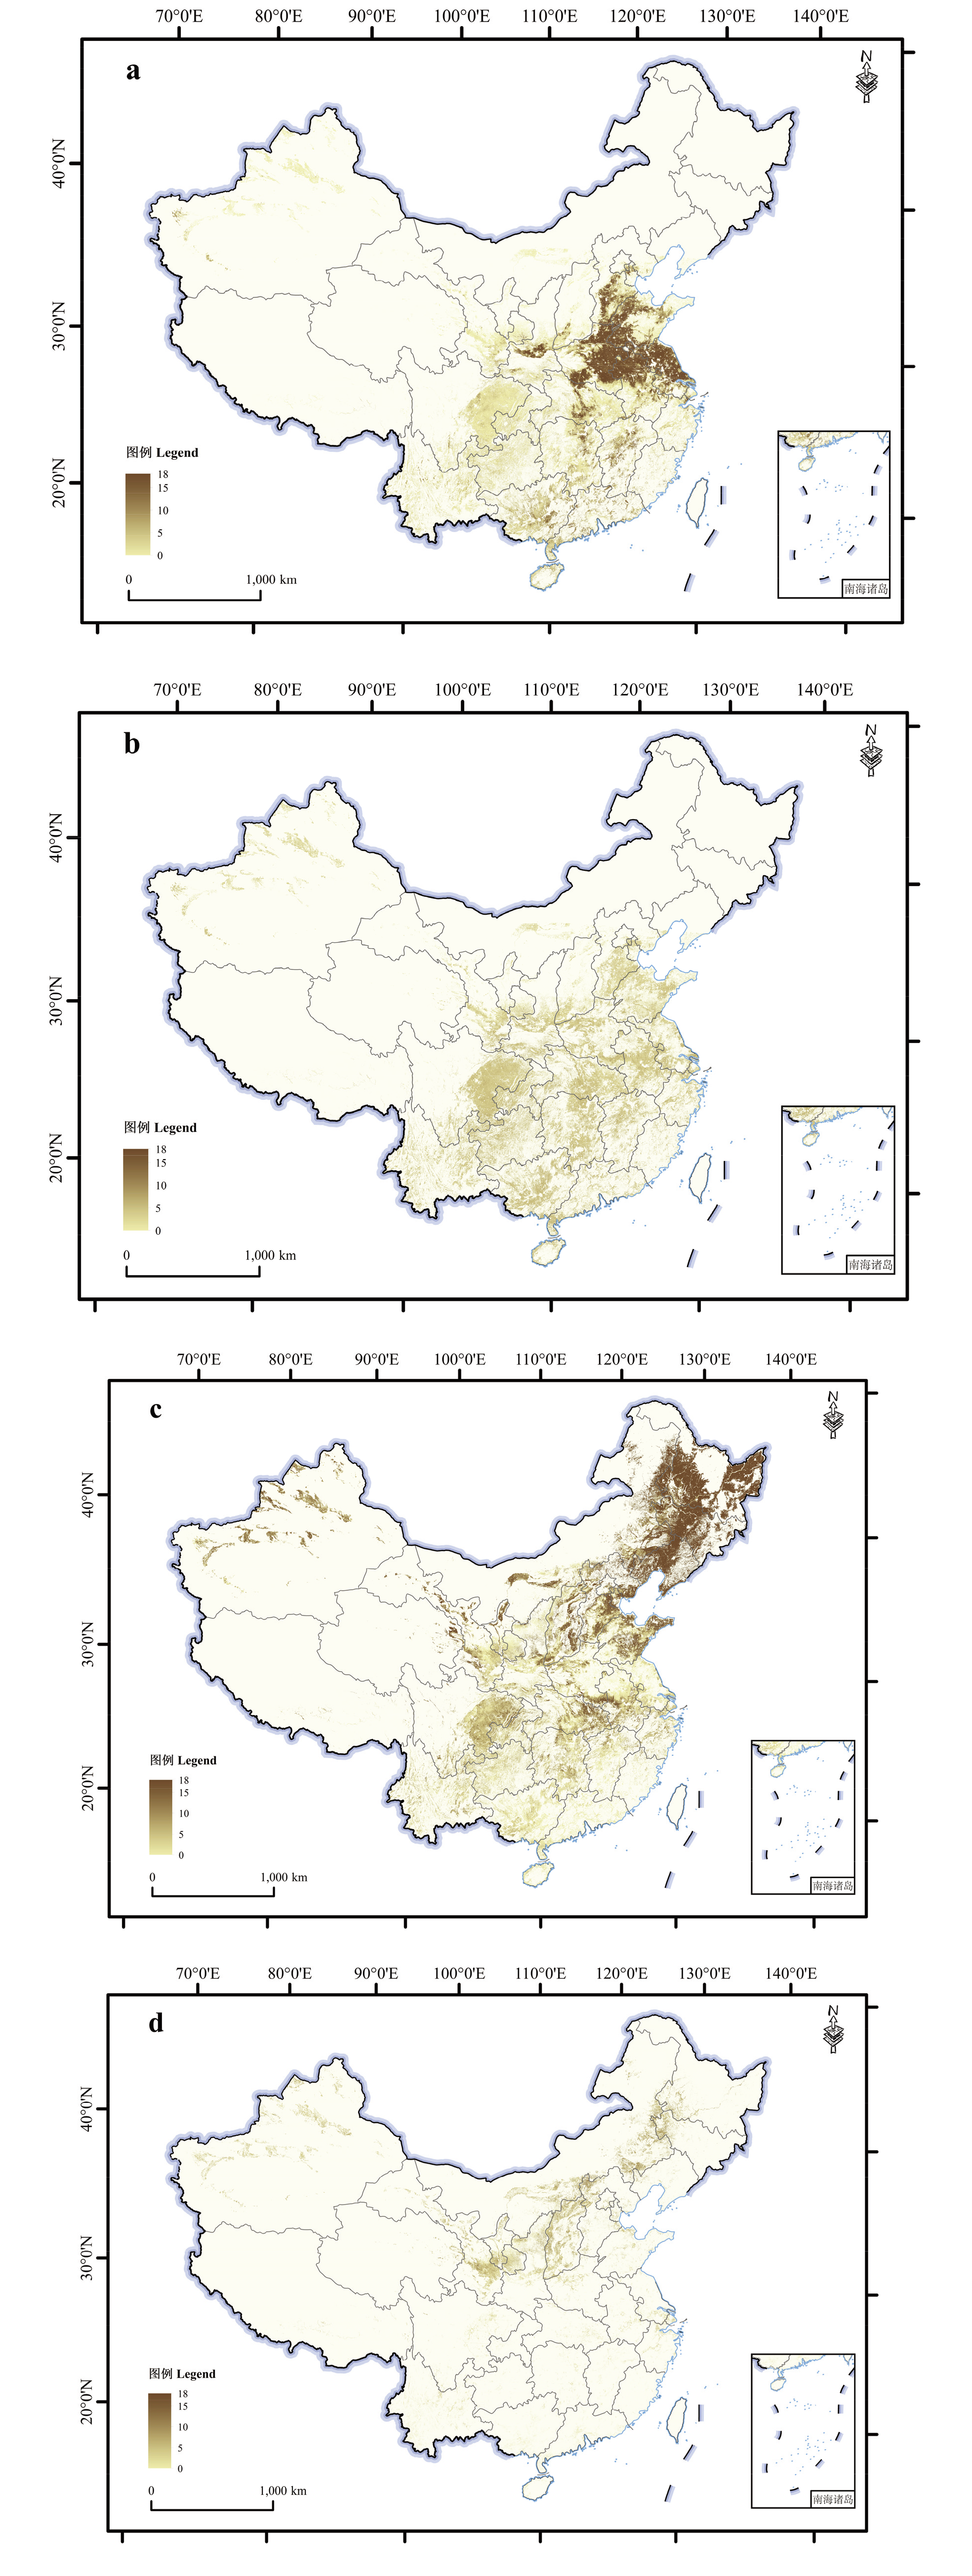
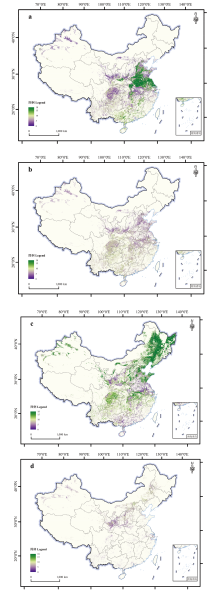
图7
种植制度频度空间分布图 审图号:GS京(2024)0621号"

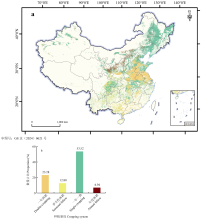
图8
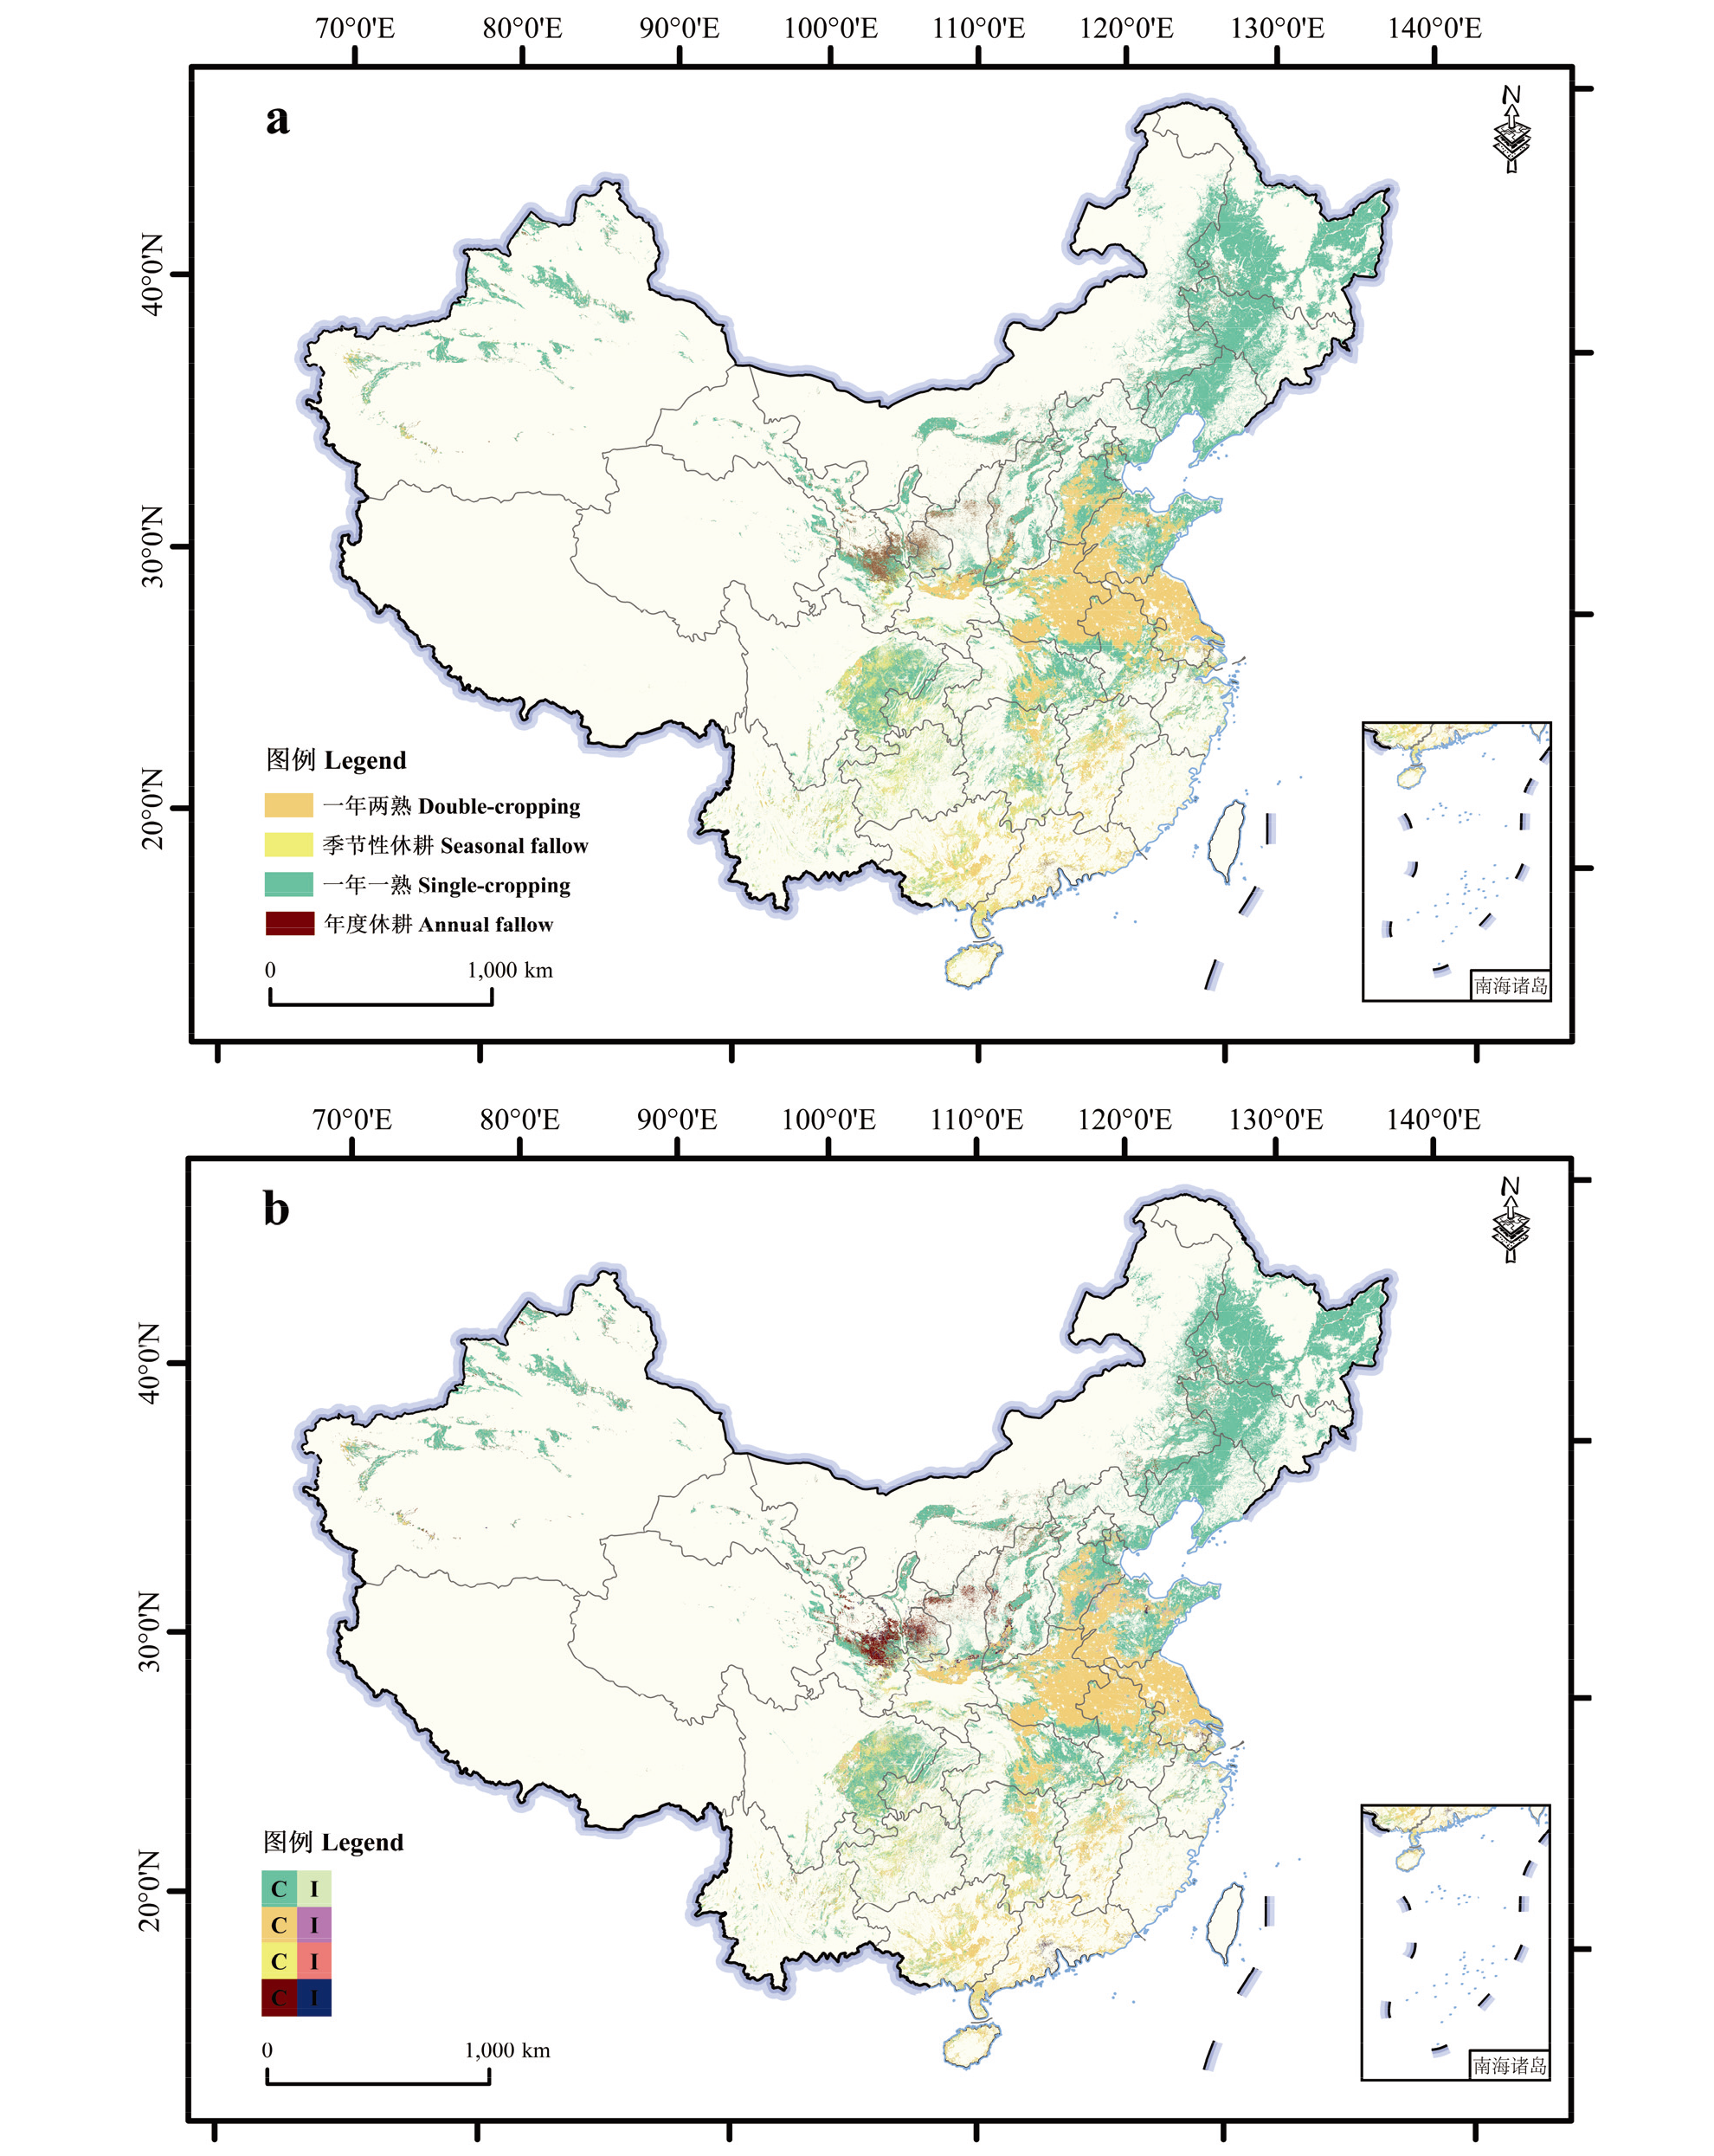
种植制度空间与数量特征 a:种植制度空间分布图The spatial distribution of cropping systems;b:种植制度数量直方图The statistical diagram of cropping systems"

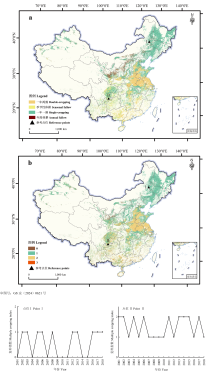
图9
种植制度与复种指数对比图 a:结合跨年度信息的种植制度空间分布图The spatial distribution of cropping systems associated with inter-annual information;b:2018年度复种指数图The multiple cropping index of China in 2018"

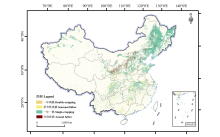
图10
2018年度一熟区种植制度类型分解图 审图号:GS京(2024)0621号"

表2
2001—2018年种植制度与2001—2021年种植制度一致性统计表"
| 参照 Reference | 比较 Comparison | 2001—2021年种植制度 Cropping systems from 2001 to 2021 | ||
|---|---|---|---|---|
| 2001—2018年种植制度 Cropping systems from 2001 to 2018 | 组内 Group (%) | 全局 Overall (%) | ||
| 一年一熟 Single-cropping | 56.64% | 一年一熟-一年一熟Single-cropping and Single-cropping | 97.79 | 55.39 |
| 一年一熟-一年两熟Single-cropping and Double-cropping | 0.55 | 0.31 | ||
| 一年一熟-季节性休耕Single-cropping and Seasonal fallow | 0.97 | 0.55 | ||
| 一年一熟-年度休耕Single-cropping and Annual fallow | 0.44 | 0.25 | ||
| 一年一熟-未识别Single-cropping and Unknown | 0.25 | 0.14 | ||
| 一年两熟 Double-cropping | 25.36% | 一年两熟-一年一熟Double-cropping and Single-cropping | 1.01 | 0.26 |
| 一年两熟-一年两熟Double-cropping and Double-cropping | 95.95 | 24.33 | ||
| 一年两熟-季节性休耕Double-cropping and Seasonal fallow | 1.27 | 0.32 | ||
| 一年两熟-年度休耕Double-cropping and Annual fallow | 1.25 | 0.32 | ||
| 一年两熟-未识别Double-cropping and Unknown | 0.53 | 0.13 | ||
| 季节性休耕 Seasonal fallow | 10.49% | 季节性休耕-一年一熟Seasonal fallow and Single-cropping | 6.68 | 0.70 |
| 季节性休耕-一年两熟Seasonal fallow and Double-cropping | 4.84 | 0.51 | ||
| 季节性休耕-季节性休耕Seasonal fallow and Seasonal fallow | 85.17 | 8.93 | ||
| 季节性休耕-年度休耕Seasonal fallow and Annual fallow | 1.07 | 0.11 | ||
| 季节性休耕-未识别Seasonal fallow and Unknown | 2.21 | 0.23 | ||
| 年度休耕 Annual fallow | 5.29% | 年度休耕-一年一熟Annual fallow and Single-cropping | 22.65 | 1.20 |
| 年度休耕-一年两熟Annual fallow and Double-cropping | 0.41 | 0.02 | ||
| 年度休耕-季节性休耕Annual fallow and Seasonal fallow | 0.68 | 0.04 | ||
| 年度休耕-年度休耕Annual fallow and Annual fallow | 72.59 | 3.84 | ||
| 年度休耕-未识别Annual fallow and Unknown | 3.69 | 0.20 | ||
| 总体一致性 Overall consistency | — | 92.50 | ||
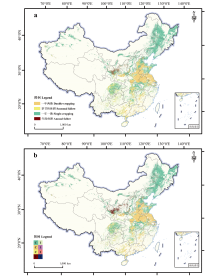
图11
不同研究期的种植制度一致性 审图号:GS京(2024)0621号 a:2001—2021年种植制度空间分布图The spatial distribution of cropping systems during 2001-2021;b:2001—2018年种植制度与2001—2021年种植制度一致性图The consistency of cropping systems between 2001-2018 and 2001-2021。C:一致性Consistency;I:不一致性Inconsistency"
| [1] |
doi: 10.1038/ncomms6989 pmid: 25609225 |
| [2] |
doi: 10.1016/j.gloenvcha.2012.11.001 |
| [3] |
doi: 10.1038/s41558-022-01492-5 |
| [4] |
doi: 10.1371/journal.pone.0217148 |
| [5] |
doi: 10.1038/nclimate2934 |
| [6] |
doi: 10.1038/s41598-023-29378-2 pmid: 36869041 |
| [7] |
doi: 10.1038/s43016-023-00753-6 |
| [8] |
U.S. Department of Agriculture. Action plan for climate adaptation and resilience. 2021, https://www.sustainability.gov/pdfs/usda-2021-cap.pdf.
|
| [9] |
刘巽浩, 陈阜, 吴尧. 多熟种植——中国农业的中流砥柱. 作物杂志, 2015(6): 1-9.
|
|
|
|
| [10] |
杨婷, 赵文利, 王哲怡, 陆星彤, 卢珊. 基于遥感影像NDVI数据的中国种植制度分布变化. 中国农业科学, 2015, 48(10): 1915-1925. doi: 10.3864/j.issn.0578-1752.2015.10.005.
|
|
|
|
| [11] |
吴文斌, 余强毅, 陆苗, 项铭涛, 谢安坤, 杨鹏, 唐华俊. 耕地复种指数研究的关键科学问题. 中国农业科学, 2018, 51(9): 1681-1694. doi: 10.3864/j.issn.0578-1752.2018.09.006.
|
|
|
|
| [12] |
doi: 10.1016/j.gloenvcha.2020.102131 |
| [13] |
唐华俊, 吴文斌, 余强毅, 夏天, 杨鹏, 李正国. 农业土地系统研究及其关键科学问题. 中国农业科学, 2015, 48(5): 900-910. doi: 10.3864/j.issn.0578-1752.2015.05.08.
|
|
|
|
| [14] |
doi: 10.1126/science.aaq0216 |
| [15] |
doi: 10.5814/j.issn.1674-764x.2020.06.005 |
| [16] |
doi: 10.1016/j.catena.2019.03.002 |
| [17] |
doi: 10.1038/s41598-020-66924-8 pmid: 32555234 |
| [18] |
doi: 10.1038/srep17774 pmid: 26626733 |
| [19] |
doi: 10.1016/j.agrformet.2019.01.009 |
| [20] |
doi: 10.1038/nclimate2266 |
| [21] |
doi: 10.1016/j.agrformet.2015.04.024 |
| [22] |
李宇, 邱炳文, 何玉花, 陈功, 叶智燕. 基于MODIS数据的2001—2018年中国耕地复种指数反演研究. 地理科学进展, 2020, 39(11): 1874-1883.
doi: 10.18306/dlkxjz.2020.11.008 |
|
doi: 10.18306/dlkxjz.2020.11.008 |
|
| [23] |
doi: 10.1088/1748-9326/aaf9c7 |
| [24] |
doi: 10.1016/j.ecolind.2019.01.081 |
| [25] |
doi: 10.1038/s41597-022-01589-8 pmid: 35931696 |
| [26] |
doi: 10.1016/j.compag.2016.04.015 |
| [27] |
doi: 10.1146/annurev-arplant-042817-040256 pmid: 29489395 |
| [28] |
doi: 10.1371/journal.pone.0194695 |
| [29] |
|
| [30] |
刘珍环, 杨鹏, 吴文斌, 李正国, 游良志. 近30年中国农作物种植结构时空变化分析. 地理学报, 2016, 71(5): 840-851.
doi: 10.11821/dlxb201605012 |
|
doi: 10.11821/dlxb201605012 |
|
| [31] |
蒋敏, 李秀彬, 辛良杰, 谈明洪. 南方水稻复种指数变化对国家粮食产能的影响及其政策启示. 地理学报, 2019, 74(1): 32-43.
doi: 10.11821/dlxb201901003 |
|
doi: 10.11821/dlxb201901003 |
|
| [32] |
冀正欣, 王秀丽, 李玲, 关小克, 蔚霖, 许月卿. 南阳盆地区耕地利用效率演变及其影响因素. 自然资源学报, 2021, 36(3): 688-701.
doi: 10.31497/zrzyxb.20210312 |
|
doi: 10.31497/zrzyxb.20210312 |
|
| [33] |
doi: 10.1007/s11442-017-1405-5 |
| [34] |
武兰芳, 陈阜, 欧阳竹. 种植制度演变与研究进展. 耕作与栽培, 2002(3): 1-5, 14.
|
|
|
|
| [35] |
|
| [36] |
doi: 10.1016/j.agsy.2022.103535 |
| [37] |
苏康传, 杨庆媛, 张忠训, 毕国华. 中国耕地差异化休耕模式及技术措施探讨. 农业工程学报, 2020, 36(9): 283-291.
|
|
|
|
| [38] |
黄国勤, 赵其国. 中国典型地区轮作休耕模式与发展策略. 土壤学报, 2018, 55(2): 283-292.
|
|
|
|
| [39] |
董金玮, 吴文斌, 黄健熙, 尤南山, 何盈利, 闫慧敏. 农业土地利用遥感信息提取的研究进展与展望. 地球信息科学学报, 2020, 22(4): 772-783.
doi: 10.12082/dqxxkx.2020.200192 |
|
|
|
| [40] |
石淑芹, 曹玉青, 吴文斌, 杨鹏, 蔡为民. 耕地集约化评价指标体系与评价方法研究进展. 中国农业科学, 2017, 50(7): 1210-1222. doi: 10.3864/j.issn.0578-1752.2017.07.004.
|
|
|
|
| [41] |
doi: 10.1038/s41598-020-58942-3 pmid: 32245995 |
| [42] |
doi: 10.1016/j.agsy.2019.102745 |
| [43] |
doi: 10.1109/JSTARS.2022.3218881 |
| [44] |
李忠华, 张龑, 李翠梅, 李风晶. 新疆两年三熟种植模式研究. 农村科技, 2018(12): 6-8.
|
|
|
|
| [45] |
doi: 10.1016/j.landusepol.2018.02.032 |
| [46] |
余强毅, 项铭涛, 谢安坤, 申格, 杨鹏, 吴文斌. 耕地复种差研究进展. 中国农业信息, 2018, 30(5): 1-12.
|
|
|
| [1] | 张俊峰, 丁建成, 翁煜炜, 张雄. 基于地貌分区的湖北省粮食生产格局与耕地资源匹配关系研究[J]. 中国农业科学, 2024, 57(9): 1748-1765. |
| [2] | 倪书辉, 史东梅, 盘礼东, 叶青, 伍俊豪. 紫色土坡耕地耕层持水抗旱性能及生产力对侵蚀程度的响应[J]. 中国农业科学, 2024, 57(7): 1350-1362. |
| [3] | 麻碧娇, 陈桂平, 苟志文, 殷文, 樊志龙, 胡发龙, 范虹, 何蔚. 河西灌区减氮条件下小麦复种绿肥的水分利用及经济效益[J]. 中国农业科学, 2024, 57(4): 740-754. |
| [4] | 田云, 王骁睿, 尹忞昊, 张蕙杰. 中国农业净碳汇再测算:现状特征、时空格局及其影响因素[J]. 中国农业科学, 2024, 57(22): 4507-4521. |
| [5] | 龚世飞, 肖能武, 丁武汉, 居学海, 吴平华, 余永松, 李虎. 基于耕地承载力的十堰市畜禽养殖环境风险评价[J]. 中国农业科学, 2023, 56(5): 920-934. |
| [6] | 于博威, 张晴雯, 郝卓, 石玉龙, 李雪亮, 李孟妮, 荆雪锴. 东北黑土区长缓坡耕地横坡垄作与地形对土壤可蚀性的交互作用[J]. 中国农业科学, 2023, 56(23): 4706-4716. |
| [7] | 侯梁宇, 张镇涛, 黄兆福, 李璐璐, 郭亚南, 明博, 谢瑞芝, 侯鹏, 薛军, 王克如, 李少昆. 通过种植制度改革实现黄淮海北部地区玉米机械籽粒直收[J]. 中国农业科学, 2023, 56(19): 3788-3798. |
| [8] | 田云, 尹忞昊, 张蕙杰. 我国农村能源碳排放时空格局、影响因素及空间溢出效应[J]. 中国农业科学, 2023, 56(13): 2547-2562. |
| [9] | 苟志文,殷文,柴强,樊志龙,胡发龙,赵财,于爱忠,范虹. 干旱灌区小麦间作玉米麦后复种绿肥的可持续性分析[J]. 中国农业科学, 2022, 55(7): 1319-1331. |
| [10] | 李玉浩,王红叶,崔振岭,营浩,曲潇琳,张骏达,王新宇. 我国主要粮食作物耕地基础地力的时空变化[J]. 中国农业科学, 2022, 55(20): 3960-3969. |
| [11] | 麻碧娇, 苟志文, 殷文, 于爱忠, 樊志龙, 胡发龙, 赵财, 柴强. 干旱灌区麦后复种绿肥与施氮水平对小麦光合性能与产量的影响[J]. 中国农业科学, 2022, 55(18): 3501-3515. |
| [12] | 张维理,张认连,张定祥,白占国,张晶,师华定. 世界主要国家土壤调查工作回顾[J]. 中国农业科学, 2022, 55(18): 3565-3583. |
| [13] | 宋鸽,史东梅,蒋光毅,江娜,叶青,张健乐. 土壤管理措施对坡耕地侵蚀退化耕层的恢复作用[J]. 中国农业科学, 2021, 54(8): 1702-1714. |
| [14] | 姚一文,戴全厚,甘艺贤,高儒学,严友进,王玉红. 雨强和地下孔(裂)隙度对喀斯特坡耕地养分流失的影响[J]. 中国农业科学, 2021, 54(1): 140-151. |
| [15] | 江娜,史东梅,蒋光毅,宋鸽,司承静,叶青. 土壤侵蚀对紫色土坡耕地耕层物理及力学特性的影响[J]. 中国农业科学, 2020, 53(9): 1845-1859. |
|
||