


中国农业科学 ›› 2022, Vol. 55 ›› Issue (20): 3960-3969.doi: 10.3864/j.issn.0578-1752.2022.20.008
李玉浩1( ),王红叶2(),崔振岭1,营浩1,曲潇琳2,张骏达2,王新宇2
收稿日期:2021-08-23
接受日期:2021-11-16
出版日期:2022-10-16
发布日期:2022-10-24
通讯作者:
王红叶
作者简介:李玉浩,E-mail: 基金资助:
LI YuHao1(),WANG HongYe2(),CUI ZhenLing1,YING Hao1,QU XiaoLin2,ZHANG JunDa2,WANG XinYu2
Received:2021-08-23
Accepted:2021-11-16
Online:2022-10-16
Published:2022-10-24
Contact:
HongYe WANG
摘要:
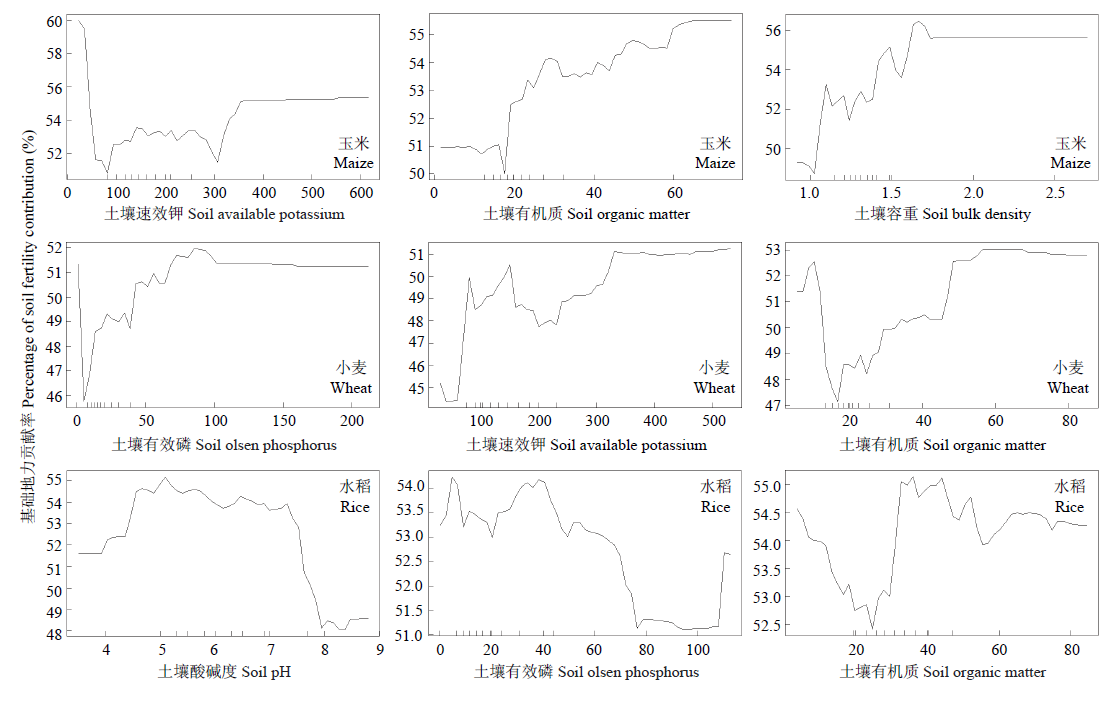
【目的】 耕地基础地力是实现粮食作物高产稳产的基石,明确我国主要粮食作物耕地基础地力时间变化趋势及空间变异特征,为保障我国粮食安全、提升耕地质量提供重要理论支撑。【方法】 基于1988—2019年国家耕地质量长期定位监测网络,选取每个监测点自建点开始前1—5年不施肥处理的空白区与农民常规施肥处理的常规区的长期监测数据,分析我国玉米、水稻和小麦三大粮食作物产量以及基础地力贡献率的时空变化情况及其影响因素。【结果】 30多年来我国粮食作物产量和耕地基础地力随时间变化整体呈现增加趋势,作物产量年增长速度呈无肥区<常规区,水稻<小麦<玉米的变化规律。玉米、小麦、水稻无肥区产量分别从1988年的2 370、1 712、3 111 kg·hm-2增至2019年的4 852、3 258、4 167 kg·hm-2,增幅分别为104.7%、90.2%、34.0%;玉米、小麦、水稻常规区产量分别从1988年的5 356、3 296、5 970 kg·hm-2增至2019年的8 859、6 515、7 825 kg·hm-2,增幅分别为65.4%、97.6%、31.0%。我国三大粮食作物2015—2019年基础地力贡献率为52.7%,相较1988—1994年的45.4%显著增加了7.3个百分点。其中:玉米基础地力贡献率为54.3%,比1988—1994年的42.1%显著增加12.2个百分点;水稻基础地力贡献率为53.3%,比1988—1994年的46.6%显著增加6.7个百分点;小麦基础地力贡献率随年份整体呈增长趋势,且相较玉米和水稻整体偏低。三大粮食作物基础地力贡献率空间分布差异较大:东北区、黄淮海区较高,分别为56.5%、54.1%,西南区、华南区次之,分别为53.7%和52.9%;甘新区和青藏区最低,分别仅为38.7%和40.4%。利用随机森林模型对三大粮食作物系统中影响基础地力贡献率空间分布的土壤因素进行重要性分析,其中:土壤速效钾、有机质含量和土壤容重是影响玉米基础地力贡献率空间分布的关键因素;土壤有效磷、速效钾和有机质含量是影响小麦基础地力贡献率空间分布的关键因素;土壤pH、有效磷和有机质含量是影响水稻基础地力贡献率空间分布的关键因素。【结论】 30多年来,我国三大粮食作物耕地基础地力不断提升,但地区间差异较大、整体水平仍然较低,远低于欧美发达国家水准;土壤速效钾含量、土壤有效磷含量和土壤pH分别是影响玉米、小麦和水稻基础地力贡献率空间分布的最关键的因素。
李玉浩,王红叶,崔振岭,营浩,曲潇琳,张骏达,王新宇. 我国主要粮食作物耕地基础地力的时空变化[J]. 中国农业科学, 2022, 55(20): 3960-3969.
LI YuHao,WANG HongYe,CUI ZhenLing,YING Hao,QU XiaoLin,ZHANG JunDa,WANG XinYu. Spatial-Temporal Variation of Cultivated Land Soil Basic Productivity for Main Food Crops in China[J]. Scientia Agricultura Sinica, 2022, 55(20): 3960-3969.
表1
九大综合农业区及缩写"
| 区域 Region | 缩写 Abbreviation |
|---|---|
| 东北区 Northeast China | NE |
| 内蒙古及长城沿线区 Inner Mongolia and the area along the Great Wall | IG |
| 黄淮海区 Yellow River and Huaihai | YH |
| 黄土高原区 Loess Plateau | LP |
| 长江中下游区 Middle and Lower Yangtze River | YR |
| 西南区 Southwest China | SW |
| 华南区 South China | SC |
| 甘新区 Gan Xin | GX |
| 青藏区 Qinghai Tibet | QT |
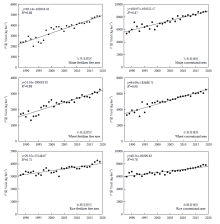
图1
三大粮食作物无肥区和常规区产量时间变化趋势"
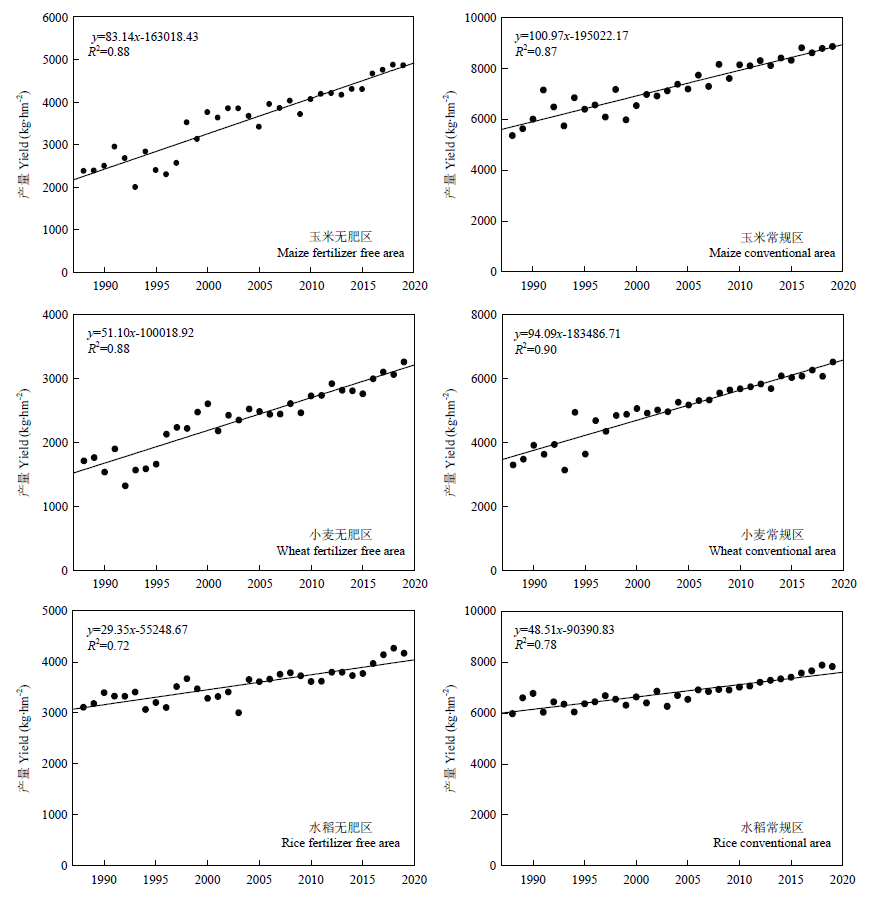
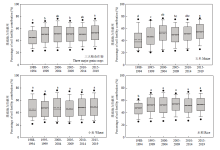
图2
三大粮食作物基础地力贡献率随时间变化趋势 箱式图矩形盒中实线代表中值,虚线代表平均值,下四分位数(矩形盒下边缘)和上四分位数(矩形盒上边缘)分别代表全部数据的25%和75%,下边缘线和上边缘线分别代表全部数据的5%和95%,上下实心点代表异常值,不同字母表示不同监测时期在5%水平差异显著"
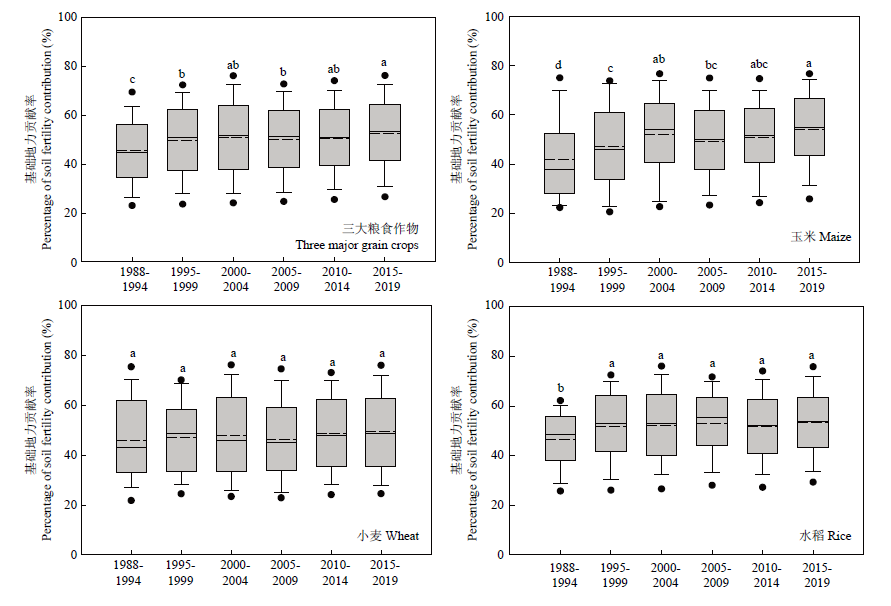
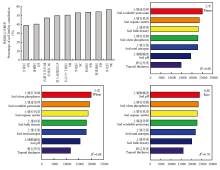
图3
三大粮食作物基础地力贡献率空间分布情况及其影响因素重要性排序"

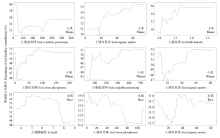
图4
三大粮食作物基础地力贡献率空间分布影响因素部分依赖图"
| [6] | 贡付飞. 长期施肥条件下潮土区冬小麦—夏玉米农田基础地力的演变规律分析[D]. 北京: 中国农业科学院, 2013. |
| GONG F F. The basic soil productivity change under long-term fertilizations in winter wheat and summer maize cropping system in fluvo-aquic soil area[D]. Beijing: Chinese Academy of Agricultural Sciences, 2013. (in Chinese) | |
| [7] |
MUELLER N D, GERBER J S, JOHNSTON M, RAY D K, RAMANKUTTY N, FOLEY J A. Closing yield gaps through nutrient and water management. Nature, 2012, 490(7419): 254-257. doi: 10.1038/nature11420.
doi: 10. 1038/nature11420 |
| [8] |
鲁艳红, 廖育林, 聂军, 周兴, 谢坚, 杨曾平. 连续施肥对不同肥力稻田土壤基础地力和土壤养分变化的影响. 中国农业科学, 2016, 49(21): 4169-4178. doi: 10.3864/j.issn.0578-1752.2016.21.011.
doi: 10.3864/j.issn.0578-1752.2016.21.011 |
|
LU Y H, LIAO Y L, NIE J, ZHOU X, XIE J, YANG Z P. Effect of successive fertilization on dynamics of basic soil productivity and soil nutrients in double cropping paddy soils with different fertilities. Scientia Agricultura Sinica, 2016, 49(21): 4169-4178. doi: 10.3864/j.issn.0578-1752.2016.21.011. (in Chinese)
doi: 10.3864/j.issn.0578-1752.2016.21.011 |
|
| [9] |
魏文良, 刘路, 仇恒浩. 有机无机肥配施对我国主要粮食作物产量和氮肥利用效率的影响. 植物营养与肥料学报, 2020, 26(8): 1384-1394. doi: 10.11674/zwyf.19511.
doi: 10.11674/zwyf.19511 |
|
WEI W L, LIU L, QIU H H. Effects of different organic resources application combined with chemical fertilizer on yield and nitrogen use efficiency of main grain crops in China. Journal of Plant Nutrition and Fertilizer, 2020, 26(8): 1384-1394. doi: 10.11674/zwyf.19511. (in Chinese)
doi: 10.11674/zwyf.19511 |
|
| [10] |
LI Y X, ZHANG W F, MA L, HUANG G Q, OENEMA O, ZHANG F S, DOU Z X. An analysis of China's fertilizer policies: impacts on the industry, food security, and the environment. Journal of Environmental Quality, 2013, 42(4): 972-981. doi: 10.2134/jeq2012.0465.
doi: 10.2134/jeq2012.0465 pmid: 24216349 |
| [11] |
JU X T, GU B J, WU Y Y, GALLOWAY J N. Reducing China's fertilizer use by increasing farm size. Global Environmental Change, 2016, 41: 26-32. doi: 10.1016/j.gloenvcha.2016.08.005.
doi: 10.1016/j.gloenvcha.2016.08.005 |
| [12] |
康日峰, 任意, 吴会军, 张淑香. 26年来东北黑土区土壤养分演变特征. 中国农业科学, 2016, 49(11): 2113-2125. doi: 10.3864/j.issn.0578-1752.2016.11.008.
doi: 10.3864/j.issn. 0578-1752.2016.11.008 |
|
KANG R F, REN Y, WU H J, ZHANG S X. Changes in the nutrients and fertility of black soil over 26 years in northeast China. Scientia Agricultura Sinica, 2016, 49(11): 2113-2125. doi: 10.3864/j.issn.0578-1752.2016.11.008. (in Chinese)
doi: 10.3864/j.issn. 0578-1752.2016.11.008 |
|
| [13] |
CUI Z L, CHEN X P, MIAO Y X, LI F, ZHANG F S, LI J L, YE Y L, YANG Z P, ZHANG Q, LIU C S. On-farm evaluation of winter wheat yield response to residual soil nitrate-N in North China plain. Agronomy Journal, 2008, 100(6): 1527-1534. doi: 10.2134/agronj2008.0005.
doi: 10.2134/agronj2008. 0005 |
| [1] |
茹振钢, 冯素伟, 李淦. 黄淮麦区小麦品种的高产潜力与实现途径. 中国农业科学, 2015, 48(17): 3388-3393. doi: 10.3864/j.issn.0578-1752.2015.17.006.
doi: 10.3864/j.issn.0578-1752.2015.17.006 |
|
RU Z G, FENG S W, LI G. High-yield potential and effective ways of wheat in yellow & Huai River valley facultative winter wheat region. Scientia Agricultura Sinica, 2015, 48(17): 3388-3393. doi: 10.3864/j.issn.0578-1752.2015.17.006. (in Chinese)
doi: 10.3864/j.issn.0578-1752.2015.17.006 |
|
| [14] |
BAI Z H, LI H G, YANG X Y, ZHOU B K, SHI X J, WANG B R, LI D C, SHEN J B, CHEN Q, QIN W, OENEMA O, ZHANG F S. The critical soil P levels for crop yield, soil fertility and environmental safety in different soil types. Plant and Soil, 2013, 372(1): 27-37. doi: 10.1007/s11104-013-1696-y.
doi: 10.1007/s11104-013-1696-y |
| [15] |
GUO J H, LIU X J, ZHANG Y, SHEN J L, HAN W X, ZHANG W F, CHRISTIE P, GOULDING K W T, VITOUSEK P M, ZHANG F S. Significant acidification in major Chinese croplands. Science, 2010, 327(5968): 1008-1010. doi: 10.1126/science.1182570.
doi: 10.1126/science.1182570 pmid: 20150447 |
| [16] |
陈冬林, 易镇邪, 周文新, 屠乃美. 不同土壤耕作方式下秸秆还田量对晚稻土壤养分与微生物的影响. 环境科学学报, 2010, 30(8): 1722-1728. doi: 10.13671/j.hjkxxb.2010.08.026.
doi: 10.13671/j.hjkxxb.2010.08.026 |
|
CHEN D L, YI Z X, ZHOU W X, TU N M. Effects of straw return on soil nutrients and microorganisms in late rice under different soil tillage systems. Acta Scientiae Circumstantiae, 2010, 30(8): 1722-1728. doi: 10.13671/j.hjkxxb.2010.08.026. (in Chinese)
doi: 10.13671/j.hjkxxb.2010.08.026 |
|
| [17] |
沈仁芳, 王超, 孙波. “藏粮于地、藏粮于技”战略实施中的土壤科学与技术问题. 中国科学院院刊, 2018, 33(2): 135-144. doi: 10.16418/j.issn.1000-3045.2018.02.002.
doi: 10. 16418/j.issn.1000-3045.2018.02.002 |
|
SHEN R F, WANG C, SUN B. Soil related scientific and technological problems in implementing strategy of “storing grain in land and technology”. Bulletin of Chinese Academy of Sciences, 2018, 33(2): 135-144. doi: 10.16418/j.issn.1000-3045.2018.02.002. (in Chinese)
doi: 10. 16418/j.issn.1000-3045.2018.02.002 |
|
| [18] | 曾勰婷, 王征, 赵明, 许发辉, 吴长春, 谢耀如. 贯彻新发展理念加快推进绿色农田建设: 基于对山西等六省试点项目建设的调研. 中国农业综合开发, 2021(2): 33-35. |
| ZENG X T, WANG Z, ZHAO M, XU F H, WU C C, XIE Y R. Implementing the new development concept and accelerating the construction of green farmland -- Based on the investigation of the construction of pilot projects in six provinces such as Shanxi. Agricultural Comprehensive Development in China, 2021(2): 33-35. (in Chinese) | |
| [19] |
许发辉, 杨宁, 赵明, 胡炎. 我国区域性耕地质量退化问题及改良培肥对策措施. 中国农技推广, 2020, 36(10): 3-7. doi: 10.3969/j.issn.1002-381X.2020.10.001.
doi: 10.3969/j. issn.1002-381X.2020.10.001 |
|
XU F H, YANG N, ZHAO M, HU Y. Quality degradation of regional cultivated land in China and Countermeasures for improvement and fertilization. China Agricultural Technology Extension, 2020, 36(10): 3-7. doi: 10.3969/j.issn.1002-381X.2020.10.001. (in Chinese)
doi: 10.3969/j. issn.1002-381X.2020.10.001 |
|
| [20] | 王树亮. 不同小麦品种对矿质元素吸收利用差异及农艺性状演变趋势[D]. 泰安: 山东农业大学, 2008. |
| WANG S L. The difference in absorption and utilization of mineral elements of different wheat varieties and evolution tendency of agronomic characters[D]. Taian: Shandong Agricultural University, 2008. (in Chinese) | |
| [21] |
汤勇华, 黄耀. 中国大陆主要粮食作物地力贡献率及其影响因素的统计分析. 农业环境科学学报, 2008, 27(4): 1283-1289. doi: 10.3321/j.issn:1672-2043.2008.04.003.
doi: 10.3321/j.issn: 1672-2043.2008.04.003 |
|
TANG Y H, HUANG Y. Statistical analysis of the percentage of soil fertility contribution to grain crop yield and driving factors in mainland China. Journal of Agro-Environment Science, 2008, 27(4): 1283-1289. doi: 10.3321/j.issn:1672-2043.2008.04.003. (in Chinese)
doi: 10.3321/j.issn: 1672-2043.2008.04.003 |
|
| [22] |
武红亮, 王士超, 闫志浩, 槐圣昌, 马常宝, 薛彦东, 徐明岗, 卢昌艾. 近30年我国典型水稻土肥力演变特征. 植物营养与肥料学报, 2018, 24(6): 1416-1424. doi: 10.11674/zwyf.18239.
doi: 10.11674/zwyf.18239 |
|
WU H L, WANG S C, YAN Z H, HUAI S C, MA C B, XUE Y D, XU M G, LU C G. Evolution characteristics of fertility of typical paddy soil in China in recent 30 years. Journal of Plant Nutrition and Fertilizer, 2018, 24(6): 1416-1424. doi: 10.11674/zwyf.18239. (in Chinese)
doi: 10.11674/zwyf.18239 |
|
| [23] | 李荣. 我国耕地质量现状及提升建议. 中国农业综合开发, 2020(7): 7-12. |
| LI R. Present situation and improvement suggestions of cultivated land quality in China. Agricultural Comprehensive Development in China, 2020(7): 7-12. (in Chinese) | |
| [24] | 白树彬. 辽宁省耕地地力评价及地力提升研究[D]. 沈阳: 沈阳农业大学, 2016. |
| BAI S B. Assessment and improvement of cultivated land fertility in Liaoning Province[D]. Shenyang: Shenyang Agricultural University, 2016. (in Chinese) | |
| [25] |
李宗善, 杨磊, 王国梁, 侯建, 信忠保, 刘国华, 傅伯杰. 黄土高原水土流失治理现状、问题及对策. 生态学报, 2019, 39(20): 7398-7409. doi: 10.5846/stxb201909021821.
doi: 10.5846/stxb201909021821 |
|
LI Z S, YANG L, WANG G L, HOU J, XIN Z B, LIU G H, FU B J. The management of soil and water conservation in the Loess Plateau of China: present situations, problems, and counter-solutions. Acta Ecologica Sinica, 2019, 39(20): 7398-7409. doi: 10.5846/stxb201909021821. (in Chinese)
doi: 10.5846/stxb201909021821 |
|
| [26] |
孙波, 潘贤章, 王德建, 韩晓增, 张玉铭, 郝明德, 陈欣. 我国不同区域农田养分平衡对土壤肥力时空演变的影响. 地球科学进展, 2008, 23(11): 1201-1208. doi: 10.3321/j.issn:1001-8166.2008.11.011.
doi: 10.11867/j.issn.1001-8166.2008.11.1201 |
|
SUN B, PAN X Z, WANG D J, HAN X Z, ZHANG Y M, HAO M D, CHEN X. Effect of nutrient balance on spatial and temporal change of soil fertility in different agriculture area in China. Advances in Earth Science, 2008, 23(11): 1201-1208. doi: 10.3321/j.issn:1001-8166.2008.11.011. (in Chinese)
doi: 10.11867/j.issn.1001-8166.2008.11.1201 |
|
| [27] |
隋跃宇, 焦晓光, 高崇生, 程伟, 张兴义, 刘晓冰. 土壤有机质含量与土壤微生物量及土壤酶活性关系的研究. 土壤通报, 2009, 40(5): 1036-1039. doi: 10.19336/j.cnki.trtb.2009.05.013.
doi: 10.19336/j.cnki.trtb.2009.05.013 |
|
SUI Y Y, JIAO X G, GAO C S, CHENG W, ZHANG X Y, LIU X B. The relationship among organic matter content and soil microbial biomass and soil enzyme activities. Chinese Journal of Soil Science, 2009, 40(5): 1036-1039. doi: 10.19336/j.cnki.trtb.2009.05.013. (in Chinese)
doi: 10.19336/j.cnki.trtb.2009.05.013 |
|
| [28] |
郑昊楠, 王秀君, 万忠梅, 卢同平, 石慧瑾, 李娟茹. 华北地区典型农田土壤有机质和养分的空间异质性. 中国土壤与肥料, 2019(1): 55-61. doi: 10.11838/sfsc.1673-6257.18139
doi: 10.11838/sfsc.1673-6257.18139 |
|
ZHENG H N, WANG X J, WAN Z M, LU T P, SHI H J, LI J R. Spatial heterogeneity of soil organic matter and nutrients in typical farmland in the North China Plain. Soils and Fertilizers Sciences in China, 2019(1): 55-61. doi: 10.11838/sfsc.1673-6257.18139. (in Chinese)
doi: 10.11838/sfsc.1673-6257.18139 |
|
| [29] |
FAN M S, LAL R, CAO J, QIAO L, SU Y S, JIANG R F, ZHANG F S. Plant-based assessment of inherent soil productivity and contributions to China's cereal crop yield increase since 1980. PLoS One, 2013, 8(9): e74617. doi: 10.1371/journal.pone.0074617.
doi: 10.1371/journal.pone.0074617 |
| [30] |
柳开楼, 黄晶, 叶会财, 韩苗, 韩天富, 宋惠洁, 胡志华, 胡丹丹, 李大明, 余喜初, 黄庆海, 李文军, 陈国钧. 长期施钾对双季玉米钾素吸收利用和土壤钾素平衡的影响. 植物营养与肥料学报, 2020, 26(12): 2235-2245. doi: 10.11674/zwyf.20383.
doi: 10.11674/zwyf.20383 |
|
LIU K L, HUANG J, YE H C, HAN M, HAN T F, SONG H J, HU Z H, HU D D, LI D M, YU X C, HUANG Q H, LI W J, CHEN G J. Effects of long-term potassium fertilization on potassium uptake, utilization and soil potassium balance in double maize cropping system. Journal of Plant Nutrition and Fertilizer, 2020, 26(12): 2235-2245. doi: 10.11674/zwyf.20383. (in Chinese)
doi: 10.11674/zwyf.20383 |
|
| [31] |
马清霞, 王朝辉, 惠晓丽, 张翔, 张悦悦, 侯赛宾, 黄宁, 罗来超, 张世君, 党海燕. 基于产量和养分含量的旱地小麦施磷量和土壤有效磷优化. 中国农业科学, 2019, 52(1): 73-85. doi: 10.3864/j.issn.0578-1752.2019.01.008.
doi: 10.3864/j.issn. 0578-1752.2019.01.008 |
|
MA Q X, WANG Z H, HUI X L, ZHANG X, ZHANG Y Y, HOU S B, HUANG N, LUO L C, ZHANG S J, DANG H Y. Optimization of phosphorus rate and soil available phosphorus based on grain yield and nutrient contents in dryland wheat production. Scientia Agricultura Sinica, 2019, 52(1): 73-85. doi: 10.3864/j.issn.0578-1752.2019.01.008. (in Chinese)
doi: 10.3864/j.issn. 0578-1752.2019.01.008 |
|
| [2] |
张世煌, 徐志刚. 耕作制度改革及其对农业技术发展的影响. 作物杂志, 2009(1): 1-3. doi: 10.3969/j.issn.1001-7283.2009.01.001.
doi: 10.3969/j.issn.1001-7283.2009.01.001 |
|
ZHANG S H, XU Z G. Farming system reform and its impact on the development of agricultural technology. Crops, 2009(1): 1-3. doi: 10.3969/j.issn.1001-7283.2009.01.001. (in Chinese)
doi: 10.3969/j.issn.1001-7283.2009.01.001 |
|
| [3] |
乔磊, 江荣风, 张福锁, 范明生. 土壤基础地力对水稻体系的增产与稳产作用研究. 中国科技论文, 2016, 11(9): 1031-1034, 1045. doi: 10.3969/j.issn.2095-2783.2016.09.012.
doi: 10.3969/j.issn.2095-2783.2016.09.012 |
|
QIAO L, JIANG R F, ZHANG F S, FAN M S. Improving inherent soil productivity enhances yield and resilience of rice farming systems. China Sciencepaper, 2016, 11(9): 1031-1034, 1045. doi: 10.3969/j.issn.2095-2783.2016.09.012. (in Chinese)
doi: 10.3969/j.issn.2095-2783.2016.09.012 |
|
| [4] |
李建军, 徐明岗, 辛景树, 段建军, 任意, 李冬初, 黄晶, 申华平, 张会民. 中国稻田土壤基础地力的时空演变特征. 中国农业科学, 2016, 49(8): 1510-1519. doi: 10.3864/j.issn.0578-1752.2016.08.008.
doi: 10.3864/j.issn.0578-1752.2016.08.008 |
|
LI J J, XU M G, XIN J S, DUAN J J, REN Y, LI D C, HUANG J, SHEN H P, ZHANG H M. Spatial and temporal characteristics of basic soil productivity in China. Scientia Agricultura Sinica, 2016, 49(8): 1510-1519. doi: 10.3864/j.issn.0578-1752.2016.08.008. (in Chinese)
doi: 10.3864/j.issn.0578-1752.2016.08.008 |
|
| [5] | 夏圣益. 土壤基础地力、施肥水平与农作物产量的关系. 上海农业科技, 1998(1): 6-8. |
| XIA S Y. Relationship between soil basic fertility, fertilization level and crop yield. Shanghai Agricultural Science and Technology, 1998(1): 6-8. (in Chinese) |
| [1] | 陈吉浩, 周界光, 曲翔汝, 王素容, 唐华苹, 蒋云, 唐力为, $\boxed{\hbox{兰秀锦}}$, 魏育明, 周景忠, 马建. 四倍体小麦胚大小性状QTL定位与分析[J]. 中国农业科学, 2023, 56(2): 203-216. |
| [2] | 肖德顺, 徐春梅, 王丹英, 章秀福, 陈松, 褚光, 刘元辉. 水培条件下根际氧环境对水稻幼苗磷吸收的影响及其生理机制[J]. 中国农业科学, 2023, 56(2): 236-248. |
| [3] | 张晓丽, 陶伟, 高国庆, 陈雷, 郭辉, 张华, 唐茂艳, 梁天锋. 直播栽培对双季早稻生育期、抗倒伏能力及产量效益的影响[J]. 中国农业科学, 2023, 56(2): 249-263. |
| [4] | 严艳鸽, 张水勤, 李燕婷, 赵秉强, 袁亮. 葡聚糖改性尿素对冬小麦产量和肥料氮去向的影响[J]. 中国农业科学, 2023, 56(2): 287-299. |
| [5] | 徐久凯, 袁亮, 温延臣, 张水勤, 李燕婷, 李海燕, 赵秉强. 畜禽有机肥氮在冬小麦季对化肥氮的相对替代当量[J]. 中国农业科学, 2023, 56(2): 300-313. |
| [6] | 柴海燕,贾娇,白雪,孟玲敏,张伟,金嵘,吴宏斌,苏前富. 吉林省玉米穗腐病致病镰孢菌的鉴定与部分菌株对杀菌剂的敏感性[J]. 中国农业科学, 2023, 56(1): 64-78. |
| [7] | 古丽旦,刘洋,李方向,成卫宁. 小麦吸浆虫小热激蛋白基因Hsp21.9的克隆及在滞育过程与温度胁迫下的表达特性[J]. 中国农业科学, 2023, 56(1): 79-89. |
| [8] | 赵政鑫,王晓云,田雅洁,王锐,彭青,蔡焕杰. 未来气候条件下秸秆还田和氮肥种类对夏玉米产量及土壤氨挥发的影响[J]. 中国农业科学, 2023, 56(1): 104-117. |
| [9] | 李周帅,董远,李婷,冯志前,段迎新,杨明羡,徐淑兔,张兴华,薛吉全. 基于杂交种群体的玉米产量及其配合力的全基因组关联分析[J]. 中国农业科学, 2022, 55(9): 1695-1709. |
| [10] | 熊伟仡,徐开未,刘明鹏,肖华,裴丽珍,彭丹丹,陈远学. 不同氮用量对四川春玉米光合特性、氮利用效率及产量的影响[J]. 中国农业科学, 2022, 55(9): 1735-1748. |
| [11] | 李易玲,彭西红,陈平,杜青,任俊波,杨雪丽,雷鹿,雍太文,杨文钰. 减量施氮对套作玉米大豆叶片持绿、光合特性和系统产量的影响[J]. 中国农业科学, 2022, 55(9): 1749-1762. |
| [12] | 王浩琳,马悦,李永华,李超,赵明琴,苑爱静,邱炜红,何刚,石美,王朝辉. 基于小麦产量与籽粒锰含量的磷肥优化管理[J]. 中国农业科学, 2022, 55(9): 1800-1810. |
| [13] | 桑世飞,曹梦雨,王亚男,王君怡,孙晓涵,张文玲,姬生栋. 水稻氮高效相关基因的研究进展[J]. 中国农业科学, 2022, 55(8): 1479-1491. |
| [14] | 唐华苹,陈黄鑫,李聪,苟璐璐,谭翠,牟杨,唐力为,兰秀锦,魏育明,马建. 基于55K SNP芯片的普通小麦穗长非条件和条件QTL分析[J]. 中国农业科学, 2022, 55(8): 1492-1502. |
| [15] | 韩晓彤,杨保军,李苏炫,廖福兵,刘淑华,唐健,姚青. 基于图像的水稻纹枯病智能测报方法[J]. 中国农业科学, 2022, 55(8): 1557-1567. |
|
||