


中国农业科学 ›› 2023, Vol. 56 ›› Issue (14): 2686-2700.doi: 10.3864/j.issn.0578-1752.2023.014.005
付真真( ), 祝光欣, 刘志娟(), 郭世博, 李娥, 杨晓光
收稿日期:2022-08-25
接受日期:2022-12-05
出版日期:2023-07-16
发布日期:2023-07-21
通信作者:
联系方式:
付真真,E-mail:fuzhenzhen@cau.edu.cn。
基金资助:
FU ZhenZhen(), ZHU GuangXin, LIU ZhiJuan(), GUO ShiBo, LI E, YANG XiaoGuang
Received:2022-08-25
Accepted:2022-12-05
Published:2023-07-16
Online:2023-07-21
摘要:
【目的】全球气候变暖背景下,极端高温频发将会对农作物生产造成潜在威胁,因此,基于多种高温指标综合评估作物生长季高温时空分布特征对制定有效的灾害风险管理和适应措施至关重要。【方法】以我国玉米潜在种植区为研究区域,基于第六次国际耦合模式比较计划(Coupled Model Intercomparison Project,CMIP6)中2个共享社会经济情景(Shared Socioeconomic Pathways,SSP1-2.6和SSP5-8.5)下1981—2060年的逐日最高气温资料和玉米生育期资料,分析了基准时段(1981—2014年)和未来(2015—2060年)玉米开花期高温强度(HSI)、高温持续时间(AHSD)和累积高温度日(HDD)的时空变化特征。【结果】1981—2014年玉米开花期HSI、AHSD、HDD在黄淮海夏玉米区和西北灌溉玉米区最大(区域均值分别为32.3和33.8 ℃、8.4和9.8 d、22.9和40.3 ℃·d)。受气候变暖影响,未来气候情景下,特别是在SSP5-8.5气候情景下,我国玉米开花期高温发生范围扩大、强度增加,HSI和AHSD增加最大的区域为北方春播玉米区,SSP1-2.6和SSP5-8.5情景下,HSI的增加趋势分别为0.97和1.16 ℃·(10a)-1,AHSD的增加趋势分别为0.73和1.11 d·(10a)-1。全区HDD增加最大的区域为黄淮海夏玉米区,SSP1-2.6和SSP5-8.5情景下增加趋势分别为2.68和5.26 ℃·d·(10a)-1。【结论】未来我国玉米开花期高温发生范围将扩大、强度将增加;且应重点关注黄淮海夏玉米区和北方春播玉米区的开花期高温,前者主要由于基础温度高,后者主要由于增温幅度较大。可通过选用抗高温品种、调整播种窗口、采用水肥及化学调控等综合措施降低高温威胁。
付真真, 祝光欣, 刘志娟, 郭世博, 李娥, 杨晓光. 气候变化背景下中国玉米产区开花期高温时空分布特征[J]. 中国农业科学, 2023, 56(14): 2686-2700.
FU ZhenZhen, ZHU GuangXin, LIU ZhiJuan, GUO ShiBo, LI E, YANG XiaoGuang. Spatial-Temporal Variations of High Temperature During Flowering Period in Maize-Producing Areas of China Under Climate Change[J]. Scientia Agricultura Sinica, 2023, 56(14): 2686-2700.
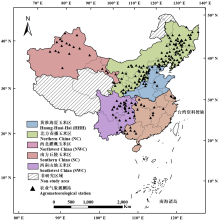
图1
研究区域及分区图 审图号:GS京(2023)1240号。下同"

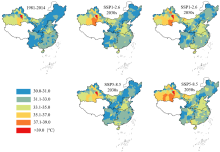
图2
1981—2060年我国玉米开花期高温强度平均值"

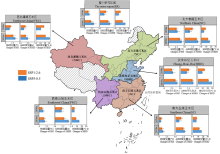
图3
2015—2060年我国玉米开花期高温强度(HSI)、高温持续时间(AHSD)和累积高温度日(HDD)较1981—2014年的变化量"

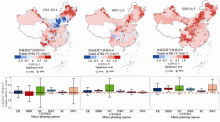
图4
1981—2060年我国玉米开花期高温强度的气候倾向率 ER整个研究区域;HHH黄淮海夏播玉米区;NC北方春播玉米区;NWC西北灌溉玉米区;SC南方丘陵玉米区;SWC西南山地玉米区。下同"

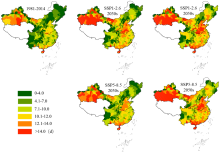
图5
1981—2060年我国玉米开花期高温持续时间平均值"

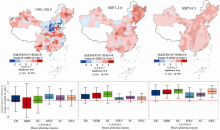
图6
1981—2060年我国玉米开花期高温持续时间的气候倾向率"


图7
1981—2060年我国玉米开花期累积高温度日平均值"
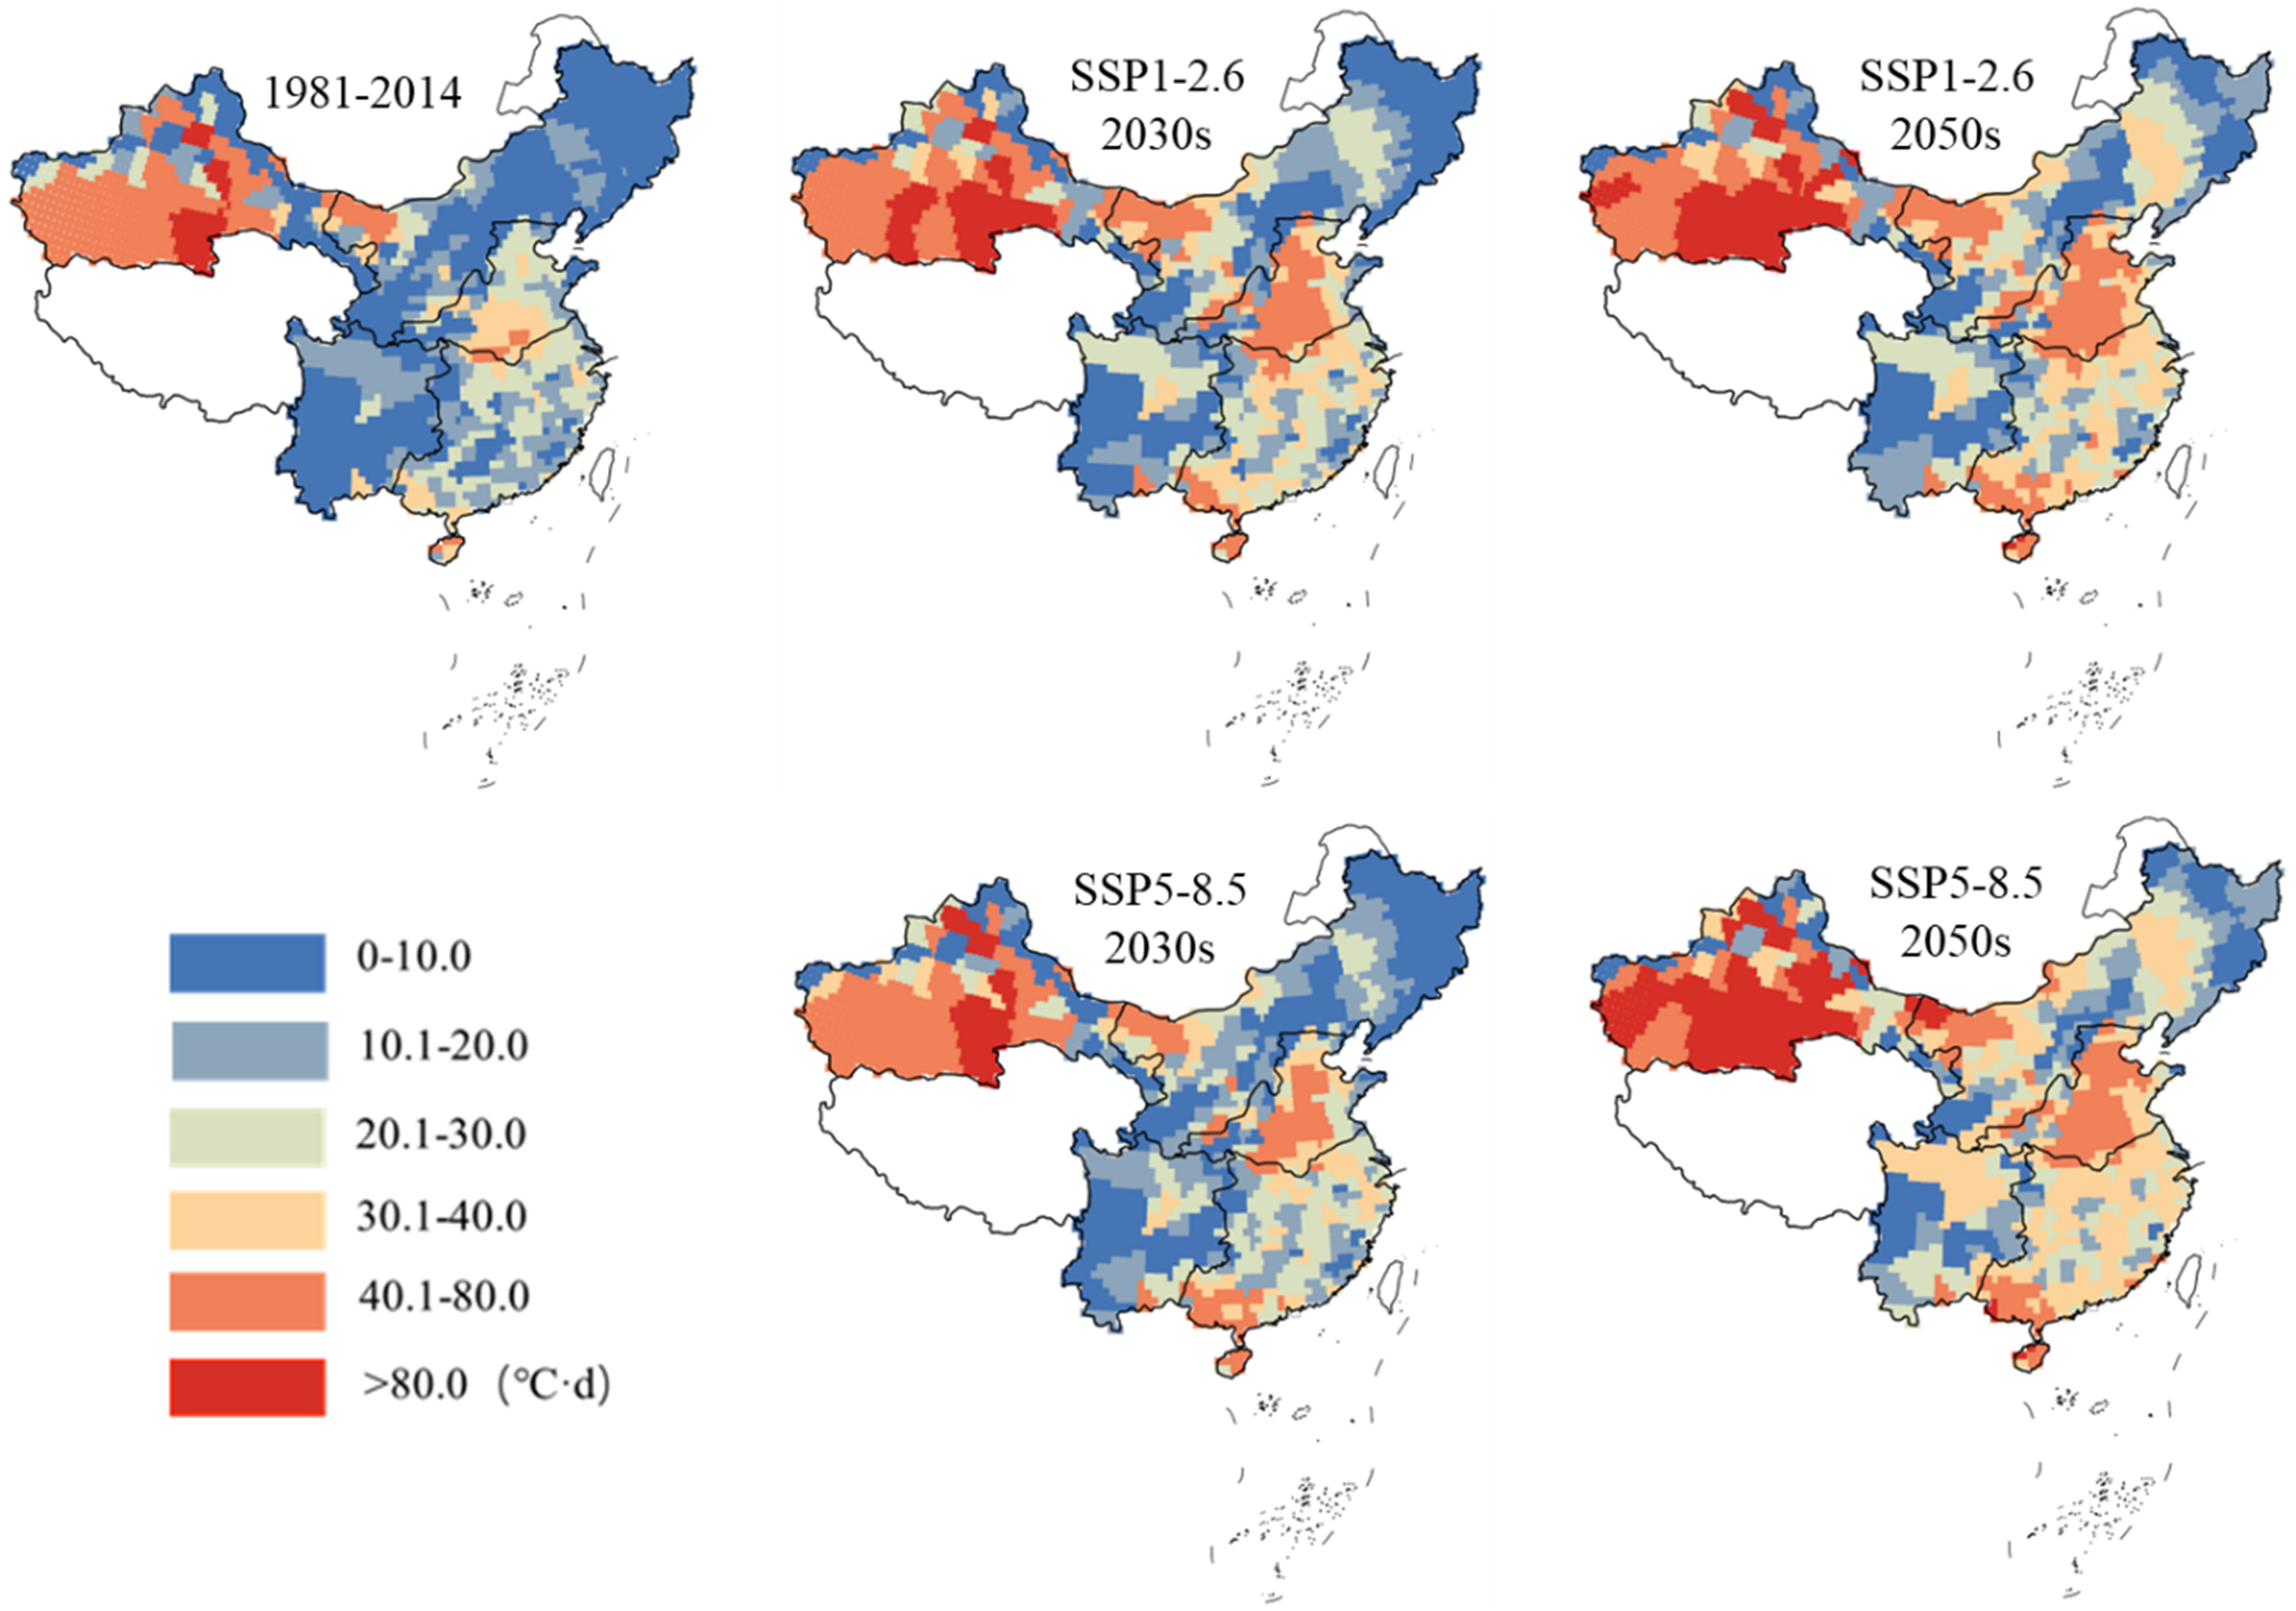
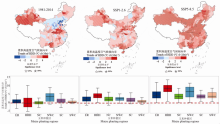
图8
1981—2060年我国玉米开花期累积高温度日的气候倾向率"

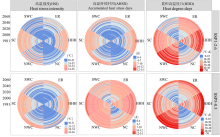
图9
1981—2060年我国玉米产区区域尺度开花期高温强度(HSI)、高温持续时间(AHSD)和累积高温度日(HDD)的时间变化趋势"

| [1] |
IPCC. Climate Change 2021:The Physical Science Basis. Cambridge: Cambridge University Press, 2021.
|
| [2] |
doi: 10.1016/j.agrformet.2006.03.014 |
| [3] |
doi: 10.1016/j.agrformet.2011.09.002 |
| [4] |
赵东升, 高璇, 吴绍洪, 郑度. 基于自然分区的1960—2018年中国气候变化特征. 地球科学进展, 2020, 35(7): 750-760.
|
|
|
|
| [5] |
中华人民共和国国家统计局. 中国统计年鉴(2019). 北京: 中国统计出版社, 2020.
|
|
National Bureau of Statistics of the People’s Republic of China. China Statistical Yearbook of the tertiary industry (2019). Beijing: China Statistics Press, 2020. (in Chinese)
|
|
| [6] |
doi: 10.1111/ppl.v169.1 |
| [7] |
张保仁, 董树亭, 胡昌浩, 王空军. 高温对玉米籽粒淀粉合成及产量的影响. 作物学报, 2007, 33(1): 38-42.
|
|
|
|
| [8] |
任寒, 刘鹏, 董树亭, 张吉旺, 赵斌. 高温胁迫影响玉米生长发育的生理机制研究进展. 玉米科学, 2019, 27(5): 109-115.
|
|
|
|
| [9] |
徐欣莹, 邵长秀, 孙志刚, 龙步菊, 董宛麟. 高温胁迫对玉米关键生育期生理特性和产量的影响研究进展. 玉米科学, 2021, 29(2): 81-88, 96.
|
|
|
|
| [10] |
张吉旺. 光温胁迫对玉米产量和品质及其生理特性的影响[D]. 泰安: 山东农业大学, 2005.
|
|
|
|
| [11] |
张保仁. 高温对玉米产量和品质的影响及调控研究[D]. 泰安: 山东农业大学, 2003.
|
|
|
|
| [12] |
doi: 10.1111/gcb.13376 pmid: 27251794 |
| [13] |
湖北省气象局武汉区域气候中心,华中农业大学植物科学技术学院, 武汉市气象局. GB/T 21985-2008:中国气象行业标准—主要农作物高温危害温度指标. 北京: 中国国家标准化管理委员会, 2008: 5.
|
|
Wuhan Regional Climate Center, Hubei Meteorological Service, College of Plant Science & Technology of Hua Zhong Agricultural University,Wuhan Meteorological Service. Temperature index of high temperature harm of main crops: GB/T 21985-2008. Beijing: Standardization Administration, 2008: 5. (in Chinese)
|
|
| [14] |
王秀萍, 方文松, 杜子璇, 刘天学. 夏玉米花期高温热害时空分布特征. 玉米科学, 2021, 29(1): 61-68.
|
|
|
|
| [15] |
尹小刚, 王猛, 孔箐锌, 王占彪, 张海林, 褚庆全, 文新亚, 陈阜. 东北地区高温对玉米生产的影响及对策. 应用生态学报, 2015, 26(1): 186-198.
|
|
|
|
| [16] |
陈怀亮, 李树岩. 气候变暖背景下河南省夏玉米花期高温灾害风险预估. 中国生态农业学报(中英文), 2020, 28(3): 337-348.
|
|
|
|
| [17] |
商蒙非, 石晓宇, 赵炯超, 李硕, 褚庆全. 气候变化背景下中国不同区域玉米生育期高温胁迫时空变化特征. 作物学报, 2023, 49(1): 167-176.
doi: 10.3724/SP.J.1006.2023.23007 |
|
|
|
| [18] |
韩湘玲. 作物生态学. 北京: 气象出版社, 1991.
|
|
|
|
| [19] |
杨镇, 才卓, 景希强. 东北玉米. 北京: 中国农业出版社, 2007.
|
|
|
|
| [20] |
佟异亚. 中国玉米种植区划. 北京: 中国农业科技出版社, 1992.
|
|
|
|
| [21] |
郭春华, 朱秀芳, 张世喆, 唐明秀, 徐昆. 基于CMIP6的中国未来高温危险性变化评估. 地球信息科学学报, 2022, 24(7): 1391-1405.
doi: 10.12082/dqxxkx.2022.210491 |
|
|
|
| [22] |
董思言, 徐影, 周波涛, 侯美亭, 李柔珂, 於琍, 张永香. 基于CMIP5模式的中国地区未来高温灾害风险预估. 气候变化研究进展, 2014, 10(5): 365-369.
|
|
|
|
| [23] |
全国农业区划委员会. 中国农业自然资源和农业区划. 北京: 中国农业出版社, 1991.
|
|
National Agricultural Division Committee. Agricultural Natural Resources and Agricultural Regionalization in China. Beijing: China Agricultural Press, 1991. (in Chinese)
|
|
| [24] |
翁宇威, 蔡闻佳, 王灿. 共享社会经济路径(SSPs)的应用与展望. 气候变化研究进展, 2020, 16(2): 215-222.
|
|
|
|
| [25] |
王璞. 农作物概论. 北京: 中国农业大学出版社, 2004.
|
|
|
|
| [26] |
徐美玲. 温度对玉米花丝生活力的影响. 浙江农业科学, 2002, 43(3): 120-122.
|
|
|
|
| [27] |
闫振华, 刘东尧, 贾绪存, 杨琴, 陈艺博, 董朋飞, 王群. 花期高温干旱对玉米雄穗发育、生理特性和产量影响. 中国农业科学, 2021, 54(17): 3592-3608.
doi: 10.3864/j.issn.0578-1752.2021.17.004 |
|
doi: 10.3864/j.issn.0578-1752.2021.17.004 |
|
| [28] |
和骅芸, 胡琦, 潘学标, 马雪晴, 胡莉婷, 王晓晨, 何奇瑾. 气候变化背景下华北平原夏玉米花期高温热害特征及适宜播期分析. 中国农业气象, 2020, 41(1): 1-15.
|
|
|
|
| [29] |
赵福成, 景立权, 闫发宝, 陆大雷, 王桂跃, 陆卫平. 灌浆期高温胁迫对甜玉米籽粒糖分积累和蔗糖代谢相关酶活性的影响. 作物学报, 2013, 39(9): 1644-1651.
|
|
doi: 10.3724/SP.J.1006.2013.01644 |
|
| [30] |
张萍, 陈冠英, 耿鹏, 高雅, 郑雷, 张沙沙, 王璞. 籽粒灌浆期高温对不同耐热型玉米品种强弱势粒发育的影响. 中国农业科学, 2017, 50(11): 2061-2070.
doi: 10.3864/j.issn.0578-1752.2017.11.012 |
|
doi: 10.3864/j.issn.0578-1752.2017.11.012 |
|
| [31] |
doi: 10.1111/gcb.12442 pmid: 24259291 |
| [32] |
任国玉, 郭军, 徐铭志, 初子莹, 张莉, 邹旭凯, 李庆祥, 刘小宁. 近50年中国地面气候变化基本特征. 气象学报, 2005, 63(6): 942-956.
|
|
|
|
| [33] |
doi: 10.1038/nclimate1832 |
| [34] |
doi: 10.1038/s41467-020-18725-w pmid: 33020479 |
| [35] |
doi: 10.1016/j.atmosres.2021.105772 |
| [36] |
doi: 10.1016/j.agrformet.2021.108378 |
| [37] |
李明顺, 谢传晓, 张世煌. 提高玉米育种效率的技术途径与策略. 作物杂志, 2007(1): 4-7.
|
|
|
|
| [38] |
doi: 10.1016/j.fcr.2015.02.024 |
| [39] |
doi: 10.1016/j.indcrop.2006.12.003 |
| [40] |
严旖旎. 吐丝期喷施外源激素对花后高温下糯玉米产量和品质的影响[D]. 扬州: 扬州大学, 2021.
|
|
|
|
| [41] |
李明德, 郑圣先. 钾素营养对玉米生长及抗旱性的影响. 土壤肥料, 1996(4): 10-12.
|
|
|
|
| [42] |
李芳贤, 王金林, 李玉兰, 刁希强. 锌对夏玉米生长发育及产量影响的研究. 玉米科学, 1999, 7(1): 72-76.
|
|
|
|
| [43] |
钟哲, 贾志峰, 王智, 卢玉东, 任涛, 陈瑾, 王小平. 干旱半干旱地区双垄地布覆盖对土壤水分的影响. 干旱地区农业研究, 2020, 38(2): 21-29.
|
|
|
|
| [44] |
王慧杰, 冯瑞云, 张志军, 孟晋建, 南建福. 不同土壤水分抑蒸剂保水效果研究. 华北农学报, 2009, 24(6): 60-64.
doi: 10.7668/hbnxb.2009.06.012 |
|
|
|
| [45] |
高丽红, 李式军. 适宜根际温度缓解生菜地上部高温伤害的机理. 南京农业大学学报, 1996, 19(2): 34-39.
|
|
|
|
| [46] |
郭天财, 王晨阳, 朱云集, 王化岑, 李九星, 周继泽. 后期高温对冬小麦根系及地上部衰老的影响. 作物学报, 1998, 24(6): 957-962.
|
|
|
|
| [47] |
崔丽娜, 董树亭. 不同氮肥处理下高温胁迫对夏玉米产量及叶片超微构造的影响. 玉米科学, 2020, 28(1): 92-97.
|
|
|
|
| [48] |
韦丹, 曾晓豪, 罗宁, 王丽君, 孟庆锋, 王璞. 京津冀地区极端高温发生对夏玉米产量的影响. 中国农业大学学报, 2021, 26(1): 1-17.
|
|
|
| [1] | 路梦莉, 张雅婷, 任红, 王土金, 韩一鸣, 李文阳, 李从锋. 增密对春玉米籽粒胚乳淀粉粒度分布与黏度参数的影响[J]. 中国农业科学, 2023, 56(9): 1646-1657. |
| [2] | 马红霞, 孙华, 郭宁, 刘树森, 张海剑, 石洁. 基于PCR和巢式PCR技术的玉米南方锈病早期检测[J]. 中国农业科学, 2023, 56(9): 1686-1695. |
| [3] | 尉亚囡, 薄其飞, 唐安, 高嘉瑞, 马田, 尉熊熊, 张方方, 周祥利, 岳善超, 李世清. 长期覆膜和施用有机肥对黄土高原春玉米产量和品质的效应[J]. 中国农业科学, 2023, 56(9): 1708-1717. |
| [4] | 温媛媛, 李妍, 李建国, 王美美, 于长辉, 沈宜钊, 高艳霞, 李秋凤, 曹玉凤. 马铃薯条加工副产品与稻草混贮对奶公牛育肥性能和血液生化指标的影响[J]. 中国农业科学, 2023, 56(9): 1800-1812. |
| [5] | 李俊, 单露英, 肖芳, 李允静, 高鸿飞, 翟杉杉, 吴刚, 张秀杰, 武玉花. 转基因玉米MON87427梯度含量基体标准物质的研制[J]. 中国农业科学, 2023, 56(8): 1444-1455. |
| [6] | 刘梦洁, 梁飞, 李全胜, 田宇欣, 王国栋, 贾宏涛. 膜下滴灌与细流沟灌对玉米生长及产量的影响[J]. 中国农业科学, 2023, 56(8): 1515-1530. |
| [7] | 范鑫, 李宇鑫, 邝吉卫, 杨婷, 刘苗苗, 曹云刚, 黄峻榕. 超声辅助玉米醇溶蛋白基乙烯吸附膜的制备及其香蕉保鲜性能[J]. 中国农业科学, 2023, 56(8): 1574-1584. |
| [8] | 马胜兰, 况福虹, 林洪羽, 崔俊芳, 唐家良, 朱波, 蒲全波. 秸秆还田量对川中丘陵冬小麦-夏玉米轮作体系土壤物理特性的影响[J]. 中国农业科学, 2023, 56(7): 1344-1358. |
| [9] | 李懿璞, 童丽秀, 蔺雅楠, 苏治军, 包海柱, 王富贵, 刘剑, 屈佳伟, 胡树平, 孙继颖, 王志刚, 于晓芳, 徐明良, 高聚林. 玉米ZmCCT10耐低氮功能研究[J]. 中国农业科学, 2023, 56(6): 1035-1044. |
| [10] | 渠清, 刘宁, 邹金鹏, 张雅璇, 贾慧, 孙蔓莉, 曹志艳, 董金皋. 拟轮枝镰孢与玉米籽粒互作的差异基因筛选及代谢通路分析[J]. 中国农业科学, 2023, 56(6): 1086-1101. |
| [11] | 崔红杰, 卢春亭, 潘丽琴, 胡会, 钟佩云, 朱洁莹, 张凯照, 黄小红. 姜黄素通过SIRT1/FOXO1通路缓解玉米赤霉烯酮诱导的猪肾上皮细胞氧化损伤[J]. 中国农业科学, 2023, 56(5): 1007-1018. |
| [12] | 周文期, 张贺通, 何海军, 龚佃明, 杨彦忠, 刘忠祥, 李永生, 王晓娟, 连晓荣, 周玉乾, 邱法展. 调控玉米株高和穗位高候选基因Zmdle1的定位[J]. 中国农业科学, 2023, 56(5): 821-837. |
| [13] | 马南, 安婷婷, 张久明, 汪景宽. 添加玉米秸秆和根茬对不同肥力黑土微生物残体碳氮的影响[J]. 中国农业科学, 2023, 56(4): 686-696. |
| [14] | 刘丹, 安雨丽, 陶笑笑, 王孝忠, 吕典秋, 郭彦军, 陈新平, 张务帅. 西北地区制种玉米产量及氮素吸收对供氮水平的响应[J]. 中国农业科学, 2023, 56(3): 441-452. |
| [15] | 申哲, 韩天富, 曲潇林, 马常宝, 王慧颖, 柳开楼, 黄晶, 都江雪, 张璐, 刘立生, 李继文, 张会民. 我国小麦和玉米相对产量差时空变异及其对氮肥的响应[J]. 中国农业科学, 2023, 56(14): 2724-2737. |
|
||