


中国农业科学 ›› 2021, Vol. 54 ›› Issue (20): 4299-4311.doi: 10.3864/j.issn.0578-1752.2021.20.005
周萌( ),韩晓旭,郑恒彪,程涛,田永超,朱艳,曹卫星,姚霞()
收稿日期:2020-11-25
接受日期:2021-02-28
出版日期:2021-10-16
发布日期:2021-10-25
通讯作者:
姚霞
作者简介:周萌,E-mail: 基金资助:
ZHOU Meng(),HAN XiaoXu,ZHENG HengBiao,CHENG Tao,TIAN YongChao,ZHU Yan,CAO WeiXing,YAO Xia()
Received:2020-11-25
Accepted:2021-02-28
Online:2021-10-16
Published:2021-10-25
Contact:
Xia YAO
摘要:
【目的】利用高光谱遥感数据快速、无损地估算棉花生物量,评估参数化与非参数化方法在棉花上的表现差异。【方法】本研究以4个棉花品种在2个年份(2004和2005年)的试验资料为基础,将2年数据分别进行建模和验证,采用参数化算法(植被指数法、连续小波变换)与非参数化算法(偏最小二乘回归、随机森林、人工神经网络、回归树、袋装树和增强树、支持向量机和高斯过程回归)分别构建吐絮前和吐絮后的生物量估算模型。【结果】近红外与红边波段仍然是棉花生物量遥感监测中最有效的波段区间。参数化方法运算简单,效率高,其中,CIred edge证明是棉花生物量估算上表现最好的植被指数,具有较高的独立验证结果(吐絮前:RMSE=27.23 g·m-2;吐絮后:RMSE=48.81 g·m-2)。基于连续小波变换的方法缓解了植被指数的低估现象,尤其是吐絮后(吐絮前:RMSE=31.54 g·m-2;吐絮后:RMSE=37.57 g·m-2);在非参数化法中,随机森林是棉花生物量估算的最优算法(吐絮前:RMSE=20.48 g·m-2;吐絮后:RMSE=30.28 g·m-2)。吐絮后的估算精度都显著低于吐絮前,表明两类算法的估算精度都受到棉絮的影响。【结论】本研究评估了基于参数化和非参数化算法构建的棉花生物量估算模型,证明了非参数化方法可以作为棉花生物量无损监测的重要研究方法,该结论也为棉花其他生长参数的估测提供了技术支撑。
周萌,韩晓旭,郑恒彪,程涛,田永超,朱艳,曹卫星,姚霞. 基于参数化和非参数化法的棉花生物量高光谱遥感估算[J]. 中国农业科学, 2021, 54(20): 4299-4311.
ZHOU Meng,HAN XiaoXu,ZHENG HengBiao,CHENG Tao,TIAN YongChao,ZHU Yan,CAO WeiXing,YAO Xia. Remote Sensing Estimation of Cotton Biomass Based on Parametric and Nonparametric Methods by Using Hyperspectral Reflectance[J]. Scientia Agricultura Sinica, 2021, 54(20): 4299-4311.
表1
2个试验季棉花生物量实测数据总结"
| 试验 Experiment | 样点数 Number of samples | 生物量Biomass (g·m-2) | ||
|---|---|---|---|---|
| 最低值Min | 平均值Mean | 最大值Max | ||
| 试验1 Experiment 1 | 100 | 14.4 | 50.9 | 140.9 |
| 试验2 Experiment 2 | 80 | 20.0 | 95.5 | 155.2 |
表2
高光谱植被指数计算方法"
| 植被指数 Vegetation index | 名称 Name | 公式 Formula | 文献 Reference |
|---|---|---|---|
| DI | 差值指数 Difference index | R800 -R550 | [26] |
| DVI | 差值植被指数 Difference vegetation index | R800 -R680 | [27] |
| RVI | 比值植被指数 Ratio vegetation index | R787/R765 | [5] |
| SRPI | 简单比值色素指数 Simple ratio pigment index | R430 /R680 | [28] |
| NPCI | 叶绿素归一化植被指数 Chlorophyll normalized vegetation index | (R680-R430)/(R680+R430) | [29] |
| MTCI | 中分辨率陆地叶绿素成像指数 MERIS terrestrial chlorophyll index | (R750-R710)/(R710-R680) | [30] |
| DATT | DATT | (R800-R720)/( R800 -R680) | [31] |
| CIred edge | 红边叶绿素指数 Red edge chlorophyll index | (R800 /R720)- 1 | [32] |
| NDVI | 归一化植被指数 Normalized vegetation index | (R780-R670)/(R780-R670) | [33] |
| GNDVI | 绿色归一化植被指数 Green normalized vegetation index | (R801-R550)/(R800+R550) | [34] |
| EVI | 增强型植被指数 Enhanced vegetation index | 2.5×(RNIR /RRED )/(RNIR+6.0×RRED-7.5×RBLUE+1) | [35] |
| OSAVI | 优化土壤调整植被指数 Optimized soil-adjusted vegetation index | 1.16×(RNIR-RRED)/(RNIR+RRED+0.16) | [36] |
| PRI | 光化学植被指数 Physiological reflectance index | (R531-R570)/(R530+R570) | [37] |
| TVI | 三角形植被指数 Triangle vegetation index | 0.5×[120×(R750-R550)-200×(R670-R550)] | [38] |
表3
非参数化算法"
| 算法 Algorithms | 核心算法 Core algorithm | 文献 Reference |
|---|---|---|
| PLSR | Matrix inversion | [39] |
| RF | Bootstraping | [40] |
| ANN | Levenberg-Marquardt algorithm | [41] |
| RT | Sorting & grouping | [42] |
| BaT | Bootstrap aggregation (bagging) + RT | [43] |
| BoT | Least squares boosting + RT | [44] |
| SVM | Bayesian statistical inference | [20] |
| GPR | Bayesian statistical inference | [45] |
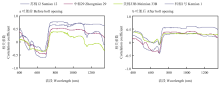
图1
不同棉花品种在不同生育时期的光谱反射率与生物量的相关系数"
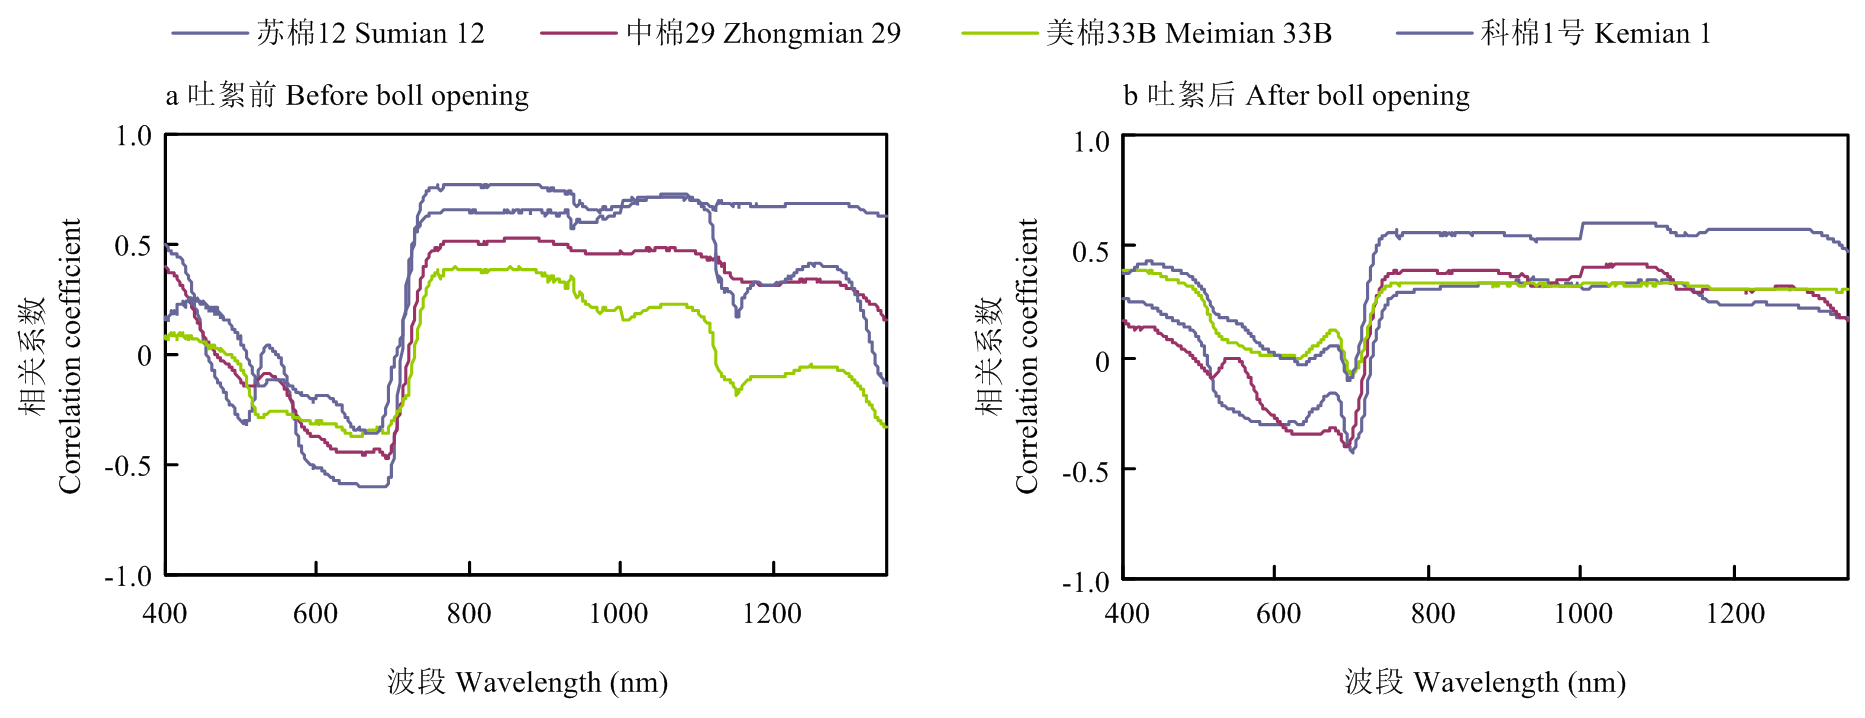
表4
各植被指数与棉花生物量之间的相关关系"
| 植被指数 Vegetation index | 相关系数 Correlation coefficient | 植被指数 Vegetation index | 相关系数 Correlation coefficient | |||
|---|---|---|---|---|---|---|
| 吐絮前 Before boll opening | 吐絮后 After boll opening | 吐絮前 Before boll opening | 吐絮后 After boll opening | |||
| GNDVI | 0.67** | 0.55** | PRI | 0.23** | 0.28* | |
| DATT | 0.63** | 0.55** | RVI | 0.26** | 0.03 | |
| CIred edge | 0.59** | 0.53** | EVI | 0.15** | 0.30** | |
| MTCI | 0.56** | 0.50** | OSAVI | 0.18** | 0.33** | |
| SRPI | 0.34** | 0.43** | DI | 0.13** | 0.16** | |
| NPCI | -0.34** | -0.42** | DVI | 0.07 | 0.14* | |
| NDVI | 0.29** | 0.36** | TVI | 0.04 | 0.10* | |
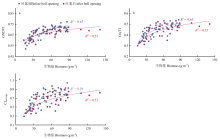
图2
最佳植被指数与棉花生物量的散点图 a:GNDVI,b:DATT,c:CIred edge,蓝色虚线和红色虚线分别是吐絮前和吐絮后数据点的最佳拟合函数"
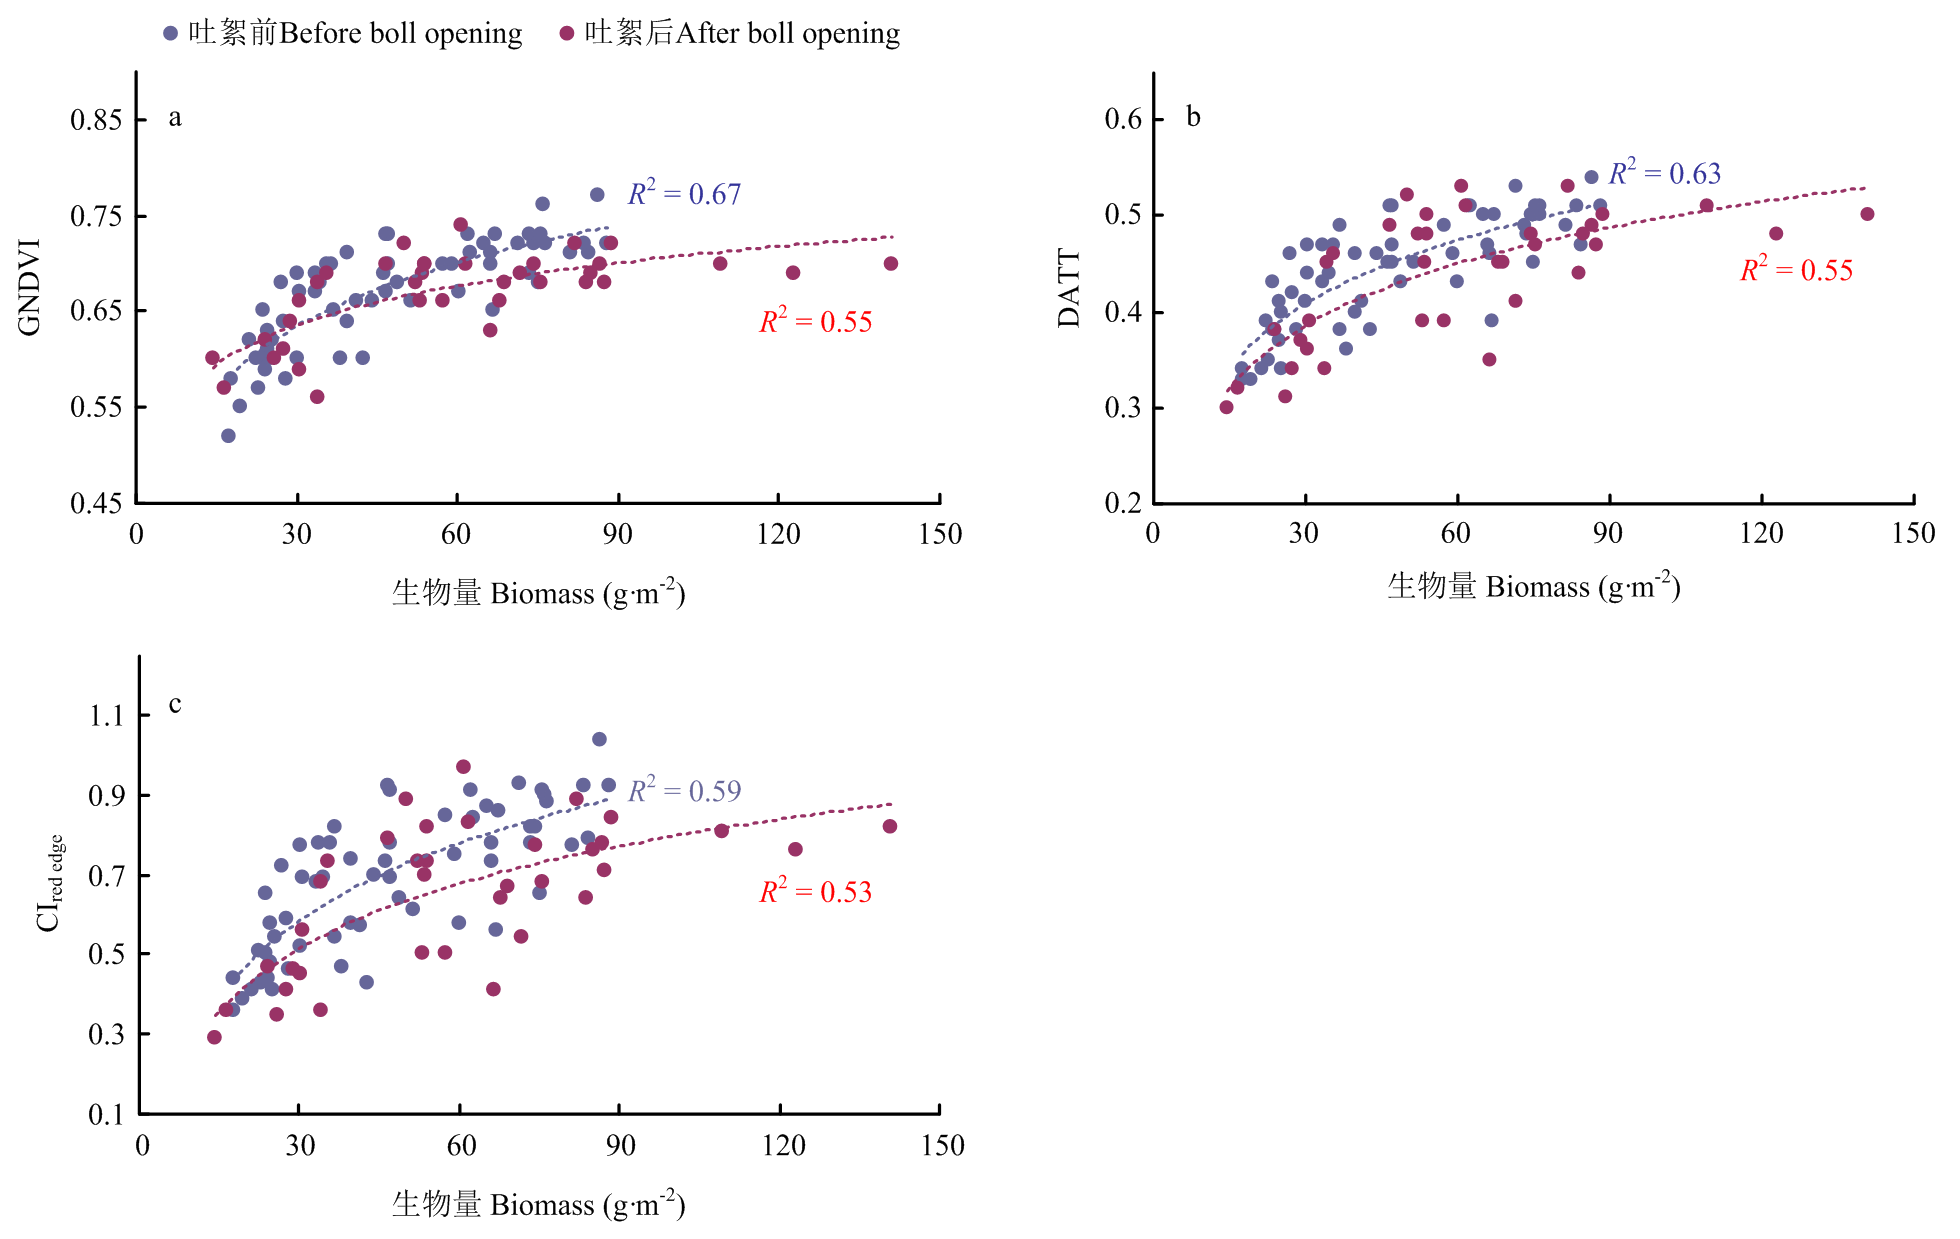
图3
最佳植被指数估测棉花生物量的全生育期预测值与实测值比较"
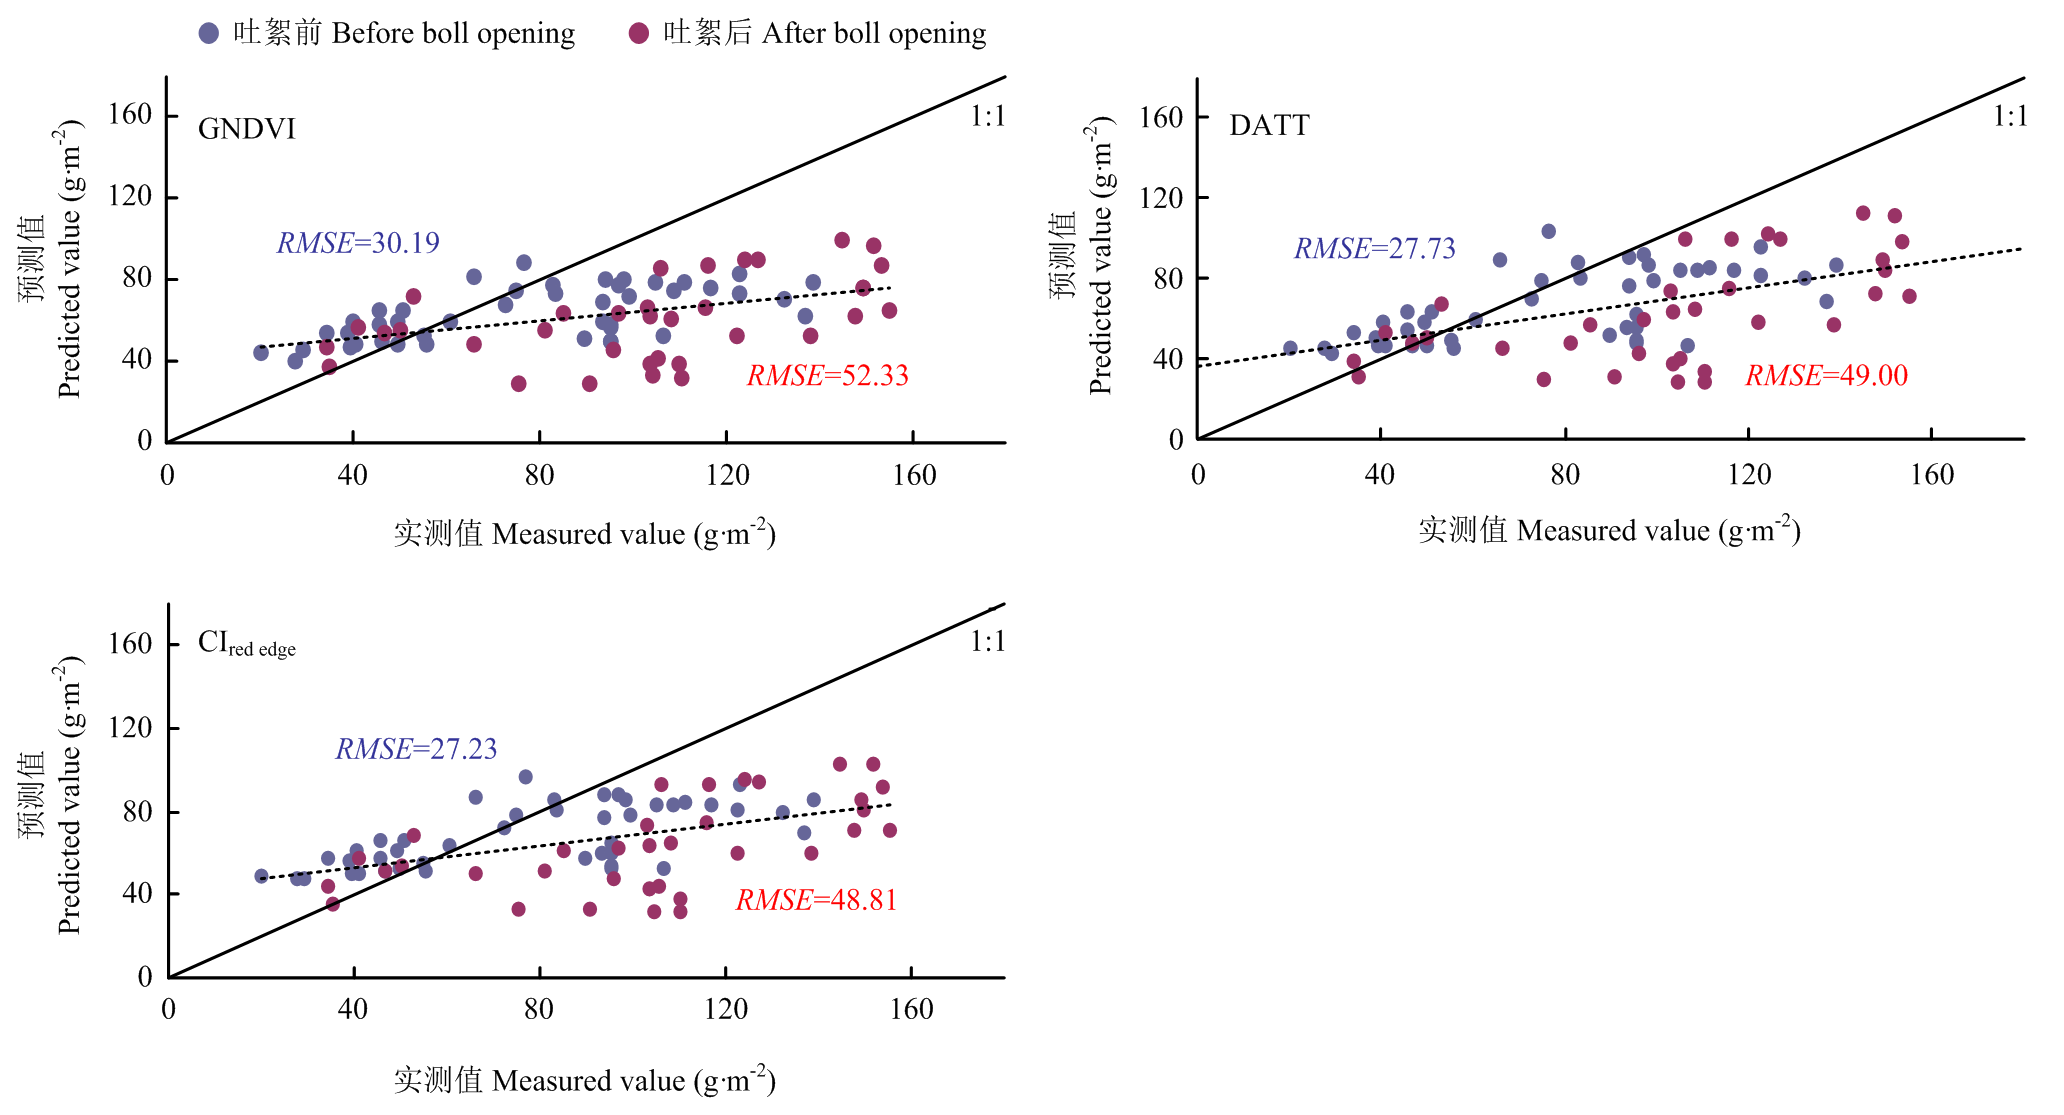
图4
CWT小波特征与棉花生物量的相关系数"
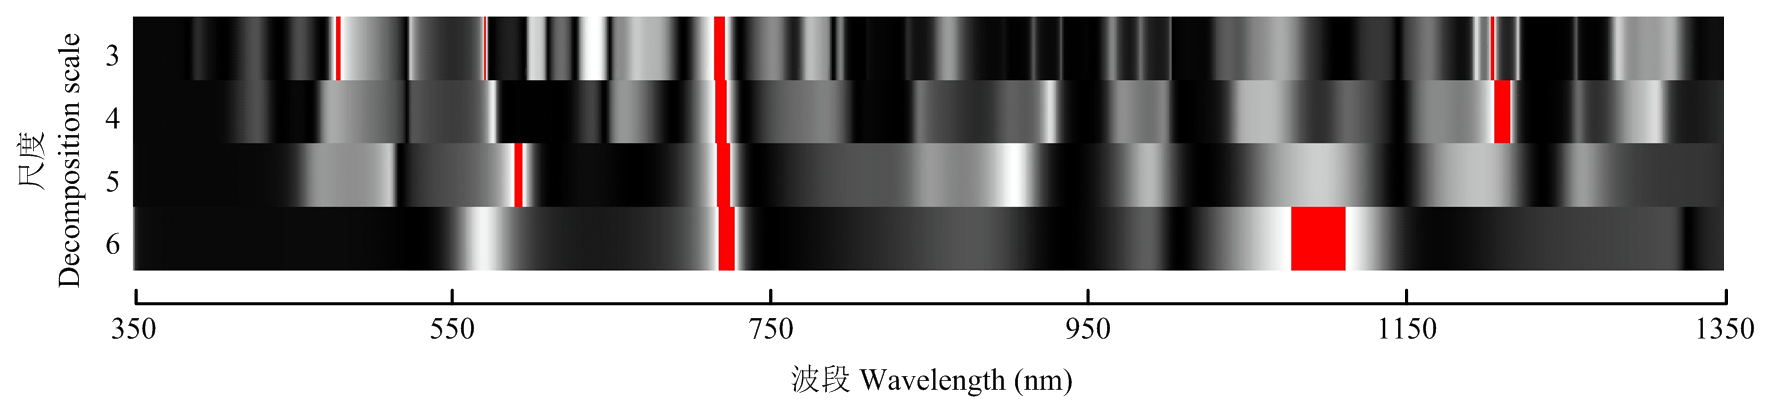
表5
基于CWT不同尺度的棉花生物量估算模型"
| 时期 Stage | 波段 Band (nm) | 尺度 Scale | 模型 model | 决定系数 Coefficient of determination (R2) | 验证 Validation | |
|---|---|---|---|---|---|---|
| R2 | RMSE (g·m-2) | |||||
| 吐絮前 Before boll opening | 1202 | 3 | y = 11.96e-197.80x | 0.41** | 0.57 | 38.43 |
| 1209 | 4 | y = 11.11e-68.73x | 0.48** | 0.63 | 31.54 | |
| 720 | 5 | y = 60.34e-3.52x | 0.58** | 0.59 | 34.56 | |
| 722 | 6 | y=44.45e-4.19x | 0.59** | 0.58 | 36.47 | |
| 吐絮后 After boll opening | 1202 | 3 | y = 8.63e-259.6x | 0.40** | 0.50 | 36.49 |
| 1209 | 4 | y = 9.40e-78.69x | 0.40** | 0.48 | 37.57 | |
| 720 | 5 | y = 78.25e-3.49x | 0.46** | 0.55 | 48.41 | |
| 722 | 6 | y=53.43e-4.80x | 0.55** | 0.54 | 39.50 | |
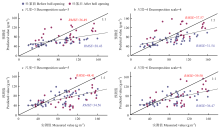
图5
最佳小波特征估算棉花生物量的全生育期预测值与实测值比较"
表6
基于非参数建模算法的棉花生物量估测模型的建模集和预测集结果"
| 方法 Methods | 吐絮前Before boll opening | 吐絮后After boll opening | ||||||
|---|---|---|---|---|---|---|---|---|
| 建模集Modeling | 预测集Predicting | 建模集Modeling | 预测集Predicting | |||||
| R2 | RMSE (g·m-2) | R2 | RMSE(g·m-2) | R2 | RMSE (g·m-2) | R2 | RMSE (g·m-2) | |
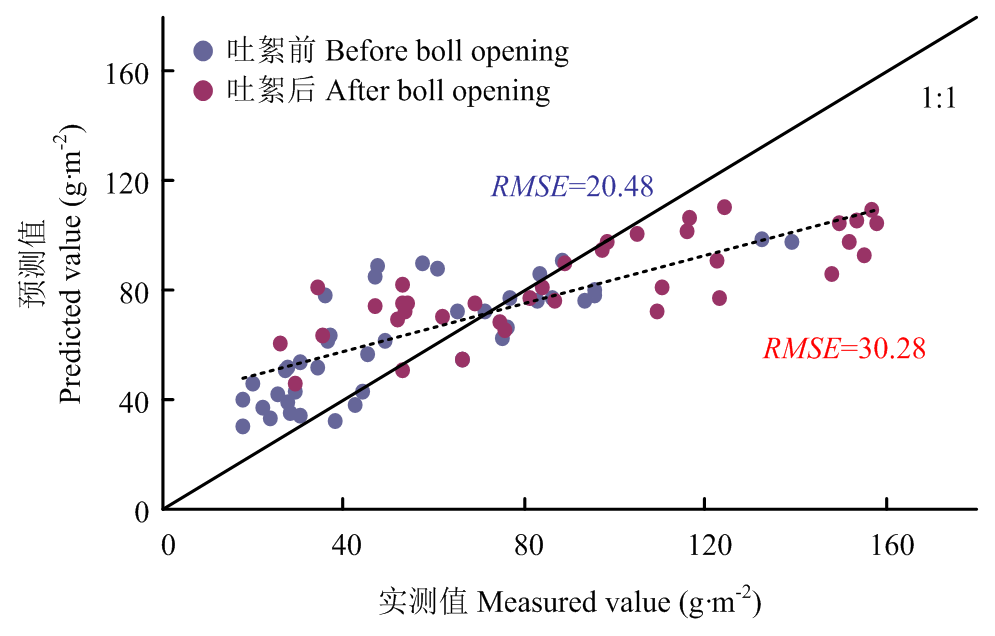
| RF | 0.76 | 11.14 | 0.53 | 20.48 | 0.57 | 16.43 | 0.65 | 30.28 |
| SVM | 0.84 | 7.47 | 0.44 | 33.55 | 0.67 | 14.61 | 0.54 | 44.25 |
| GPR | 0.85 | 7.28 | 0.38 | 29.16 | 0.38 | 19.49 | 0.39 | 53.84 |
| BaT | 0.72 | 9.30 | 0.24 | 39.92 | 0.41 | 17.89 | 0.35 | 51.61 |
| BoT | 0.96 | 3.56 | 0.22 | 39.71 | 0.91 | 7.73 | 0.36 | 51.38 |
| RT | 0.94 | 5.06 | 0.30 | 40.99 | 0.90 | 9.32 | 0.42 | 54.53 |
| PLSR | 0.43 | 15.91 | 0.13 | 30.28 | 0.35 | 23.79 | 0.19 | 30.59 |
| ANN | 0.83 | 9.76 | 0.57 | 38.09 | 0.69 | 23.41 | 0.42 | 51.99 |
图6
RF估算棉花生物量的预测值与实测值比较"
| [1] | 杨国正, 王德鹏, 聂以春, 张献龙. 钾肥用量对棉花生物量和产量的影响. 作物学报, 2013, 39(5):905-911. |
| YANG G Z, WANG D P, NIE Y C, ZHANG X L. Effect of potassium application rate on cotton (Gossypium hirsutum L.) biomass and yield. Acta Agronomica Sinica, 2013, 39(5):905-911. (in Chinese) | |
| [2] | 赵春江. 农业遥感研究与应用进展. 农业机械学报, 2014, 45(12):277-293. |
| ZHAO C J. Advances of research and application in remote sensing for agriculture. Transactions of the Chinese Society for Agricultural Machinery, 2014, 45(12):277-293. (in Chinese) | |
| [3] | 祁亚琴, 王登伟, 陈冠文, 黄春燕, 段震宇, 陈燕, 袁杰, 杨坤. 基于高光谱数据提取作物冠层特征信息的研究进展. 棉花学报, 2005, 17(6):371-375. |
| QI Y Q, WANG D W, CHEN G W, HUANG C Y, DUAN Z Y, CHEN Y, YUAN J, YANG K. Research of crop canopy characteristic information by using hyperspectral remote sensing data. Cotton Science, 2005, 17(6):371-375. (in Chinese) | |
| [4] | 黄春燕, 王登伟, 曹连莆, 张煜星, 任丽彤, 程诚. 棉花地上鲜生物量的高光谱估算模型研究. 农业工程学报, 2007, 23(3):131-135. |
| HUANG C Y, WANG D W, CAO L P, ZHANG Y X, REN L T, CHENG C. Models for estimating cotton aboveground fresh biomass using hyperspectral data. Transactions of the Chinese Society of Agricultural Engineering, 2007, 23(3):131-135. (in Chinese) | |
| [5] | 安海波, 李斐, 赵萌莉, 刘亚俊. 基于优化光谱指数的牧草生物量估算. 光谱学与光谱分析, 2015, 35(11):3155-3160. |
| AN H B, LI F, ZHAO M L, LIU Y J. Optimized spectral indices based estimation of forage grass biomass. Spectroscopy and Spectral Analysis, 2015, 35(11):3155-3160. (in Chinese) | |
| [6] |
CHENG T, SONG R Z, LI D, ZHOU K, ZHENG H B, YAO X, TIAN Y C, CAO W X, ZHU Y. Spectroscopic estimation of biomass in canopy components of paddy rice using dry matter and chlorophyll indices. Remote Sensing, 2017, 9(4):319-333.
doi: 10.3390/rs9040319 |
| [7] |
TIAN Y C, YAO X, YANG J, CAO W X, HANNAWAY D B, ZHU Y. Assessing newly developed and published vegetation indices for estimating rice leaf nitrogen concentration with ground- and space-based hyperspectral reflectance. Field Crops Research, 2011, 120(2):299-310.
doi: 10.1016/j.fcr.2010.11.002 |
| [8] |
ZHU Y, TIAN Y C, YAO X, LIU X J, CAO W X. Analysis of common canopy reflectance spectra for indicating leaf nitrogen concentrations in wheat and rice. Plant Production Science, 2007, 10(4):400-411.
doi: 10.1626/pps.10.400 |
| [9] |
CHENG T, RIVARD B, SÁNCHEZ-AZOFEIFA A G, FÉRET J B, JACQUEMOUD S, USTIN S L. Deriving leaf mass per area (LMA) from foliar reflectance across a variety of plant species using continuous wavelet analysis. ISPRS Journal of Photogrammetry and Remote Sensing, 2014, 87:28-38.
doi: 10.1016/j.isprsjprs.2013.10.009 |
| [10] |
CHENG T, RIVARD B, SÁNCHEZ-AZOFEIFA A. Spectroscopic determination of leaf water content using continuous wavelet analysis. Remote Sensing of Environment, 2010, 115(2):659-670.
doi: 10.1016/j.rse.2010.11.001 |
| [11] |
KOGER C H, BRUCE L M, SHAW D R, REDDY K N. Wavelet analysis of hyperspectral reflectance data for detecting pitted morningglory (Ipomoea lacunosa) in soybean (Glycine max). Remote Sensing of Environment, 2003, 86(1):108-119.
doi: 10.1016/S0034-4257(03)00071-3 |
| [12] |
YAO X, SI H Y, CHENG T, JIA M, CHEN Q, TIAN Y C, ZHU Y, CAO W X, CHEN C Y, CAI J Y. Hyperspectral estimation of canopy leaf biomass phenotype per ground area using a continuous wavelet analysis in wheat. Frontiers in Plant Science, 2018, 9:1360.
doi: 10.3389/fpls.2018.01360 |
| [13] | 李旭青, 刘湘南, 刘美玲, 吴伶. 水稻冠层氮素含量光谱反演的随机森林算法及区域应用. 遥感学报, 2014, 18(4):923-945. |
| LI X Q, LIU X N, LIU M L, WU L. Random forest algorithm and regional applications of spectral inversion model for estimating canopy nitrogen concentration in rice. National Remote Sensing Bulletin, 2014, 18(4):923-945. (in Chinese) | |
| [14] | 张春兰, 杨贵军, 李贺丽, 汤伏全, 刘畅, 张丽妍. 基于随机森林算法的冬小麦叶面积指数遥感反演研究. 中国农业科学, 2018, 51(5):855-867. |
| ZHANG C L, YANG G J, LI H L, TANG F Q, LIU C, ZHANG L Y. Remote sensing inversion of leaf area index of winter wheat based on random forest algorithm. Scientia Agricultura Sinica, 2018, 51(5):855-867. (in Chinese) | |
| [15] | 王念一, 于丰华, 许童羽, 杜文, 郭忠辉, 张国圣. 基于机器学习的粳稻叶片叶绿素含量高光谱反演建模. 浙江农业学报, 2020, 32(2):359-366. |
| WANG N Y, YU F H, XU T Y, DU W, GUO Z H, ZHANG G S. Hyperspectral retrieval modelling for chlorophyll contents of japonica-rice leaves based on machine learning. Acta Agriculturae Zhejiangensis, 2020, 32(2):359-366. (in Chinese) | |
| [16] | 陶惠林, 冯海宽, 杨贵军, 杨小冬, 苗梦珂, 吴智超, 翟丽婷. 基于无人机数码影像和高光谱数据的冬小麦产量估算对比. 农业工程学报, 2019, 35(23):111-118. |
| TAO H L, FENG H K, YANG G J, YANG X D, MIAO M K, WU Z C, ZHAI L T. Comparison of winter wheat yields estimated with UAV digital image and hyperspectral data. Transactions of the Chinese Society of Agricultural Engineering, 2019, 35(23):111-118. (in Chinese) | |
| [17] | 王大成, 王纪华, 靳宁, 王芊, 李存军, 黄敬峰, 王渊, 黄芳. 用神经网络和高光谱植被指数估算小麦生物量. 农业工程学报, 2008, 24(S2):196-201. |
| WANG D C, WANG J H, JIN N, WANG Q, LI C J, HUANG J F, WANG Y, HUANG F. ANN-based wheat biomass estimation using canopy hyperspectral vegetation indices. Transactions of the Chinese Society of Agricultural Engineering, 2008, 24(S2):196-201. (in Chinese) | |
| [18] | 吕杰, 汪康宁, 李崇贵, 史晓亮. 基于高光谱遥感的玉米叶绿素含量估测模型. 中国矿业大学学报, 2016, 45(2):405-410. |
| LÜ J, WANG K N, LI C G, SHI X L. Estimation models of corn chlorophyll content based on proximal hyperspectral remote sensing. Journal of China University of Mining and Technology, 2016, 45(2):405-410. (in Chinese) | |
| [19] | QI X M, ZHANG L D, DU X L, SONG Z J, XU S Y. Quantitative analysis using NIR by building PLS-BP model. Spectroscopy and Spectral Analysis, 2003, 23(5):870-872. |
| [20] |
YANG X H, HUANG J F, WU Y P, WANG J W, WANG P, WANG X M, HUETE A R. Estimating biophysical parameters of rice with remote sensing data using support vector machines. Science China Life Sciences, 2011, 54(3):272-281.
doi: 10.1007/s11427-011-4135-4 |
| [21] | 唐普恩, 丁建丽, 葛翔宇, 张振华. 基于Sentinel-2A 影像干旱区棉花叶片 SPAD 数字制图. 生态学报, 2020, 40(22):8326-8335. |
| TANG P E, DING J L, GE X Y, ZHANG Z H. SPAD digital mapping of cotton leaves in arid area based on Sentinel-2A image. Acta Ecologica Sinica, 2020, 40(22):8326-8335. (in Chinese) | |
| [22] | 陈硕博. 无人机多光谱遥感反演棉花光合参数与水分的模型研究[D]. 陕西: 西北农林科技大学, 2019. |
| CHEN S B. Modeling of cotton photosynthetic parameters and water content retrieval by multi-spectral remote sensing of UAV[D]. Shaanxi: Northwest Agriculture and Forestry University, 2019. (in Chinese) | |
| [23] | 顾生浩. 棉花功能结构模型建立与新疆棉花产量预测[D]. 北京: 中国农业大学, 2018. |
| GU S H. A functional-structural model of cotton and prediction of cotton yield in Xinjiang[D]. Beijing: China Agricultural University, 2018. (in Chinese) | |
| [24] | 马岩川. 基于高光谱遥感的棉花冠层水氮参数估算[D]. 北京: 中国农业科学院, 2020. |
| MA Y C. Estimation of water and nitrogen parameters of cotton at canopy scale based on hyperspectral remote sensing[D]. Beijing: Chinese Academy of Agricultural Sciences, 2020. (in Chinese) | |
| [25] |
VERRELST J, RIVERA J P, VEROUSTRAETE F, MUNOZ-MARI J, CLEVERS J G P W, CAMPS-VALLS G, MORENO J. Experimental Sentinel-2 LAI estimation using parametric, non-parametric and physical retrieval methods-A comparison. ISPRS Journal of Photogrammetry and Remote Sensing, 2015, 108:260-272.
doi: 10.1016/j.isprsjprs.2015.04.013 |
| [26] |
BUSCHMANN C, NAGEL E. In vivo spectroscopy and internal optics of leaves as basis for remote sensing of vegetation. International Journal of Remote Sensing, 1993, 14(4):711-722.
doi: 10.1080/01431169308904370 |
| [27] |
JORDAN C F. Derivation of leaf-area index from quality of light on the forest floor. Ecology, 1969, 50(4):663-666.
doi: 10.2307/1936256 |
| [28] |
PENUELAS J, GAMON J A, FREDEEN A L, MERINO J, FIELD C B. Reflectance indices associated with physiological changes in nitrogen- and water-limited sunflower leaves. Remote Sensing of Environment, 1994, 48(2):135-146.
doi: 10.1016/0034-4257(94)90136-8 |
| [29] |
BARNES J D, BALAGUER L, MANRIQUE E, ELVIRA S, DAVISON A W. A reappraisal of the use of DMSO for the extraction and determination of chlorophylls A and B in lichens and higher plants. Environmental and Experimental Botany, 1992, 32(2):85-100.
doi: 10.1016/0098-8472(92)90034-Y |
| [30] |
DASH J, CURRAN P J. Evaluation of the MERIS terrestrial chlorophyll index. International Journal of Remote Sensing, 2004, 25(23):5403-5413.
doi: 10.1080/0143116042000274015 |
| [31] |
DATT B. Visible/near infrared reflectance and chlorophyll content in Eucalyptus leaves. International Journal of Remote Sensing, 2010, 20(14):2741-2759.
doi: 10.1080/014311699211778 |
| [32] |
GITELSON A A, GRITZ Y R, MERZLYAK M N. Relationships between leaf chlorophyll content and spectral reflectance and algorithms for non-destructive chlorophyll assessment in higher plant leaves. Journal of Plant Physiology, 2003, 160(3):271-282.
doi: 10.1078/0176-1617-00887 |
| [33] |
MA B L, MORRISON M J, DWYER L M. Canopy light reflectance and field greenness to assess nitrogen fertilization and yield of maize. Agronomy Journal, 1996, 88(6):915-920.
doi: 10.2134/agronj1996.00021962003600060011x |
| [34] |
GITELSON A A, KAUFMAN Y J, MERZLYAK M N. Use of a green channel in remote sensing of global vegetation from EOS-MODIS. Remote Sensing of Environment, 1996, 58(3):289-298.
doi: 10.1016/S0034-4257(96)00072-7 |
| [35] |
HUETE A, DIDAN K, MIURA T, RODRIGUEZ E P, GAO X, FERREIRA L G. Overview of the radiometric and biophysical performance of the MODIS vegetation indices. Remote Sensing of Environment, 2002, 83(1):195-213.
doi: 10.1016/S0034-4257(02)00096-2 |
| [36] |
RONDEAUX G, STEVEN M, BARET F. Optimization of soil- adjusted vegetation indices. Remote Sensing of Environment, 1996, 55(2):95-107.
doi: 10.1016/0034-4257(95)00186-7 |
| [37] |
GAMON J A, PEÑUELAS J, FIELD C B. A narrow-waveband spectral index that tracks diurnal changes in photosynthetic efficiency. Remote Sensing of Environment, 1992, 41(1):35-44.
doi: 10.1016/0034-4257(92)90059-S |
| [38] |
BROGE N H, LEBLANC E. Comparing prediction power and stability of broadband and hyperspectral vegetation indices for estimation of green leaf area index and canopy chlorophyll density. Remote Sensing of Environment, 2001, 76(2):156-172.
doi: 10.1016/S0034-4257(00)00197-8 |
| [39] |
KOWALSKI B R, GELADI P. Partial least-squares regression: A tutorial. Analytica Chimica Acta, 1986, 185(1):1-17.
doi: 10.1016/0003-2670(86)80028-9 |
| [40] |
BALAGUER L. Random forests. Machine Learning, 2001, 45:5-32.
doi: 10.1023/A:1010933404324 |
| [41] |
FARIFTEH J, MEER F V D, ATZBERGER C, CARRANZA E J M. Quantitative analysis of salt-affected soil reflectance spectra: A comparison of two adaptive methods (PLSR and ANN). Remote Sensing of Environment, 2007, 110(1):59-78.
doi: 10.1016/j.rse.2007.02.005 |
| [42] | BREIMAN L I, FRIEDMAN J H, OLSHEN R A, STONE C J. Classification and regression trees. Encyclopedia of Ecology, 2015, 57(3):582-588. |
| [43] | BREIMAN L. Bagging predictors. Machine Learning, 1996, 24(2):123-140. |
| [44] | FRIEDMAN J, HASTIE T, TIBSHIRANI R. Additive logistic regression: A statistical view of boosting. The Annals of Statistics, 2000, 28(2):337-407. |
| [45] | RASMUSSEN C E, WILLIAMS C K L. Gaussian processes for machine learning [M]. New York: MIT Press, 2006. |
| [46] |
ZHENG H B, CHENG T, ZHOU M, LI D, YAO X, TIAN Y C, CAO W X, ZHU Y. Improved estimation of rice aboveground biomass combining textural and spectral analysis of UAV imagery. Precision Agriculture, 2019, 20(3):611-629.
doi: 10.1007/s11119-018-9600-7 |
| [47] | GITELSON A A, ANDRÉS V, ARKEBAUER T J, RUNDQUIST D C, GALINA K, BRYAN L. Remote estimation of leaf area index and green leaf biomass in maize canopies. Geophysical Research Letters, 2003, 30(5):335-343. |
| [48] |
WANG H F, HUO Z G, ZHOU G S, LIAO Q H, FENG H K, WU L. Estimating leaf SPAD values of freeze-damaged winter wheat using continuous wavelet analysis. Plant Physiology and Biochemistry, 2016, 98:39-45.
doi: 10.1016/j.plaphy.2015.10.032 |
| [49] |
LI D, TIAN L, WAN Z F, JIA M, CHENG T. Assessment of unified models for estimating leaf chlorophyll content across directional- hemispherical reflectance and bidirectional reflectance spectra. Remote Sensing of Environment, 2019, 231:111240.
doi: 10.1016/j.rse.2019.111240 |
| [50] |
ASNER G P. Biophysical and biochemical sources of variability in canopy reflectance. Remote Sensing of Environment, 1998, 64(3):234-253.
doi: 10.1016/S0034-4257(98)00014-5 |
| [1] | 王俊娟,陆许可,王延琴,王帅,阴祖军,付小琼,王德龙,陈修贵,郭丽雪,陈超,赵兰杰,韩迎春,孙亮庆,韩明格,张悦新,范亚朋,叶武威. 陆地棉遗传标准系TM-1的特性及其耐冷性[J]. 中国农业科学, 2022, 55(8): 1503-1517. |
| [2] | 蔡苇荻,张羽,刘海燕,郑恒彪,程涛,田永超,朱艳,曹卫星,姚霞. 基于成像高光谱的小麦冠层白粉病早期监测方法[J]. 中国农业科学, 2022, 55(6): 1110-1126. |
| [3] | 谭先明,张佳伟,王仲林,谌俊旭,杨峰,杨文钰. 基于PLS的不同水氮条件下带状套作玉米产量预测[J]. 中国农业科学, 2022, 55(6): 1127-1138. |
| [4] | 冯子恒,宋莉,张少华,井宇航,段剑钊,贺利,尹飞,冯伟. 基于无人机多光谱和热红外影像信息融合的小麦白粉病监测[J]. 中国农业科学, 2022, 55(5): 890-906. |
| [5] | 沈倩,张思平,刘瑞华,刘绍东,陈静,葛常伟,马慧娟,赵新华,杨国正,宋美珍,庞朝友. 棉花出苗期耐冷综合评价体系的构建及耐冷指标筛选[J]. 中国农业科学, 2022, 55(22): 4342-4355. |
| [6] | 朱长伟,孟威威,石柯,牛润芝,姜桂英,申凤敏,刘芳,刘世亮. 不同轮耕模式下小麦各生育时期土壤养分及酶活性变化特征[J]. 中国农业科学, 2022, 55(21): 4237-4251. |
| [7] | 王梦琪,米娜,王靖,张玉书,纪瑞鹏,陈妮娜,刘霞霞,韩颖,李王轶朴,张佳莹. 干旱胁迫下春玉米冠层吐丝动态及籽粒数模拟研究[J]. 中国农业科学, 2022, 55(18): 3530-3542. |
| [8] | 王宁,冯克云,南宏宇,张铜会. 不同水分条件下有机无机肥配施对棉花根系特征及产量的影响[J]. 中国农业科学, 2022, 55(11): 2187-2201. |
| [9] | 李帅帅, 郭俊杰, 刘文波, 韩春龙, 贾海飞, 凌宁, 郭世伟. 不同施肥模式下轮作制度引起的土壤磷素有效性变化及其影响因素[J]. 中国农业科学, 2022, 55(1): 96-110. |
| [10] | 侯彤瑜,郝婷丽,王海江,张泽,吕新. 棉花生长发育模型及其在我国的研究和应用进展[J]. 中国农业科学, 2021, 54(6): 1112-1126. |
| [11] | 刘彦伶,李渝,张艳,张雅蓉,黄兴成,张萌,张文安,蒋太明. 长期施用磷肥和有机肥黄壤微生物量磷特征[J]. 中国农业科学, 2021, 54(6): 1188-1198. |
| [12] | 陶海玉,张爱武,庞海洋,康孝岩. 智能手机原位牧草生物量估算[J]. 中国农业科学, 2021, 54(5): 933-944. |
| [13] | 娄善伟,董合忠,田晓莉,田立文. 新疆棉花“矮、密、早”栽培历史、现状和展望[J]. 中国农业科学, 2021, 54(4): 720-732. |
| [14] | 张鹏霞,周秀文,梁雪,郭营,赵岩,李斯深,孔凡美. 小麦苗期生物量及氮效率相关性状的全基因组关联分析[J]. 中国农业科学, 2021, 54(21): 4487-4499. |
| [15] | 李青,鱼海鹏,张子豪,孙正文,张艳,张冬梅,王省芬,马峙英,阎媛媛. 棉花真叶原生质体分离及瞬时表达体系的优化[J]. 中国农业科学, 2021, 54(21): 4514-4524. |
|
||