


中国农业科学 ›› 2026, Vol. 59 ›› Issue (5): 1060-1069.doi: 10.3864/j.issn.0578-1752.2026.05.011
吴媛媛1( ), 吕书文1, 张子君1, 王涛1, 张逸鸣1, 卜令超2, 邹庆道1(), 姜晶2()
收稿日期:2025-09-25
接受日期:2025-11-13
出版日期:2026-03-06
发布日期:2026-03-06
通信作者:
联系方式:
吴媛媛,E-mail:walp_411@163.com。
基金资助:
WU YuanYuan1(), LÜ ShuWen1, ZHANG ZiJun1, WANG Tao1, ZHANG YiMing1, BU LingChao2, ZOU QingDao1(), JIANG Jing2()
Received:2025-09-25
Accepted:2025-11-13
Published:2026-03-06
Online:2026-03-06
摘要:
【目的】 对番茄果实果脐大小性状进行遗传分析,提高对该性状的选择效率,加速小果脐番茄育种进程,为番茄果脐大小性状关键基因的挖掘及品种遗传改良奠定基础。【方法】 以小果脐番茄(P1)与大果脐番茄(P2)作为父母本进行杂交获得F1,F1自交、与父、母本回交,分别获得F2、BC1P1和BC1P2。在果实红熟期,运用果脐大小和果脐指数对6世代群体进行果脐大小的评价。采用数量性状主基因+多基因遗传模型进行遗传分析,利用SEA软件对24种潜在遗传模型进行拟合,通过极大似然函数值和赤池信息量准则筛选候选模型,并综合Smirnov检验、Kolmogorov检验及均匀性检验的结果以确定最优遗传模型。最后,基于最适模型,利用最小二乘法估算包括加性效应、显性效应、上位性效应,以及主基因遗传率、多基因遗传率在内的各项遗传参数。【结果】 亲本间果脐大小性状差异极显著。盛花期后55 d,大果脐番茄(P2)的平均果脐大小和果脐指数分别为小果脐番茄(P1)的9.44和8.29倍。F1群体平均果脐大小和平均果脐指数均介于2个亲本之间,BC1P1、BC1P2、F2群体的平均果脐大小和平均果脐指数呈连续性变化,变异幅度较大,变异系数为61.2%—87.4%,且F2群体频率分布呈连续的偏正态分布。遗传模型分析表明,番茄果脐大小性状的最优模型为2对加性-显性-上位性主基因+加性-显性-上位性多基因混合遗传模型(MX2-ADI-ADI)。F2群体主基因遗传率为93.05%,多基因遗传率为4.68%。2对主基因对该性状的控制以加性负向效应为主。第一主基因的显性效应倾向于减小果脐,第二主基因的显性效应倾向于增大果脐,2对基因均表现为部分显性,且第二主基因的显性作用更强。2对主基因间的加性×加性和显性×加性互作增大果脐;而显性×显性和加性×显性互作减小果脐。【结论】 番茄果脐大小为数量性状,主要由2对主基因控制。
吴媛媛, 吕书文, 张子君, 王涛, 张逸鸣, 卜令超, 邹庆道, 姜晶. 番茄果实果脐大小性状主基因+多基因遗传分析[J]. 中国农业科学, 2026, 59(5): 1060-1069.
WU YuanYuan, LÜ ShuWen, ZHANG ZiJun, WANG Tao, ZHANG YiMing, BU LingChao, ZOU QingDao, JIANG Jing. Mixed Major Gene+Polygene Genetic Analysis of Blossom-End Scar Size in Tomato Fruit[J]. Scientia Agricultura Sinica, 2026, 59(5): 1060-1069.
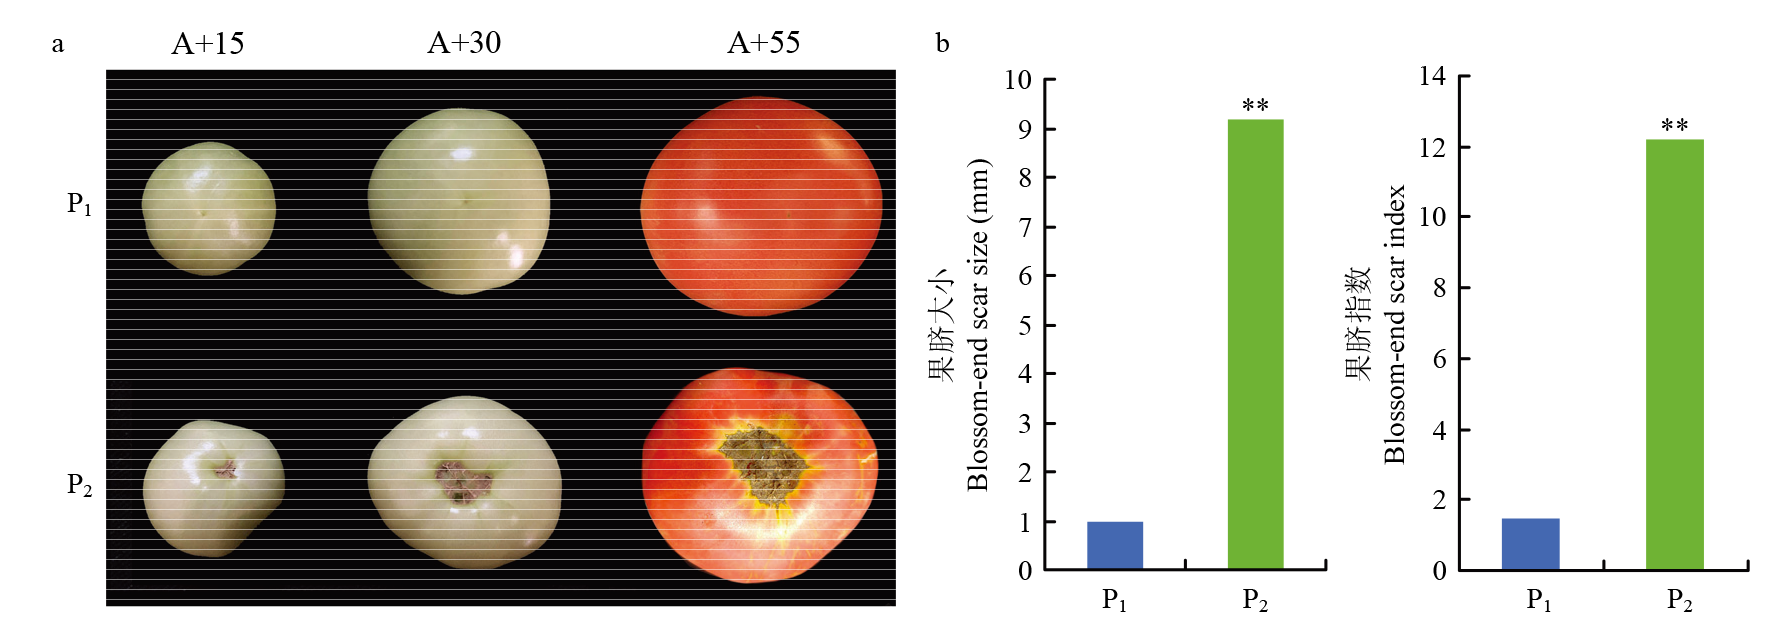
图1
小果脐(P1)和大果脐(P2)自交系不同发育时期的果实表型分析 a:不同发育时期的果实形态。A+15、A+30、A+55分别为盛花期后15、30和55 d;b:盛花期后55 d果实的果脐大小和果脐指数。**表示在P<0.01水平差异显著"
表1
各世代果脐大小统计值"
| 世代 Generation | 最大值 Maximum (mm) | 最小值 Minimum (mm) | 平均值 Mean (mm) | 标准差 SD | 变异系数 CV (%) | 偏度 Skewness | 峰度 Kurtosis |
|---|---|---|---|---|---|---|---|
| P1 | 1.2 | 0.8 | 1.0 | 0.1 | 15.2 | 0.122 | -0.379 |
| P2 | 10.9 | 7.5 | 9.2 | 1.1 | 12.4 | -0.191 | -1.291 |
| F1 | 4.6 | 3.2 | 3.9 | 0.4 | 10.6 | 0.267 | -1.124 |
| BC1P1 | 11.3 | 1.2 | 3.5 | 2.3 | 66.0 | 1.534 | 2.059 |
| BC1P2 | 19.0 | 1.1 | 7.1 | 4.6 | 65.8 | 0.779 | -0.433 |
| F2 | 24.0 | 0.7 | 6.0 | 5.3 | 87.4 | 1.364 | 1.174 |
表2
各世代果脐指数统计值"
| 世代Generation | 最大值Maximum | 最小值Minimum | 平均值Mean | 标准差SD | 变异系数CV (%) | 偏度Skewness | 峰度Kurtosis |
|---|---|---|---|---|---|---|---|
| P1 | 1.8 | 1.2 | 1.5 | 0.2 | 13.3 | 0.121 | -1.083 |
| P2 | 16.0 | 9.6 | 12.2 | 2.0 | 16.5 | 0.754 | -0.370 |
| F1 | 6.0 | 4.4 | 5.1 | 0.5 | 9.4 | -0.056 | -0.860 |
| BC1P1 | 16.5 | 1.7 | 5.3 | 3.3 | 61.7 | 1.291 | 1.337 |
| BC1P2 | 20.3 | 1.5 | 8.1 | 5.0 | 61.2 | 0.772 | -0.343 |
| F2 | 33.8 | 1.0 | 7.4 | 6.0 | 81.1 | 1.410 | 1.664 |
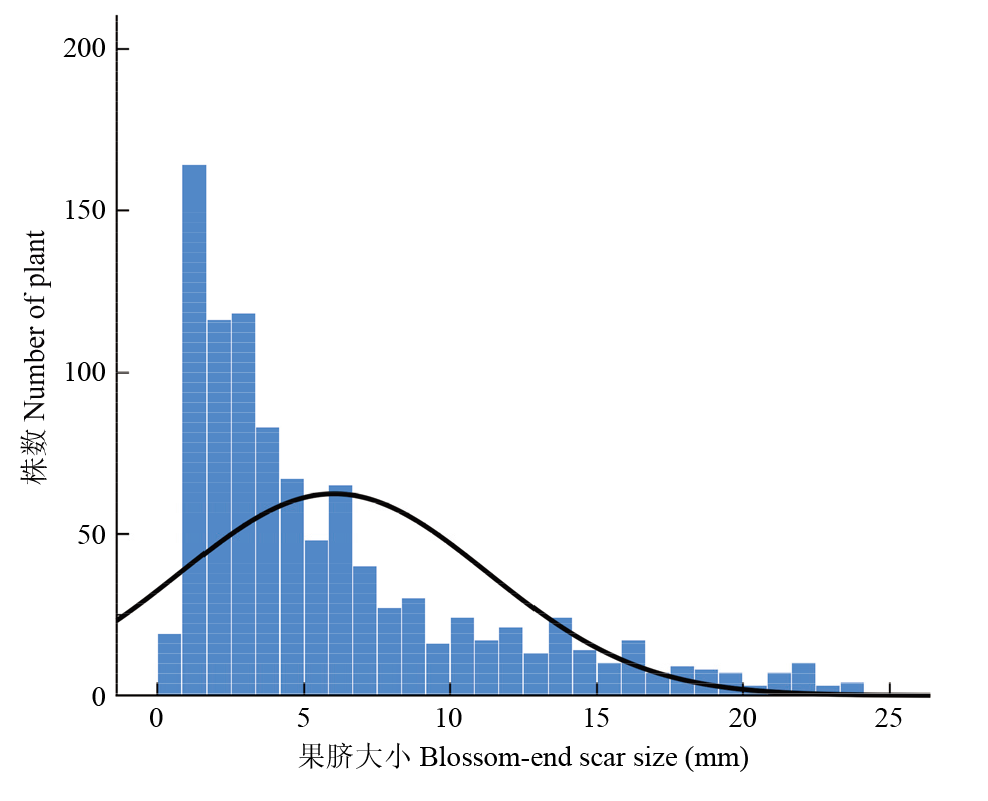
图2
F2群体果脐大小频率分布"
表3
2种方法中果脐大小表型的极大似然函数值和AIC值"
| 模型 Model code | 模型意义 Model implication | 果脐大小BSS | 果脐指数BSI | |||
|---|---|---|---|---|---|---|
| 极大似然值 Maximum likelihood value | AIC值 AIC value | 极大似然值Maximum likelihood value | AIC值 AIC value | |||
| A-1 | 1MG-AD | -3671.2871 | 7350.5742 | -3631.8838 | 7271.7677 | |
| A-2 | 1MG-A | -3630.0267 | 7266.0535 | -3740.9917 | 7487.9833 | |
| A-3 | 1MG-EAD | -3348.2441 | 6702.4882 | -3541.2858 | 7088.5716 | |
| A-4 | 1MG-AEND | -3585.3170 | 7176.6340 | -3736.0471 | 7478.0942 | |
| B-1 | 2MG-ADI | -4010.0772 | 8040.1543 | -3758.8838 | 7537.7675 | |
| B-2 | 2MG-AD | -3597.3140 | 7206.6279 | -3601.1417 | 7214.2833 | |
| B-3 | 2MG-A | -3858.7825 | 7725.5651 | -3925.1470 | 7858.2939 | |
| B-4 | 2MG-EA | -3614.6217 | 7235.2435 | -3721.9482 | 7449.8964 | |
| B-5 | 2MG-AED | -4014.7516 | 8037.5033 | -3620.2142 | 7248.4283 | |
| B-6 | 2MG-EEAD | -3994.1598 | 7994.3195 | -3756.9094 | 7519.8188 | |
| C-0 | PG-ADI | -3482.3412 | 6984.6824 | -3658.7715 | 7337.5429 | |
| C-1 | PG-AD | -3518.5710 | 7051.1421 | -3678.3726 | 7370.7451 | |
| D-0 | MX1-AD-ADI | -3277.3668 | 6578.7336 | -3493.8351 | 7011.6701 | |
| D-1 | MX1-AD-AD | -3343.6342 | 6705.2685 | -3540.1682 | 7098.3365 | |
| D-2 | MX1-A-AD | -3501.3004 | 7018.6008 | -3670.8361 | 7357.6722 | |
| D-3 | MX1-EAD-AD | -3455.0475 | 6926.0951 | -3558.5083 | 7133.0166 | |
| D-4 | MX1-AEND-AD | -3516.3418 | 7048.6837 | -3677.7386 | 7371.4773 | |
| E-0 | MX2-ADI-ADI | -3126.9814 | 6289.9628 | -3380.5097 | 6797.0195 | |
| E-1 | MX2-ADI-AD | -3205.2282 | 6440.4563 | -3436.7827 | 6903.5655 | |
| E-2 | MX2-AD-AD | -3406.8472 | 6835.6943 | -3514.5103 | 7051.0206 | |
| E-3 | MX2-A-AD | -4095.1183 | 8208.2365 | -3483.0877 | 6984.1754 | |
| E-4 | MX2-EA-AD | -3517.8101 | 7051.6203 | -3678.2384 | 7372.4768 | |
| E-5 | MX2-AED-AD | -3406.9183 | 6831.8366 | -3514.6131 | 7047.2261 | |
| E-6 | MX2-EEAD-AD | -3465.0335 | 6946.0670 | -3540.0679 | 7096.1357 | |
表4
2种方法备选模型的适应性检测结果"
| 方法 Method | 模型 Model code | 世代 Generation | 均匀性检验 U12 | 均匀性检验 U22 | 均匀性检验 U32 | Smirnov检验 nW2 | Kolmogorov检验 Dn |
|---|---|---|---|---|---|---|---|
| 果脐大小 BSS | MX2-ADI-ADI | P1 | 0.0005(0.9817) | 0.0009(0.9766) | 0.0008(0.9775) | 0.0202(0.9968) | 0.0577(1.0000) |
| P2 | 0.0059(0.9389) | 0.0282(0.8667) | 0.1402(0.7081) | 0.0480(0.8886) | 0.0693(1.0000) | ||
| F1 | 0.0275(0.8682) | 0.0001(0.9934) | 0.3716(0.5421) | 0.0833(0.6848) | 0.0493(1.0000) | ||
| BC1P1 | 0.8099(0.3682) | 0.8147(0.3667) | 0.0156(0.9005) | 0.3225(0.1231) | 0.0156(1.0000) | ||
| BC1P2 | 0.0192(0.8898) | 0.0171(0.8959) | 1.1236(0.2891) | 0.0768(0.7204) | 0.0075(1.0000) | ||
| F2 | 0.2130(0.6444) | 0.1860(0.6663) | 0.0039(0.9501) | 0.2437(0.2019) | 0.0008(1.0000) | ||
| MX2-ADI-AD | P1 | 1.2662(0.2605) | 1.0631(0.3025) | 0.0547(0.8152) | 0.1404(0.4227) | 0.0861(1.0000) | |
| P2 | 0.0087(0.9255) | 0.0000(0.9957) | 0.1162(0.7332) | 0.0455(0.9028) | 0.0773(1.0000) | ||
| F1 | 0.5765(0.4477) | 0.2815(0.5957) | 0.6701(0.4130) | 0.1504(0.3899) | 0.0653(0.9999) | ||
| BC1P1 | 0.4957(0.4814) | 0.1159(0.7335) | 1.8633(0.1722) | 0.2503(0.1937) | 0.0274(1.0000) | ||
| BC1P2 | 1.9829(0.1591) | 1.7068(0.1914) | 0.0520(0.8197) | 0.3277(0.1191) | 0.0094(1.0000) | ||
| F2 | 2.0100(0.1563) | 0.9546(0.3286) | 2.5051(0.1135) | 1.2463(0.0007)** | 0.0007(1.0000) | ||
| 果脐指数 BSI | MX2-ADI-ADI | P1 | 0.0010(0.9753) | 0.0017(0.9671) | 0.0813(0.7756) | 0.0307(0.9738) | 0.0544(1.0000) |
| P2 | 0.0544(0.8156) | 0.0474(0.8277) | 0.0011(0.9739) | 0.0490(0.8827) | 0.0641(1.0000) | ||
| F1 | 0.0043(0.9477) | 0.0197(0.8883) | 0.0949(0.7581) | 0.0679(0.7705) | 0.0435(1.0000) | ||
| BC1P1 | 0.8602(0.3537) | 0.5100(0.4751) | 0.5412(0.4619) | 0.3984(0.0759) | 0.0153(1.0000) | ||
| BC1P2 | 0.0300(0.8625) | 0.0525(0.8188) | 2.5196(0.1124) | 0.0973(0.6096) | 0.0337(1.0000) | ||
| F2 | 0.2850(0.5934) | 0.3294(0.5660) | 0.0521(0.8195) | 0.2569(0.1857) | 0.0010(1.0000) | ||
| MX2-ADI-AD | P1 | 0.0520(1.0000) | 0.0325(0.9672) | 0.0227(0.8801) | 0.0468(0.8287) | 0.0793(0.7782) | |
| P2 | 0.0675(1.0000) | 0.0412(0.9268) | 0.0095(0.9223) | 0.0103(0.9193) | 0.0008(0.9780) | ||
| F1 | 0.0350(1.0000) | 0.1015(0.5881) | 0.2569(0.6123) | 0.3525(0.5527) | 0.1696(0.6805) | ||
| BC1P1 | 0.0234(1.0000) | 0.1611(0.3584) | 0.1204(0.7286) | 0.0061(0.9377) | 2.7443(0.0976) | ||
| BC1P2 | 0.0066(1.0000) | 0.2766(0.1643) | 0.3823(0.5364) | 0.2223(0.6373) | 0.2588(0.6109) | ||
| F2 | 0.0010(1.0000) | 1.3033(0.0005)** | 2.5591(0.1097) | 1.6824(0.1946) | 1.0149(0.3137) | ||
| MX2-A-AD | P1 | 0.1000(0.9996) | 3.3304(0.0003)** | 29.9798(0.0000)** | 49.9495(0.0000)** | 49.899(0.0000)** | |
| P2 | 0.0933(0.9999) | 0.3354(0.1134) | 3.4678(0.0626) | 3.3027(0.0692) | 0.0033(0.9545) | ||
| F1 | 0.0476(1.0000) | 5.2353(0.0025)** | 49.9167(0.0000)** | 75.7528(0.0000)** | 55.5194(0.0000)** | ||
| BC1P1 | 0.0110(1.0000) | 0.3714(0.0901) | 0.6817(0.409) | 0.0031(0.9558) | 8.8552(0.0029)** | ||
| BC1P2 | 0.0755(0.7296) | 0.1251(0.4803) | 0.0003(0.9864) | 0.0183(0.8924) | 0.3684(0.5439) | ||
| F2 | 0.0010(1.0000) | 2.0633(0.0000)** | 7.3314(0.0068)** | 4.9253(0.0265)* | 2.5906(0.1075) |
表5
番茄果脐大小性状的一阶遗传参数"
| 方法 Method | 一阶遗传参数1st order parameter | |||||||||
|---|---|---|---|---|---|---|---|---|---|---|
| da | db | ha | hb | i | l | jab | jba | ha/da | hb/db | |
| 果脐大小BSS | -4.5826 | -4.5826 | -0.6656 | 1.6842 | 4.5296 | -1.8193 | -1.6922 | 0.6575 | 0.15 | -0.37 |
| 果脐指数BSI | -5.3741 | -5.3741 | -0.9316 | 1.7358 | 5.3011 | -1.7515 | -1.7427 | 0.9247 | 0.17 | -0.32 |
表6
番茄果脐大小性状的二阶遗传参数"
| 二阶遗传参数 2nd order parameter | 方法Method | ||||||
|---|---|---|---|---|---|---|---|
| 果脐大小BSS | 果脐指数BSI | ||||||
| BC1P1 | BC1P2 | F2 | BC1P1 | BC1P2 | F2 | ||
| σ2mg | 3.3719 | 20.9380 | 26.1250 | 6.0629 | 22.1673 | 33.5117 | |
| σ2pg | 1.5902 | 1.4540 | 1.2564 | 3.8923 | 1.5904 | 1.7569 | |
| h2mg (%) | 62.77 | 91.83 | 94.00 | 54.76 | 89.12 | 92.10 | |
| h2pg (%) | 29.60 | 6.38 | 4.52 | 35.15 | 6.39 | 4.83 | |
| E (%) | 7.63 | 1.79 | 1.48 | 10.09 | 4.49 | 3.07 | |
| [1] |
王志文, 王惠林, 孙思琼, 杨奎, 徐宝林. 甜瓜果脐大小与雌花、果实性状相关性分析. 新疆农业大学学报, 2020, 43(6): 429-435.
|
|
|
|
| [2] |
王利英, 石瑶, 刘文明, 于海龙, 黄国清. 茄子果实主要性状与果脐因素的相关和通径分析. 天津农业科学, 2008, 14(5): 11-13.
|
|
|
|
| [3] |
李仁静, 申晚霞, 赵婉彤, 程莉, 李沛, 江东. 利用SLAF-seq 简化基因组数据挖掘甜橙果实品质性状基因. 中国农业科学, 2023, 56(16): 3168-3182. doi: 10.3864/j.issn.0578-1752.2023.16.010.
|
|
|
|
| [4] |
|
| [5] |
doi: 10.21273/JASHS.119.1.32 |
| [6] |
doi: 10.1007/BF00023087 |
| [7] |
doi: 10.1007/BF00023165 |
| [8] |
doi: 10.1007/BF00023649 |
| [9] |
盖钧镒. 植物数量性状遗传体系的分离分析方法研究. 遗传, 2005, 27(1): 130-136.
|
|
|
|
| [10] |
路昭亮, 柳李旺, 龚义勤, 李小艳, 宋立君, 杨金兰, 汪隆植. 萝卜干物重和可溶性总糖含量的遗传分析. 南京农业大学学报, 2009, 32(3): 25-29.
|
|
|
|
| [11] |
何艳龙. 番茄果实硬度遗传规律研究. 北方园艺, 2016(14): 17-22.
|
|
|
|
| [12] |
李毅丰, 唐贝贝, 王帅, 张宁, 邓晓霞, 毛秀杰. 短节间黄果番茄单果重的遗传分析. 安徽农业科学, 2021, 49(5): 65-68.
|
|
|
|
| [13] |
任婧. 番茄果实可溶性糖含量遗传规律的研究及QTL定位[D]. 哈尔滨: 东北农业大学, 2018.
|
|
|
|
| [14] |
李珊珊. 番茄果实相关性状遗传分析和糖含量的QTL定位[D]. 杨凌: 西北农林科技大学, 2025.
|
|
|
|
| [15] |
翟英. 番茄果实色泽和色素含量的遗传特征. 分子植物育种, 2019, 17(1): 264-269.
|
|
|
|
| [16] |
李珊珊, 梁盼, 孟繁艺, 马梦秋, 胡体旭, 梁燕, 蔡义勇, 战祥强. 番茄叶面积的遗传分析和BSA-QTL定位. 中国瓜菜, 2025, 38(2): 40-49.
|
|
|
|
| [17] |
王晶, 刘婧仪, 梁燕. 番茄萼片形态性状遗传分析. 西北农林科技大学学报(自然科学版), 2020, 48(6): 62-69, 78.
|
|
|
|
| [18] |
刘德海, 付尚谭, 金彤, 汪淑芬. 番茄萼片形态性状遗传规律及其与果实性状相关性分析. 分子植物育种, 2023: 1-13. (2023 -04-12). https://kns.cnki.net/kcms/detail/46.1068.S.20230412.1101.002.html.
|
|
|
|
| [19] |
沈渊博. 番茄萼片上翘度遗传规律分析与QTL定位[D]. 杨凌: 西北农林科技大学, 2022.
|
|
|
|
| [20] |
马雅琳, 梁燕. 番茄长花柱性状遗传规律与QTL分析. 园艺学报, 2020, 47(2): 264-274.
|
|
doi: 10.16420/j.issn.0513-353x.2019-0458 |
|
| [21] |
张娜. 番茄封顶花序数遗传规律及BSA分析[D]. 秦皇岛: 河北科技师范学院, 2020.
|
|
|
|
| [22] |
李艳琪, 曹晓宇, 李博宇, 王亦希, 张德楷, 战祥强, 胡体旭. 番茄花序梗部长度的遗传分析. 中国蔬菜, 2023(9): 38-47.
|
|
|
|
| [23] |
董晨晨. 番茄果穗性状的遗传分析与果穗长度主效QTL的定位[D]. 北京: 中国农业科学院, 2023.
|
|
|
|
| [24] |
张宁, 刘文超, 李毅丰, 王帅, 曹霞, 毛秀杰. 番茄苗期节间长度的遗传规律分析. 中国果菜, 2022, 42(3): 62-66, 71.
|
|
|
|
| [25] |
谷雨. 番茄苗期上胚轴长度性状遗传特征与相关基因鉴定分析[D]. 沈阳: 沈阳农业大学, 2022.
|
|
|
|
| [26] |
王茜. 番茄耐低钾性状的遗传分析及精细定位[D]. 沈阳: 沈阳农业大学, 2021.
|
|
|
|
| [27] |
苏百童, 阎世江. 番茄苗期耐低温性主基因-多基因联合遗传分析. 中国瓜菜, 2023, 36(12): 54-58.
|
|
|
|
| [28] |
盖钧镒, 章元明, 王建康. 植物数量性状遗传体系. 北京: 科学出版社, 2003: 22-25.
|
|
|
|
| [29] |
doi: 10.1017/S0016672303006141 |
| [30] |
doi: 10.1134/S1022795408030137 |
| [31] |
梁长志, 李静, 白若宇, 陈艳丽, 李永财, 徐文静, 牛旭旭, 胡建斌. 基于多世代群体的甜瓜果实色泽和外形性状的遗传分析. 中国瓜菜, 2019, 32(10): 6-10.
|
|
|
|
| [32] |
王志文. 甜瓜果脐大小性状遗传分析及其影响因素研究[D]. 乌鲁木齐: 新疆农业大学, 2021.
|
|
|
| [1] | 彭廷燊, 陆久焱, 吴美林, 严雨欣, 刘宏周, 南文斌, 秦小健, 李明, 龚俊义, 梁永书. 多年生水稻黄糯2号和长白7号产量相关性状的QTL分析[J]. 中国农业科学, 2026, 59(7): 1361-1379. |
| [2] | 王玉萍, 符质, 孙佳莹, 穆晓萌, 刘慧淋, 郭进云, 宋文菁, 侯雷平, 赵海亮. 苗期施用褪黑素对番茄短期低温胁迫的缓解作用与应用效果评价[J]. 中国农业科学, 2026, 59(7): 1523-1535. |
| [3] | 张敏, 李鑫, 张勇, 钟德萍, 鲁晓晓, 何淑敏, 陈冬红, 李烨, 李荣霞, 黄泽军, 王孝宣, 国艳梅, 杜永臣, 刘洪海, 李君明, 刘磊. 加工番茄高可溶性固形物含量位点的遗传与互作效应分析[J]. 中国农业科学, 2025, 58(9): 1816-1829. |
| [4] | 张亚封, 董伟进, 李启云, 路杨, 张正坤, 隋丽. 球孢白僵菌与钾元素互作对番茄果实品质的影响[J]. 中国农业科学, 2025, 58(6): 1131-1144. |
| [5] | 杨永庆, 胡朋举, 宋亚辉, 金欣欣, 苏俏, 王瑾. 超高油花生种质SW9721-3品质性状的QTL定位[J]. 中国农业科学, 2025, 58(4): 635-646. |
| [6] | 王少骅, 沈年桥, 储天然, 吴永汉, 李康宁, 石延霞, 谢学文, 李磊, 范腾飞, 李宝聚, 柴阿丽. 浙江苍南番茄-水稻轮作对连作土壤理化性质和微生物群落的影响[J]. 中国农业科学, 2025, 58(4): 692-703. |
| [7] | 苏晓梅, 杨宗辉, 刘淑梅, 张宗杰, 吕宏君, 侯丽霞. 番茄品种KASP标记鉴定技术体系的构建与应用[J]. 中国农业科学, 2025, 58(22): 4746-4756. |
| [8] | 郭孟泽, 张磊, 孙平平, 江彪, 闫晋强, 李正男. ToLCNDV广东冬瓜分离物的分子特征及其遗传演化规律[J]. 中国农业科学, 2025, 58(19): 3890-3904. |
| [9] | 马佳, 彭杰丽, 王旭, 贾楠, 李孟凯, 胡栋. 链霉菌TOR3209对低温胁迫下番茄植株叶绿素合成和多胺含量的影响[J]. 中国农业科学, 2025, 58(15): 3064-3080. |
| [10] | 郑敏华, 陈洛, 邢甲乐, 谢月兰, 姜先芽, 聂帅, 蔡甫格, 巫浩翔, 陆展华, 孙伟, 霍兴, 白嵩, 赵均良, 杨武. 华南籼稻稻瘟病抗性QTL鉴定与候选基因挖掘[J]. 中国农业科学, 2025, 58(14): 2707-2719. |
| [11] | 李晓雁, 杜娅丹, 胡笑涛, 卢怡宁, 谷晓博. 加气滴灌下施氮对番茄水力特性和光合能力的影响[J]. 中国农业科学, 2025, 58(11): 2225-2238. |
| [12] | 赵真坚, 王凯, 陈栋, 申琦, 余杨, 崔晟頔, 王俊戈, 陈子旸, 禹世欣, 陈佳苗, 王翔枫, 唐国庆. 基因组和DNA甲基化组联合分析筛选猪肉质性状关键基因[J]. 中国农业科学, 2024, 57(7): 1394-1406. |
| [13] | 孙昭安, 张译文, 江丽华, 李昭君, 郭鑫, 曹慧, 孟凡乔. 番茄嫁接和施氮对氮肥去向和氮平衡的影响[J]. 中国农业科学, 2024, 57(4): 755-764. |
| [14] | 张桂芬, 万坤, 潘梦妮, 王龙, 黄聪, 王玉生, 张毅波, 冼晓青, 杨念婉, 桂富荣, 刘万学, 万方浩. 番茄潜叶蛾种群定殖与种群重建及延续能力研究[J]. 中国农业科学, 2024, 57(3): 514-524. |
| [15] | 裴书瑶, 曹红霞, 张泽宇, 赵方洋, 李志军. 盆栽番茄对NaCl和Na2SO4微咸水灌溉的生理响应[J]. 中国农业科学, 2024, 57(3): 570-583. |
|
||