


中国农业科学 ›› 2024, Vol. 57 ›› Issue (8): 1430-1443.doi: 10.3864/j.issn.0578-1752.2024.08.002
吴玉珍1,2( ), 黄龙雨1,2, 周大云1,2, 黄义文1,2, 付守阳1,2, 彭军1,2(), 匡猛1,2()
收稿日期:2023-11-09
接受日期:2024-01-08
出版日期:2024-04-16
发布日期:2024-04-24
通信作者:
联系方式:
吴玉珍,Tel:13629838042;E-mail:15959263920@163.com。
基金资助:
WU YuZhen1,2(), HUANG LongYu1,2, ZHOU DaYun1,2, HUANG YiWen1,2, FU ShouYang1,2, PENG Jun1,2(), KUANG Meng1,2()
Received:2023-11-09
Accepted:2024-01-08
Published:2024-04-16
Online:2024-04-24
摘要:
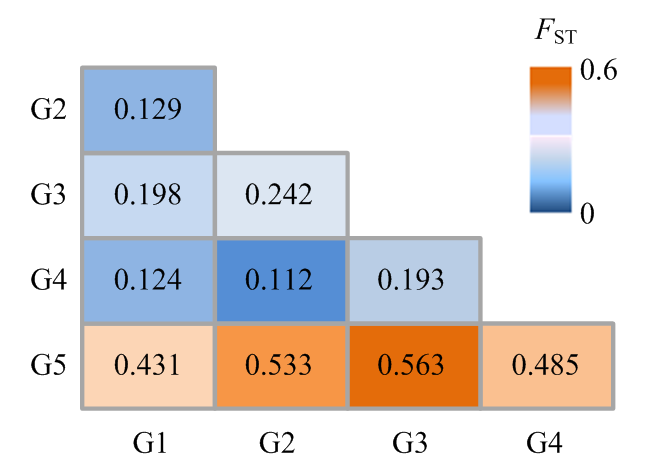
【目的】棉花是一种异源四倍体作物,基因组结构复杂,常异花授粉的繁殖方式也导致棉花品种难以实现高度纯合;棉种市场缺乏有效的监管技术手段,品种多乱杂现象长期存在,严重影响纤维品质一致性。构建中国近20年棉花审定品种标准样品的DNA指纹库,探索棉花品种高通量SSR身份鉴定模式,为棉花品种真实性鉴定和新品种特异性鉴定提供依据;分析审定品种的遗传多样性和群体分化,为棉花不同生态区的适应性鉴定和培育适应新环境的品种提供理论基础。【方法】基于多重PCR技术和毛细管电泳检测方法,使用筛选得到的60个SSR标记构建1 015份棉花审定品种标准样品的DNA指纹库,通过植物品种DNA指纹库管理系统对审定品种SSR指纹进行两两比对,分析审定品种的遗传差异,筛选用于品种鉴定的核心SSR位点。利用聚类分析法和群体结构分析法分析1 015份棉花审定品种的遗传多样性,并计算群体间遗传分化指数。【结果】60个SSR标记在1 015个审定品种中共扩增出216种等位变异,平均等位变异数为3.6,平均PIC值为0.37。1 015个审定品种的SSR指纹进行两两比较,共产生513 591组结果,样品间最大差异位点数为58个。差异位点百分比主要集中在41%—70%,涉及428 115组,占83.36%;其中,差异位点百分比在51%—60%时,涉及组数最多,为197 829组,占38.52%。品种间差异位点百分比大于20%时,占所有品种两两比对组数的99%以上,差异位点百分比低于20%的比对结果只占0.58%。基于组合鉴定法,筛选一套包含10个SSR位点的核心位点组合,在1 015个品种中鉴别能力达到99%。聚类结果和群体结构分析表明,1 015个品种被清晰地划分为5个亚群,G1(n=240)为早熟棉亚群,主要分布于中国北部和西北内陆地区,该亚群品种遗传多样性最丰富,品种间平均遗传距离为0.419。G2(n=277)亚群为中熟棉亚群,分布于长江流域,该亚群杂交种较多,亚群内平均遗传距离为0.309。G3(n=109)亚群属于早熟、中熟棉亚群,分布于河北黑龙港地区,该亚群品种遗传组分相对单一,亚群内平均遗传距离在陆地棉群体中最小,仅为0.150。G4(n=254)亚群属于中早熟棉亚群,主要分布于黄河流域,群体内平均遗传距离为0.307。G5(n=37)亚群由37份海岛棉组成,群体内平均遗传距离最小,为0.149。海岛棉与陆地棉之间遗传分化水平最高,平均FST值为0.503;陆地棉群体内,G3亚群与其他亚群之间遗传分化水平最高,FST值为0.193—0.242。长江流域与黄河流域相比,遗传分化水平最低,FST值为0.112。【结论】构建了1 015个中国近20年审定品种标准样品DNA指纹库,筛选了一套包含10个SSR位点的核心标记组合,可以清晰地鉴别99%以上的品种,创建了“核心位点+扩展位点”的高通量棉花鉴定模式;1 015个品种被划分为5个亚群,其中,陆地棉具有明显的地理分布特征。
吴玉珍, 黄龙雨, 周大云, 黄义文, 付守阳, 彭军, 匡猛. 中国棉花审定品种SSR指纹库的构建与综合评价[J]. 中国农业科学, 2024, 57(8): 1430-1443.
WU YuZhen, HUANG LongYu, ZHOU DaYun, HUANG YiWen, FU ShouYang, PENG Jun, KUANG Meng. Construction of SSR Fingerprint Library and Comprehensive Evaluation for Approved Cotton Varieties in China[J]. Scientia Agricultura Sinica, 2024, 57(8): 1430-1443.
表1
多重引物组合信息"
| 组合 Group | PET荧光标记(红) PET (Red) | FAM荧光标记(蓝) FAM (Blue) | VIC荧光标记(绿) VIC (Green) | NED荧光标记(黑) NED (Black) |
|---|---|---|---|---|
| 1 | PC05、PC06、PC24 | PC30、PC12 | PC04、PC15、PC03 | PC25、PC16 |
| 2 | PC10、PC22、PC29 | PC11、PC18、PC23 | PC14、PC21 | PC07、PC09 |
| 3 | PC17、PC20、PC28 | PC02、PC26、PC27 | PC08、PC19 | PC01、PC13 |
| 4 | PC36、PC49、PC59 | PC39、PC41、PC42 | PC43、PC45 | PC31、PC35 |
| 5 | PC51、PC52、PC53 | PC32、PC50、PC55 | PC38、PC47 | PC57、PC60 |
| 6 | PC48、PC54 | PC34、PC44、PC58 | PC37、PC46 | PC33、PC40、PC56 |
表2
60个SSR引物扩增效果"
| 引物编号 Marker No. | 等位基因数目 Allele No. | 基因型数目 Genotype No. | 遗传多样性 Gene diversity | 杂合率 Heterozygosity | PIC | 主要等位变异及频率 Major allele, frquency |
|---|---|---|---|---|---|---|
| PC01 | 5 | 11 | 0.59 | 0.33 | 0.53 | 313, 0.56 |
| PC02 | 4 | 8 | 0.27 | 0.10 | 0.25 | 290, 0.85 |
| PC03 | 5 | 12 | 0.62 | 0.51 | 0.55 | 182, 0.46 |
| PC04 | 3 | 4 | 0.49 | 0.50 | 0.37 | 367, 0.59 |
| PC05 | 3 | 5 | 0.52 | 0.48 | 0.41 | 268, 0.57 |
| PC06 | 4 | 9 | 0.56 | 0.57 | 0.48 | 341, 0.53 |
| PC07 | 9 | 17 | 0.55 | 0.45 | 0.47 | 264, 0.57 |
| PC08 | 6 | 12 | 0.39 | 0.32 | 0.36 | 153, 0.76 |
| PC09 | 3 | 5 | 0.29 | 0.36 | 0.26 | 216, 0.84 |
| PC10 | 3 | 5 | 0.25 | 0.16 | 0.23 | 369, 0.86 |
| PC11 | 4 | 9 | 0.48 | 0.46 | 0.40 | 392, 0.65 |
| PC12 | 6 | 16 | 0.65 | 0.49 | 0.60 | 307, 0.50 |
| PC13 | 5 | 13 | 0.64 | 0.52 | 0.58 | 217, 0.50 |
| PC14 | 4 | 8 | 0.42 | 0.33 | 0.35 | 343, 0.71 |
| PC15 | 5 | 15 | 0.65 | 0.56 | 0.60 | 239, 0.52 |
| PC16 | 5 | 11 | 0.42 | 0.27 | 0.39 | 190, 0.74 |
| PC17 | 7 | 15 | 0.61 | 0.51 | 0.54 | 196, 0.50 |
| PC18 | 5 | 11 | 0.54 | 0.44 | 0.47 | 238, 0.61 |
| PC19 | 3 | 6 | 0.46 | 0.37 | 0.38 | 235 0.67 |
| PC20 | 3 | 5 | 0.54 | 0.38 | 0.43 | 306, 0.51 |
| PC21 | 4 | 7 | 0.62 | 0.60 | 0.54 | 189, 0.44 |
| PC22 | 3 | 5 | 0.40 | 0.36 | 0.32 | 218, 0.72 |
| PC23 | 2 | 3 | 0.50 | 0.57 | 0.37 | 184, 0.54 |
| PC24 | 3 | 6 | 0.52 | 0.52 | 0.43 | 199, 0.57 |
| PC25 | 2 | 3 | 0.45 | 0.46 | 0.35 | 240, 0.66 |
| PC26 | 3 | 4 | 0.42 | 0.28 | 0.33 | 172, 0.70 |
| PC27 | 3 | 6 | 0.53 | 0.40 | 0.43 | 340, 0.52 |
| PC28 | 4 | 6 | 0.47 | 0.42 | 0.38 | 258, 0.65 |
| PC29 | 10 | 27 | 0.68 | 0.50 | 0.63 | 177, 0.45 |
| PC30 | 3 | 6 | 0.46 | 0.41 | 0.39 | 224, 0.67 |
| PC31 | 2 | 3 | 0.50 | 0.53 | 0.37 | 220, 0.52 |
| PC32 | 2 | 3 | 0.49 | 0.49 | 0.37 | 218, 0.55 |
| PC33 | 2 | 3 | 0.23 | 0.17 | 0.20 | 335, 0.87 |
| PC34 | 2 | 3 | 0.28 | 0.17 | 0.24 | 307, 0.84 |
| PC35 | 3 | 4 | 0.26 | 0.11 | 0.24 | 342, 0.85 |
| PC36 | 6 | 11 | 0.39 | 0.40 | 0.36 | 271, 0.76 |
| PC37 | 2 | 3 | 0.27 | 0.22 | 0.24 | 305, 0.84 |
| PC38 | 3 | 5 | 0.49 | 0.40 | 0.40 | 297, 0.63 |
| PC39 | 2 | 3 | 0.10 | 0.06 | 0.09 | 255, 0.95 |
| PC40 | 2 | 3 | 0.23 | 0.23 | 0.20 | 226, 0.87 |
| PC41 | 2 | 3 | 0.39 | 0.31 | 0.32 | 301, 0.73 |
| PC42 | 2 | 3 | 0.50 | 0.50 | 0.37 | 172, 0.51 |
| PC43 | 6 | 9 | 0.30 | 0.22 | 0.27 | 323, 0.83 |
| PC44 | 2 | 3 | 0.31 | 0.22 | 0.26 | 384, 0.81 |
| PC45 | 2 | 3 | 0.47 | 0.47 | 0.36 | 232, 0.62 |
| PC46 | 2 | 3 | 0.30 | 0.26 | 0.25 | 192, 0.82 |
| PC47 | 2 | 3 | 0.41 | 0.22 | 0.33 | 219, 0.71 |
| PC48 | 3 | 6 | 0.39 | 0.36 | 0.32 | 324, 0.73 |
| PC49 | 2 | 3 | 0.41 | 0.32 | 0.33 | 214, 0.71 |
| PC50 | 4 | 8 | 0.37 | 0.15 | 0.33 | 331, 0.77 |
| PC51 | 2 | 3 | 0.49 | 0.42 | 0.37 | 319, 0.57 |
| PC52 | 3 | 6 | 0.45 | 0.37 | 0.37 | 255, 0.69 |
| PC53 | 2 | 3 | 0.43 | 0.38 | 0.34 | 173, 0.68 |
| PC54 | 7 | 12 | 0.22 | 0.03 | 0.21 | 240, 0.88 |
| PC55 | 4 | 8 | 0.36 | 0.23 | 0.32 | 267, 0.77 |
| PC56 | 2 | 3 | 0.40 | 0.40 | 0.32 | 266, 0.72 |
| PC57 | 2 | 3 | 0.47 | 0.49 | 0.36 | 304, 0.62 |
| PC58 | 4 | 9 | 0.42 | 0.33 | 0.39 | 223, 0.74 |
| PC59 | 5 | 11 | 0.29 | 0.14 | 0.28 | 308, 0.84 |
| PC60 | 3 | 6 | 0.34 | 0.14 | 0.30 | 230, 0.79 |
| 平均Mean | 3.6 | 7 | 0.43 | 0.36 | 0.37 | - |
表3
棉花审定品种遗传差异分析"
| 差异位点百分比 Percentage of different loci (%) | 差异位点数 <BOLD>D</BOLD>ifferent loci No. | 涉及组数 Group No. | 所占比例 <BOLD>P</BOLD>roportion (%) | 累计百分比 <BOLD>C</BOLD>umulative percentage (%) |
|---|---|---|---|---|
| 91-100 | 55-60 | 772 | 0.15 | 0.15 |
| 81-90 | 49-54 | 16879 | 3.29 | 3.44 |
| 71-80 | 43-48 | 31906 | 6.21 | 9.65 |
| 61-70 | 37-42 | 117749 | 22.93 | 32.58 |
| 51-60 | 31-36 | 197829 | 38.52 | 71.10 |
| 41-50 | 25-30 | 112537 | 21.91 | 93.01 |
| 31-40 | 19-24 | 28200 | 5.49 | 98.50 |
| 21-30 | 13-18 | 4734 | 0.92 | 99.42 |
| 11-20 | 7-12 | 2367 | 0.46 | 99.88 |
| 6-10 | 4-6 | 412 | 0.08 | 99.96 |
| 0-5 | 0-3 | 206 | 0.04 | 100.00 |
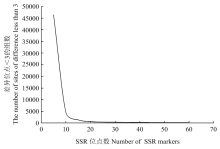
图1
SSR位点组合对1 015个样品的鉴别能力"
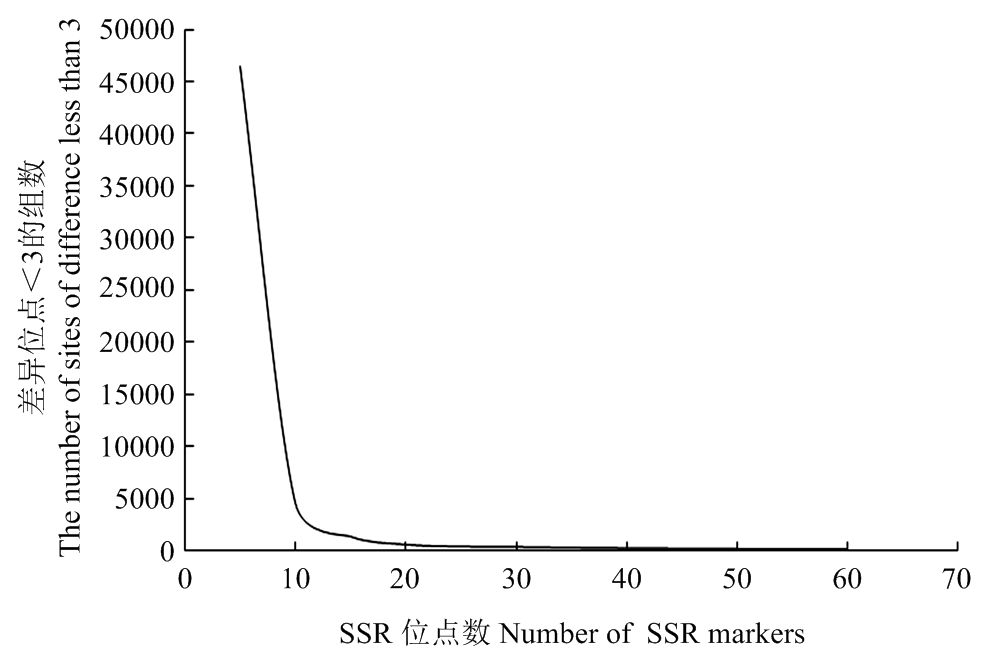
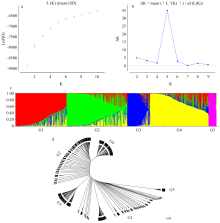
图2
1 015个棉花品种群体结构和聚类分析 a:Ln(P(D))与K值变化折线图;b:利用ΔK估算亚群数目;c:K=5时的群体结构图;d:1 015个棉花品种聚类图"

表4
1 015个样品群体结构分析中亚群信息"
| 亚群名称 Subgroup name | 分布地区 Area of distribution | 材料数目 No. of materials | 杂交种数目 No. of hybrids | 群体内平均遗传距离 Average genetic distance within a subgroup |
|---|---|---|---|---|
| G1 | 中国北部和西北内陆North China and Northwest China | 240 | 19 | 0.419 |
| G2 | 长江流域Yangtze River region | 277 | 191 | 0.309 |
| G3 | 河北省黑龙港地区Heilonggang region, Hebei | 109 | 35 | 0.150 |
| G4 | 黄河流域Yellow River region | 254 | 110 | 0.307 |
| G5 | 新疆(海岛棉)Xinjiang (Island cotton) | 37 | 0 | 0.149 |
| H | / | 98 | 43 | / |
图3
成对比较亚群间的平均FST值"
| [1] |
赵久然, 王凤格, 易红梅, 田红丽, 杨扬. 我国玉米品种标准DNA指纹库构建研究及应用进展. 作物杂志, 2015(2): 1-6, 170.
|
|
|
|
| [2] |
王凤格, 杨扬, 易红梅, 赵久然, 任洁, 王璐, 葛建镕, 江彬, 张宪晨, 田红丽, 侯振华. 中国玉米审定品种标准SSR指纹库的构建. 中国农业科学, 2017, 50(1): 1-14. doi:10.3864/j.issn.0578-1752.2017.01.001.
|
|
|
|
| [3] |
王凤格, 易红梅, 赵久然, 刘平, 张新明, 田红丽, 堵苑苑. 玉米品种鉴定技术规程SSR标记法: NY/T 1432-2014. 北京: 中国农业出版社, 2014.
|
|
|
|
| [4] |
刘丽华, 刘阳娜, 张明明, 李宏博, 庞斌双, 赵昌平. 我国75份小麦品种SNP和SSR指纹图谱构建与比较分析. 中国农业科技导报, 2020, 22(5): 15-23.
doi: 10.13304/j.nykjdb.2019.1023 |
|
doi: 10.13304/j.nykjdb.2019.1023 |
|
| [5] |
刘丽华, 庞斌双, 刘阳娜, 邱军, 李宏博, 张欣, 王娜, 赵昌平. 2009-2014年国家冬小麦区域试验品系的遗传多样性及群体结构分析. 麦类作物学报, 2016, 36(2): 165-171.
|
|
|
|
| [6] |
刘丽华, 庞斌双, 李宏博, 刘阳娜, 福德平, 王娜, 赵昌平. 2009-2015年北京市冬小麦区域试验品系的DNA指纹分析. 作物杂志, 2016(5): 13-18.
|
|
|
|
| [7] |
赵昌平, 支巨振, 邱军, 庞斌双, 刘丽华, 王立新. 主要农作物品种真实性SSR分子标记检测普通小麦: NY/T 2859-2015. 北京: 中国农业出版社, 2015.
|
|
|
|
| [8] |
林亦霞, 王梓辛, 刘欢, 王征, 梁满中, 戴小军, 陈良碧. 基于NYT 1433-2014中48对SSR引物的94份杂交稻亲本DNA分子数字指纹库研究. 中国水稻科学, 2016, 30(6): 593-602.
doi: 10.16819/j.1001-7216.2016.6028 |
|
doi: 10.16819/j.1001-7216.2016.6028 |
|
| [9] |
徐群, 魏兴华, 庄杰云, 吕波, 袁筱萍, 刘平, 张新明, 余汉勇, 堵苑苑. 水稻品种鉴定技术规程SSR标记法: NY/T 1433-2014. 北京: 中国农业出版社, 2014.
|
|
|
|
| [10] |
程本义, 吴伟, 夏俊辉, 刘鑫, 庄杰云, 杨仕华. 浙江省水稻品种DNA指纹数据库的初步构建及其应用. 浙江农业学报, 2009, 21(6): 555-560.
|
|
|
|
| [11] |
doi: 10.1007/s11032-008-9240-0 |
| [12] |
doi: 10.1038/s41598-020-62518-6 pmid: 32221398 |
| [13] |
doi: 10.3724/SP.J.1006.2018.00315 |
| [14] |
doi: 10.1007/s11032-019-1051-y |
| [15] |
doi: 10.1186/s12870-019-2122-2 pmid: 31870303 |
| [16] |
doi: 10.1007/s10681-010-0191-2 |
| [17] |
|
| [18] |
doi: 10.1038/ng.2371 |
| [19] |
doi: 10.1038/ng.2987 |
| [20] |
doi: 10.1038/nbt.3207 |
| [21] |
匡猛, 杨伟华, 许红霞, 王延琴, 周大云, 冯新爱. 中国棉花主栽品种DNA指纹图谱构建及SSR标记遗传多样性分析. 中国农业科学, 2011, 44(1): 20-27. doi: 10.3864/j.issn.0578-1752.2011.01.003.
|
|
|
|
| [22] |
doi: 10.1007/s10722-023-01575-y |
| [23] |
pmid: 16939008 |
| [24] |
贾子昉, 王清连, 董娜. 陆地棉种质资源的表型及SSR遗传多样性分析. 生物技术通讯, 2019, 30(5): 653-661.
|
|
|
|
| [25] |
郭志军, 赵云雷, 陈伟, 李运海, 王红梅, 龚海燕, 桑晓慧. 陆地棉SSR标记遗传多样性及其与农艺性状的关联分析. 棉花学报, 2014, 26(5): 420-430.
doi: 10.11963/cs140506 |
|
|
|
| [26] |
doi: 10.1111/jipb.12723 |
| [27] |
doi: 10.1186/s12870-017-0981-y |
| [28] |
doi: 10.2135/cropsci2009.09.0551 |
| [29] |
doi: 10.1038/ng.3887 |
| [30] |
doi: 10.1038/s41588-021-00844-9 |
| [31] |
匡猛, 晋芳, 吴玉珍, 金石桥, 彭军, 黄龙雨, 何团结, 魏守军, 周大云, 王延琴, 黄义文, 郑曙峰. 棉花品种真实性鉴定SSR分子标记法: NY/T 2634-2022. 北京: 中国农业出版社, 2023.
|
|
|
|
| [32] |
匡猛, 杨伟华, 许红霞, 王延琴, 周大云, 冯新爱. 单粒棉花种子DNA快速提取方法. 分子植物育种, 2010, 8(4): 827-831.
|
|
|
|
| [33] |
doi: 10.1093/bioinformatics/bti282 pmid: 15705655 |
| [34] |
|
| [35] |
doi: 10.1111/j.1365-294X.2005.02553.x pmid: 15969739 |
| [36] |
doi: 10.1093/bioinformatics/btr330 pmid: 21653522 |
| [37] |
doi: 10.1186/s42397-020-00066-0 |
| [38] |
doi: 10.1007/s11032-015-0335-0 |
| [39] |
刘丽华, 庞斌双, 刘阳娜, 李宏博, 王娜, 王拯, 赵昌平. 基于SNP标记的小麦高通量身份鉴定模式. 麦类作物学报, 2018, 38(5): 529-534.
|
|
|
|
| [40] |
doi: 10.1111/pbi.13241 pmid: 31465620 |
| [41] |
doi: 10.1016/S2095-3119(15)61226-6 |
| [42] |
|
| [43] |
张曼, 支巨振, 牛庆杰, 赵建忠, 晋芳, 刘丰泽, 孙墨可, 李慧英, 任雪贞, 田娟, 董玉迪, 张雷, 于学鹏, 王祉诺, 谭丽萍, 黄绪堂, 于海峰, 刘胜利. 向日葵品种真实性鉴定SSR分子标记法: NY/T 3752-2020. 北京: 中国农业出版社, 2020.
|
|
|
|
| [44] |
doi: 10.1038/s41588-018-0119-7 pmid: 29736016 |
| [45] |
刘峰, 冯雪梅, 钟文, 刘玉栋, 阴祖军, 韩秀兰, 徐子初, 沈法富. 适合棉花品种鉴定的SSR核心引物的筛选. 分子植物育种, 2009, 7(6): 1160-1168.
|
|
|
|
| [46] |
匡猛, 杨伟华, 许红霞, 王延琴, 周大云, 冯新爱, 张玉翠, 王飞, 苏畅. 中国棉花主栽品种DNA指纹数据库初步构建研究. 棉花学报, 2012, 24(3): 229-237.
doi: 10.11963/cs120306 |
|
|
|
| [47] |
王欣怡, 艾先涛, 王俊铎, 梁亚军, 龚照龙, 郑巨云, 郭江平, 买买提·莫明, 李雪源. 利用SSR快速鉴定棉花品种真实性和纯度. 作物学报, 2017, 43(10): 1565-1572.
|
|
doi: 10.3724/SP.J.1006.2017.01565 |
|
| [48] |
别墅, 孔繁玲, 周有耀, 张光梅, 张群远, 王孝纲. 中国3大主产棉区棉花品种遗传多样性的RAPD及其与农艺性状关系的研究. 中国农业科学, 2001, 34(6): 597-603. doi:10.3321/j.issn:0578-1752.2001.06.004.
|
|
|
|
| [49] |
刘文欣, 孔繁玲, 郭志丽, 张群远, 彭惠茹, 付小琼, 杨付新. 建国以来我国棉花品种遗传基础的分子标记分析. 遗传学报, 2003, 30(6): 560-570.
|
|
|
| [1] | 郭磊, 黄晨艳, 宋宏峰, 沈志军, 张斌斌, 马瑞娟, 孙朦, 何鑫, 俞明亮. 桃苗圃适用除草剂的筛选、混配与安全性评价[J]. 中国农业科学, 2024, 57(9): 1734-1747. |
| [2] | 雷建峰, 尤扬子, 张锦恩, 代培红, 于莉, 杜正阳, 李月, 刘晓东. 靶向敲除棉花GhAGL16高效sgRNA的筛选[J]. 中国农业科学, 2024, 57(6): 1023-1033. |
| [3] | 张永莉, 张宁, 徐姣, 许豆豆, 成芳, 张成龙, 吴碧波, 巩养仓, 贺云新, 魏尚职, 屠小菊, 刘爱玉, 周仲华. 不同带状间作模式对棉花生长发育和生产力的影响[J]. 中国农业科学, 2024, 57(22): 4444-4458. |
| [4] | 戎亚思, 李丰, 张鹏钰, 王东勇, 苏小雨, 田媛, 高桐梅. 基于主成分-聚类分析芝麻盛花期耐高温评价及品种筛选[J]. 中国农业科学, 2024, 57(20): 3957-3973. |
| [5] | 何静, 王振华, 刘健, 马占利, 温越. 灌溉水温与施氮量对滴灌棉田土壤水热及棉花生长和产量的影响[J]. 中国农业科学, 2024, 57(2): 319-335. |
| [6] | 王小军, 王金兰, 琚泽亮, 梁国玲, 贾志锋, 刘文辉, 马祥, 马金秀, 李文. 环青海湖地区不同饲用燕麦品种生产性能和营养品质综合评价[J]. 中国农业科学, 2024, 57(19): 3730-3742. |
| [7] | 周罕觅, 马林爽, 孙旗立, 陈佳庚, 李纪琛, 苏裕民, 陈诚, 吴奇. 基于多目标综合评价的苹果水氮综合调控[J]. 中国农业科学, 2024, 57(18): 3654-3670. |
| [8] | 李玉姗, 肖菁, 马越, 田超, 赵连佳, 王帆, 宋羽, 蒋程瑶. 169份番茄种质资源表型性状遗传多样性分析及综合评价[J]. 中国农业科学, 2024, 57(18): 3671-3683. |
| [9] | 翟彩娇, 葛礼姣, 程玉静, 仇亮, 王小秋, 刘水东. 基于表型性状与SSR标记的冬瓜、节瓜种质资源遗传多样性分析[J]. 中国农业科学, 2024, 57(17): 3440-3457. |
| [10] | 白冰楠, 乔丹, 葛群, 栾玉娟, 刘小芳, 卢全伟, 牛皓, 龚举武, 巩万奎, ELAMEER ELSAMMAN, 闫浩亮, 李俊文, 刘爱英, 石玉真, 王海泽, 袁有禄. 陆地棉棉籽相关性状的QTN挖掘及候选基因筛选[J]. 中国农业科学, 2024, 57(15): 2901-2913. |
| [11] | 赵卫松, 郭庆港, 崔钠淇, 鹿秀云, 李社增, 马平. 外源添加L-脯氨酸对棉花黄萎病发生及其根际土壤微生物群落的影响[J]. 中国农业科学, 2024, 57(11): 2143-2160. |
| [12] | 娄慧, 朱金成, 韩泽刚, 张薇. 尖镰孢5-氧脯氨酸酶基因的鉴定及功能分析[J]. 中国农业科学, 2024, 57(10): 1915-1929. |
| [13] | 宋想, 王钟曼, 张秋玲, 魏媛媛, 赵小刚, 刘波, 戴思兰. 早花露地小菊杂交后代株系的综合评价与筛选[J]. 中国农业科学, 2024, 57(1): 173-189. |
| [14] | 石浩磊, 曹红霞, 张伟杰, 朱珊, 何子建, 张泽. 基于无人机多光谱的棉花多生育期叶面积指数反演[J]. 中国农业科学, 2024, 57(1): 80-95. |
| [15] | 阚家强, 刘玉, 周治国, 陈兵林, 赵文青, 胡伟, 胡少鸿, 陈阳, 王友华. 蕾铃脱落对棉花果枝叶光合产物积累及“源”潜力的影响[J]. 中国农业科学, 2023, 56(9): 1658-1669. |
|
||