


中国农业科学 ›› 2024, Vol. 57 ›› Issue (1): 80-95.doi: 10.3864/j.issn.0578-1752.2024.01.007
石浩磊1( ), 曹红霞1(), 张伟杰1, 朱珊1, 何子建1, 张泽2
收稿日期:2023-07-05
接受日期:2023-08-23
出版日期:2024-01-01
发布日期:2024-01-10
通信作者:
联系方式:
石浩磊,E-mail:shl991118@163.com。
基金资助:
SHI HaoLei1(), CAO HongXia1(), ZHANG WeiJie1, ZHU Shan1, HE ZiJian1, ZHANG Ze2
Received:2023-07-05
Accepted:2023-08-23
Published:2024-01-01
Online:2024-01-10
摘要:
【目的】叶面积指数(leaf area index,LAI)是表征作物长势、光合、蒸腾的重要指标。论文旨在研究不同生育期、多生育期无人机多光谱数据棉花LAI估测模型,明确不同生育期间棉花LAI估测模型变化规律,为实时掌握棉花长势并因地制宜进行田间科学管理提供依据。【方法】利用大疆精灵4多光谱无人机获取棉花现蕾期、初花期、结铃期、吐絮期多光谱图像和RGB图像。选用归一化差植被指数(NDVI)、绿度归一化差植被指数(GNDVI)、归一化差红边指数(NDRE)、叶片叶绿素指数(LCI)、优化的土壤调节植被指数(OSAVI)5种多光谱指数和修正红绿植被指数(MGRVI)、红绿植被指数(GRVI)、绿叶指数(GLA)、超红指数(EXR)、大气阻抗植被指数(VARI)5种颜色指数分别建立棉花各生育期及棉花生长多生育期数据集合,结合打孔法获取地面LAI实测数据,使用机器学习算法中偏最小二乘(PLSR)、岭回归(RR)、随机森林(RF)、支持向量机(SVM)、神经网络(BP)构建棉花LAI预测模型。【结果】覆膜棉花LAI随着生育期的变化呈现先增长后下降的趋势,现蕾期、初花期、结铃期内侧棉花叶面积指数均值均显著大于外侧(P<0.05);选择的指数在各时期彼此间均呈显著相关(P<0.05),总体而言,多光谱指数与颜色指数间的相关性随着生育期的进行而呈现下降趋势,选择的指数在各时期均与棉花LAI相关性显著(P<0.05),多光谱指数相关系数介于0.35—0.85,颜色指数相关系数介于0.49—0.71,相关系数绝对值较大的指数多为多光谱指数,颜色指数与棉花LAI的相关系数绝对值较小;估测模型性能结果显示棉花各生育期模型中多光谱指数优于颜色指数,且各指数模型预测性能随着生育期的变化呈现一定规律性,NDVI是预测棉花LAI的最优指数。从模型结果上看,RF模型和BP模型在各生育期下获得了较高的估计精度。初花期LAI反演模型精度最高,最优模型验证集R2为0.809,MAE为0.288,NRMSE为0.120。多生育期最优模型验证集R2为0.386,MAE为0.700,NRMSE为0.198。【结论】棉花内外侧LAI在现蕾期、初花期、结铃期存在显著差异。在各生育期中,RF和BP模型是预测棉花LAI较优模型。NDVI在各指数中表现最好,是预测棉花LAI的最优指数。多生育期模型效果较单生育期明显下降,最优指数为GNDVI,最优模型为BP。本研究中预测棉花LAI的最优窗口期是初花期。研究结果可为无人机遥感监测棉花LAI提供理论依据和技术支持。
石浩磊, 曹红霞, 张伟杰, 朱珊, 何子建, 张泽. 基于无人机多光谱的棉花多生育期叶面积指数反演[J]. 中国农业科学, 2024, 57(1): 80-95.
SHI HaoLei, CAO HongXia, ZHANG WeiJie, ZHU Shan, HE ZiJian, ZHANG Ze. Leaf Area Index Inversion of Cotton Based on Drone Multi-Spectral and Multiple Growth Stages[J]. Scientia Agricultura Sinica, 2024, 57(1): 80-95.
图1
试验地概况"

表1
试验1处理设计"
| 试验1 Test 1 | 灌水量Irrigation amount | 异次地表地下交替滴灌开始时间 Start time of alternative surface/subsurface drip irrigation | |
|---|---|---|---|
| 苗期、现蕾期、初花期的第1次灌水(淋洗水量+灌溉水量) The first irrigation at seedling stage, budding stage and initial flowering stage (Leaching water+Irrigation water) | 其他生育阶段 Other growth stages | ||
| W1Z1 | 40 mm+80% ETC | 80% ETC | 苗期Seedling stage |
| W1Z2 | 40 mm+80% ETC | 80% ETC | 现蕾期Budding stage |
| W1Z3 | 40 mm+80% ETC | 80% ETC | 初花期Initial flowering stage |
| W2Z1 | 80 mm+80% ETC | 80% ETC | 苗期Seedling stage |
| W2Z2 | 80 mm+80% ETC | 80% ETC | 现蕾期Budding stage |
| W2Z3 | 80 mm+80% ETC | 80% ETC | 初花期Initial flowering stage |
| W3Z1 | 120 mm+80% ETC | 80% ETC | 苗期Seedling stage |
| W3Z2 | 120 mm+80% ETC | 80% ETC | 现蕾期Budding stage |
| W3Z3 | 120 mm+80% ETC | 80% ETC | 初花期Initial flowering stage |
表2
试验2处理设计"
| 试验2 Test 2 | 灌水量Irrigation amount | 地表、地下滴灌水量分配(地表滴灌+地下滴灌) Surface and subsurface drip irrigation water distribution (Surface drip irrigation+Subsurface drip irrigation) | |
|---|---|---|---|
| 苗期、现蕾期、初花期的第1次灌水(淋洗水量+灌溉水量) The first irrigation at seedling stage, budding stage and initial flowering stage (Leaching water+Irrigation water) | 其他生育阶段 Other growth stages | ||
| W1F1 | 40 mm+80% ETC | 80% ETC | 100%+0 |
| W1F2 | 40 mm+80% ETC | 80% ETC | 75%+25% |
| W1F3 | 40 mm+80% ETC | 80% ETC | 50% +50% |
| W1F4 | 40 mm+80% ETC | 80% ETC | 25%+75% |
| W1F5 | 40 mm+80% ETC | 80% ETC | 0+100% |
| W2F1 | 80 mm+80% ETC | 80% ETC | 100%+0 |
| W2F2 | 80 mm+80% ETC | 80% ETC | 75%+25% |
| W2F3 | 80 mm+80% ETC | 80% ETC | 50%+50% |
| W2F4 | 80 mm+80% ETC | 80% ETC | 25%+75% |
| W2F5 | 80 mm+80% ETC | 80% ETC | 0+100% |
| W3F1 | 120 mm+80% ETC | 80% ETC | 100%+0 |
| W3F2 | 120 mm+80% ETC | 80% ETC | 75%+25% |
| W3F3 | 120 mm+80% ETC | 80% ETC | 50%+50% |
| W3F4 | 120 mm+80% ETC | 80% ETC | 25%+75% |
| W3F5 | 120 mm+80% ETC | 80% ETC | 0+100% |
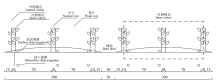
图2
小区种植示意图"
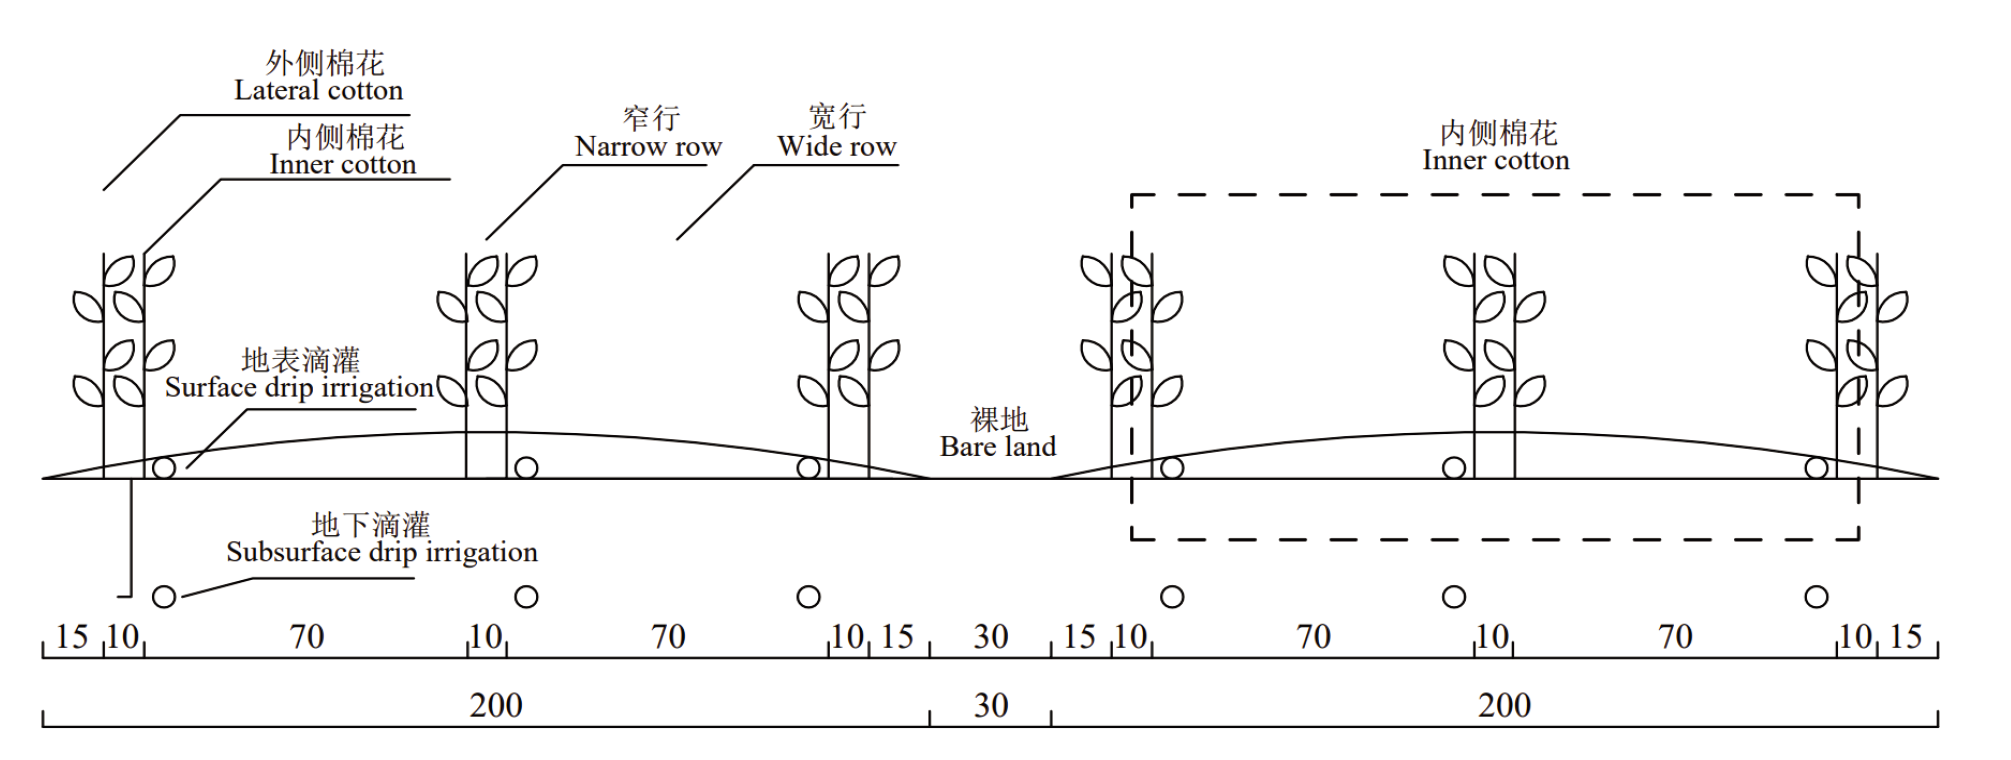
表3
试验数据采集时间表"
| 棉花生育期划分 Classification of cotton growth stage | 无人机数据采集时间 UAV data collection time | 棉花生长指标数据采集时间 Cotton growth indicator data collection time |
|---|---|---|
| 现蕾期Budding stage | 2021-06-17 | 2021-06-17 |
| 初花期Initial flowering stage | 2021-07-19 | 2021-07-19 |
| 结铃期Boll setting stage | 2021-08-12 | 2021-08-12 |
| 吐絮期Open-boll stage | 2021-09-07 | 2021-09-07 |
表4
相关指数计算"
| 相关指数 Correlation index | 计算公式 Formula | 参考文献 Reference | |
|---|---|---|---|
| 多光谱指数 Multi-spectral index | 归一化差植被指数 Normalized difference vegetation index (NDVI) | $ \mathrm{NDVI}=\frac{\mathrm{NIR}-\mathrm{Red}}{\mathrm{NIR}+\mathrm{Red}} $ | [ |
| 绿度归一化差植被指数 Normalized green difference vegetation index (GNDVI) | $\text{GNDVI}=\frac{\text{NIR-Green}}{\text{NIR}+\text{Green}}$ | [ | |
| 归一化差红边指数 Normalized difference red-edge vegetation index (NDRE) | $ \text { NDRE }=\frac{\text { NIR-RedEdge }}{\text { NIR }+ \text { RedEdge }} $ | [ | |
| 叶片叶绿素指数 Leaf chlorophyll index (LCI) | $ \mathrm{LCI}=\frac{\text { NIR-RedEdge }}{\text { NIR }+ \text { Red }} $ | [ | |
| 优化的土壤调节植被指数 Optimized soil adjusted vegetation index (OSAVI) | $ \text { OSAVI }=\frac{\mathrm{NIR}-\mathrm{Red}}{\mathrm{NIR}+\operatorname{Red}+0.16} $ | [ | |
| 颜色指数 Color index | 修正红绿植被指数 Modified green-red vegetation index (MGRVI) | $ \text { MGRVI }=\frac{g^{2}-r^{2}}{g^{2}+r^{2}} $ | [ |
| 红绿植被指数 Green-red vegetation index (GRVI) | $ \text { GRVI }=\frac{g-r}{g+r} $ | [ | |
| 绿叶指数 Green leaf algorithm (GLA) | $\text{GLA}=\frac{\text{2g-r}+\text{b}}{\text{2g}+\text{r}+\text{b}}$ | [ | |
| 超红指数 Excess red index (EXR) | EXR=1.4r-g | [ | |
| 大气阻抗植被指数 Visible atmospherically resistant vegetation index (VARI) | $ \mathrm{VARI}=\frac{\mathrm{g}-\mathrm{r}}{\mathrm{g}+\mathrm{r}-\mathrm{b}} $ | [ | |
表5
采样点LAI分析"
| 生育期 Growth stage | 采样点 Sampling point | 样本数 Number of samples | 均值 Mean value | 方差 Variance | 变异系数 Variability coefficient (%) | 显著性分析 Significance analysis |
|---|---|---|---|---|---|---|
| 现蕾期 Budding stage | 内侧Inner | 18 | 2.71 | 0.47 | 17.51 | P<0.05 |
| 外侧Lateral | 18 | 2.20 | 0.57 | 25.73 | ||
| 初花期 Initial flowering stage | 内侧Inner | 24 | 4.79 | 0.94 | 19.72 | P<0.05 |
| 外侧Lateral | 24 | 3.79 | 0.80 | 21.09 | ||
| 结铃期 Boll setting stage | 内侧Inner | 18 | 4.27 | 1.02 | 23.80 | P<0.05 |
| 外侧Lateral | 18 | 3.51 | 0.81 | 23.19 | ||
| 吐絮期 Open-boll stage | 内侧Inner | 24 | 3.71 | 0.80 | 21.45 | 0.05<P<0.1 |
| 外侧Lateral | 24 | 3.29 | 0.75 | 22.87 |

图3
各生育期及多生育期数据集合相关指数间以及各指数与棉花LAI相关系数热图 A:现蕾期Budding stage;B:初花期Initial flowering stage;C:结铃期Boll setting stage;D:吐絮期Open-boll stage;E:多生育期Multiple growth stages。图4、图5同The same as Fig. 4, Fig. 5"
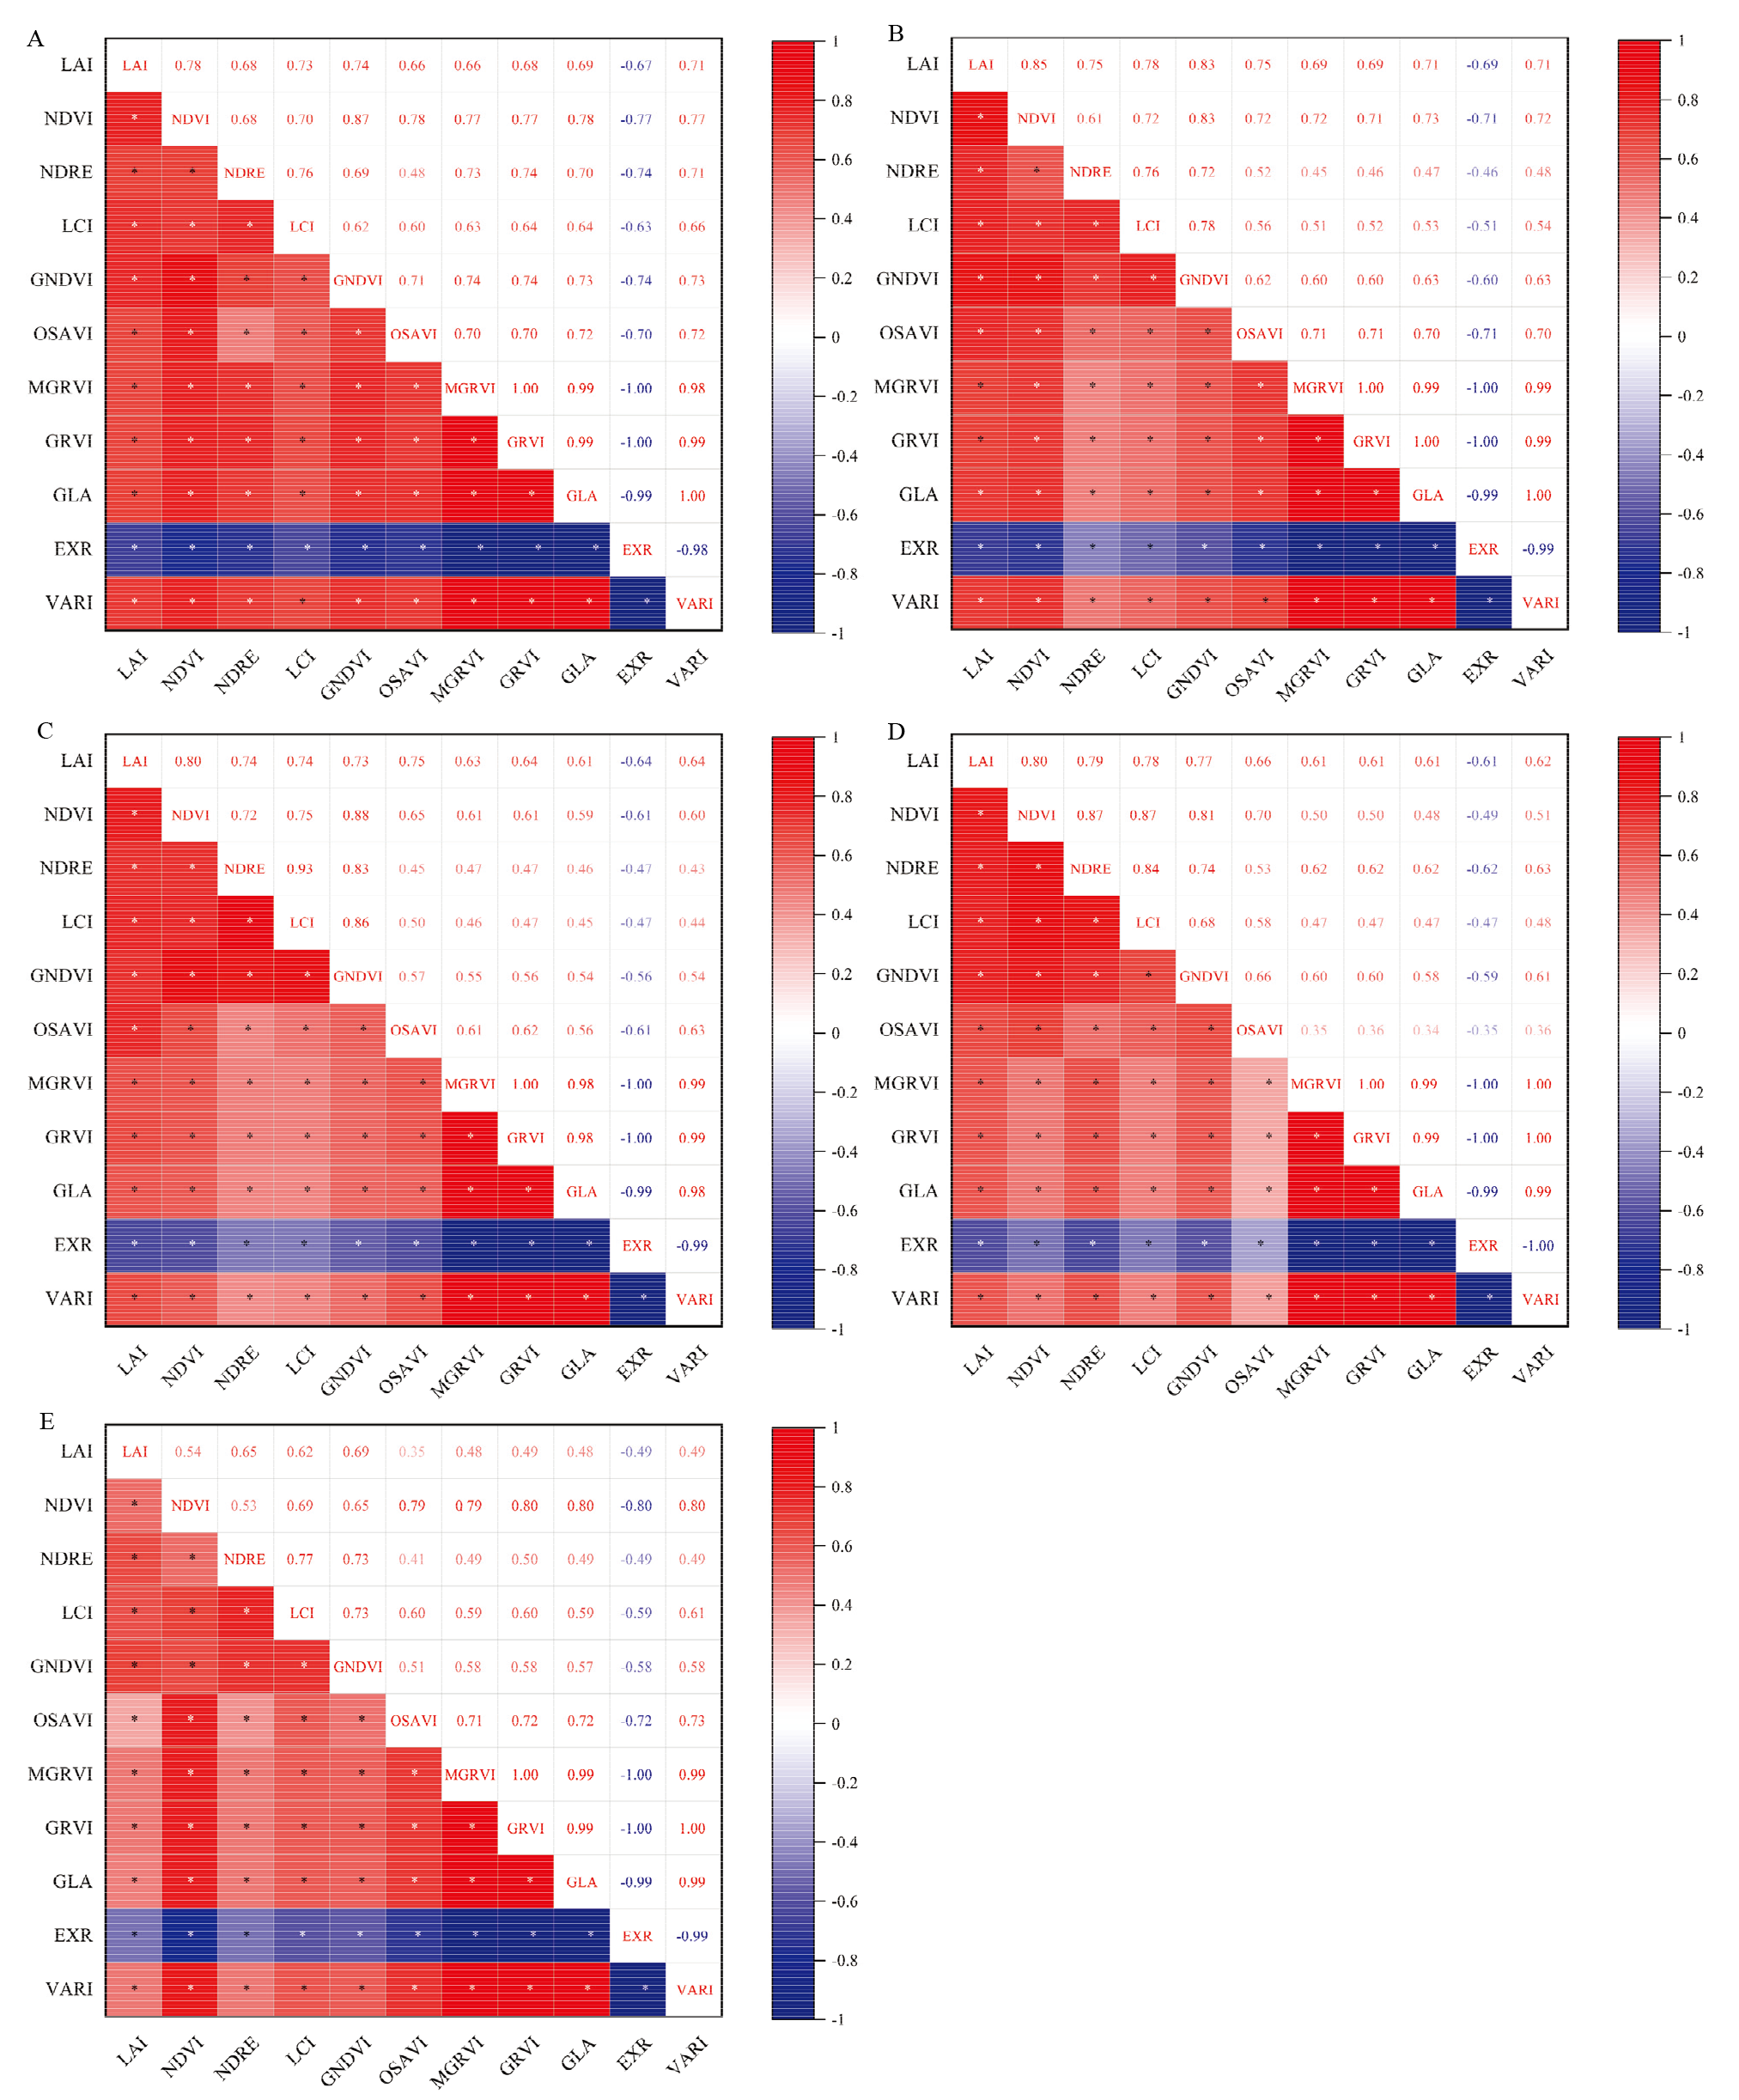
图4
各生育期及多生育期数据集合模型性能变化图"
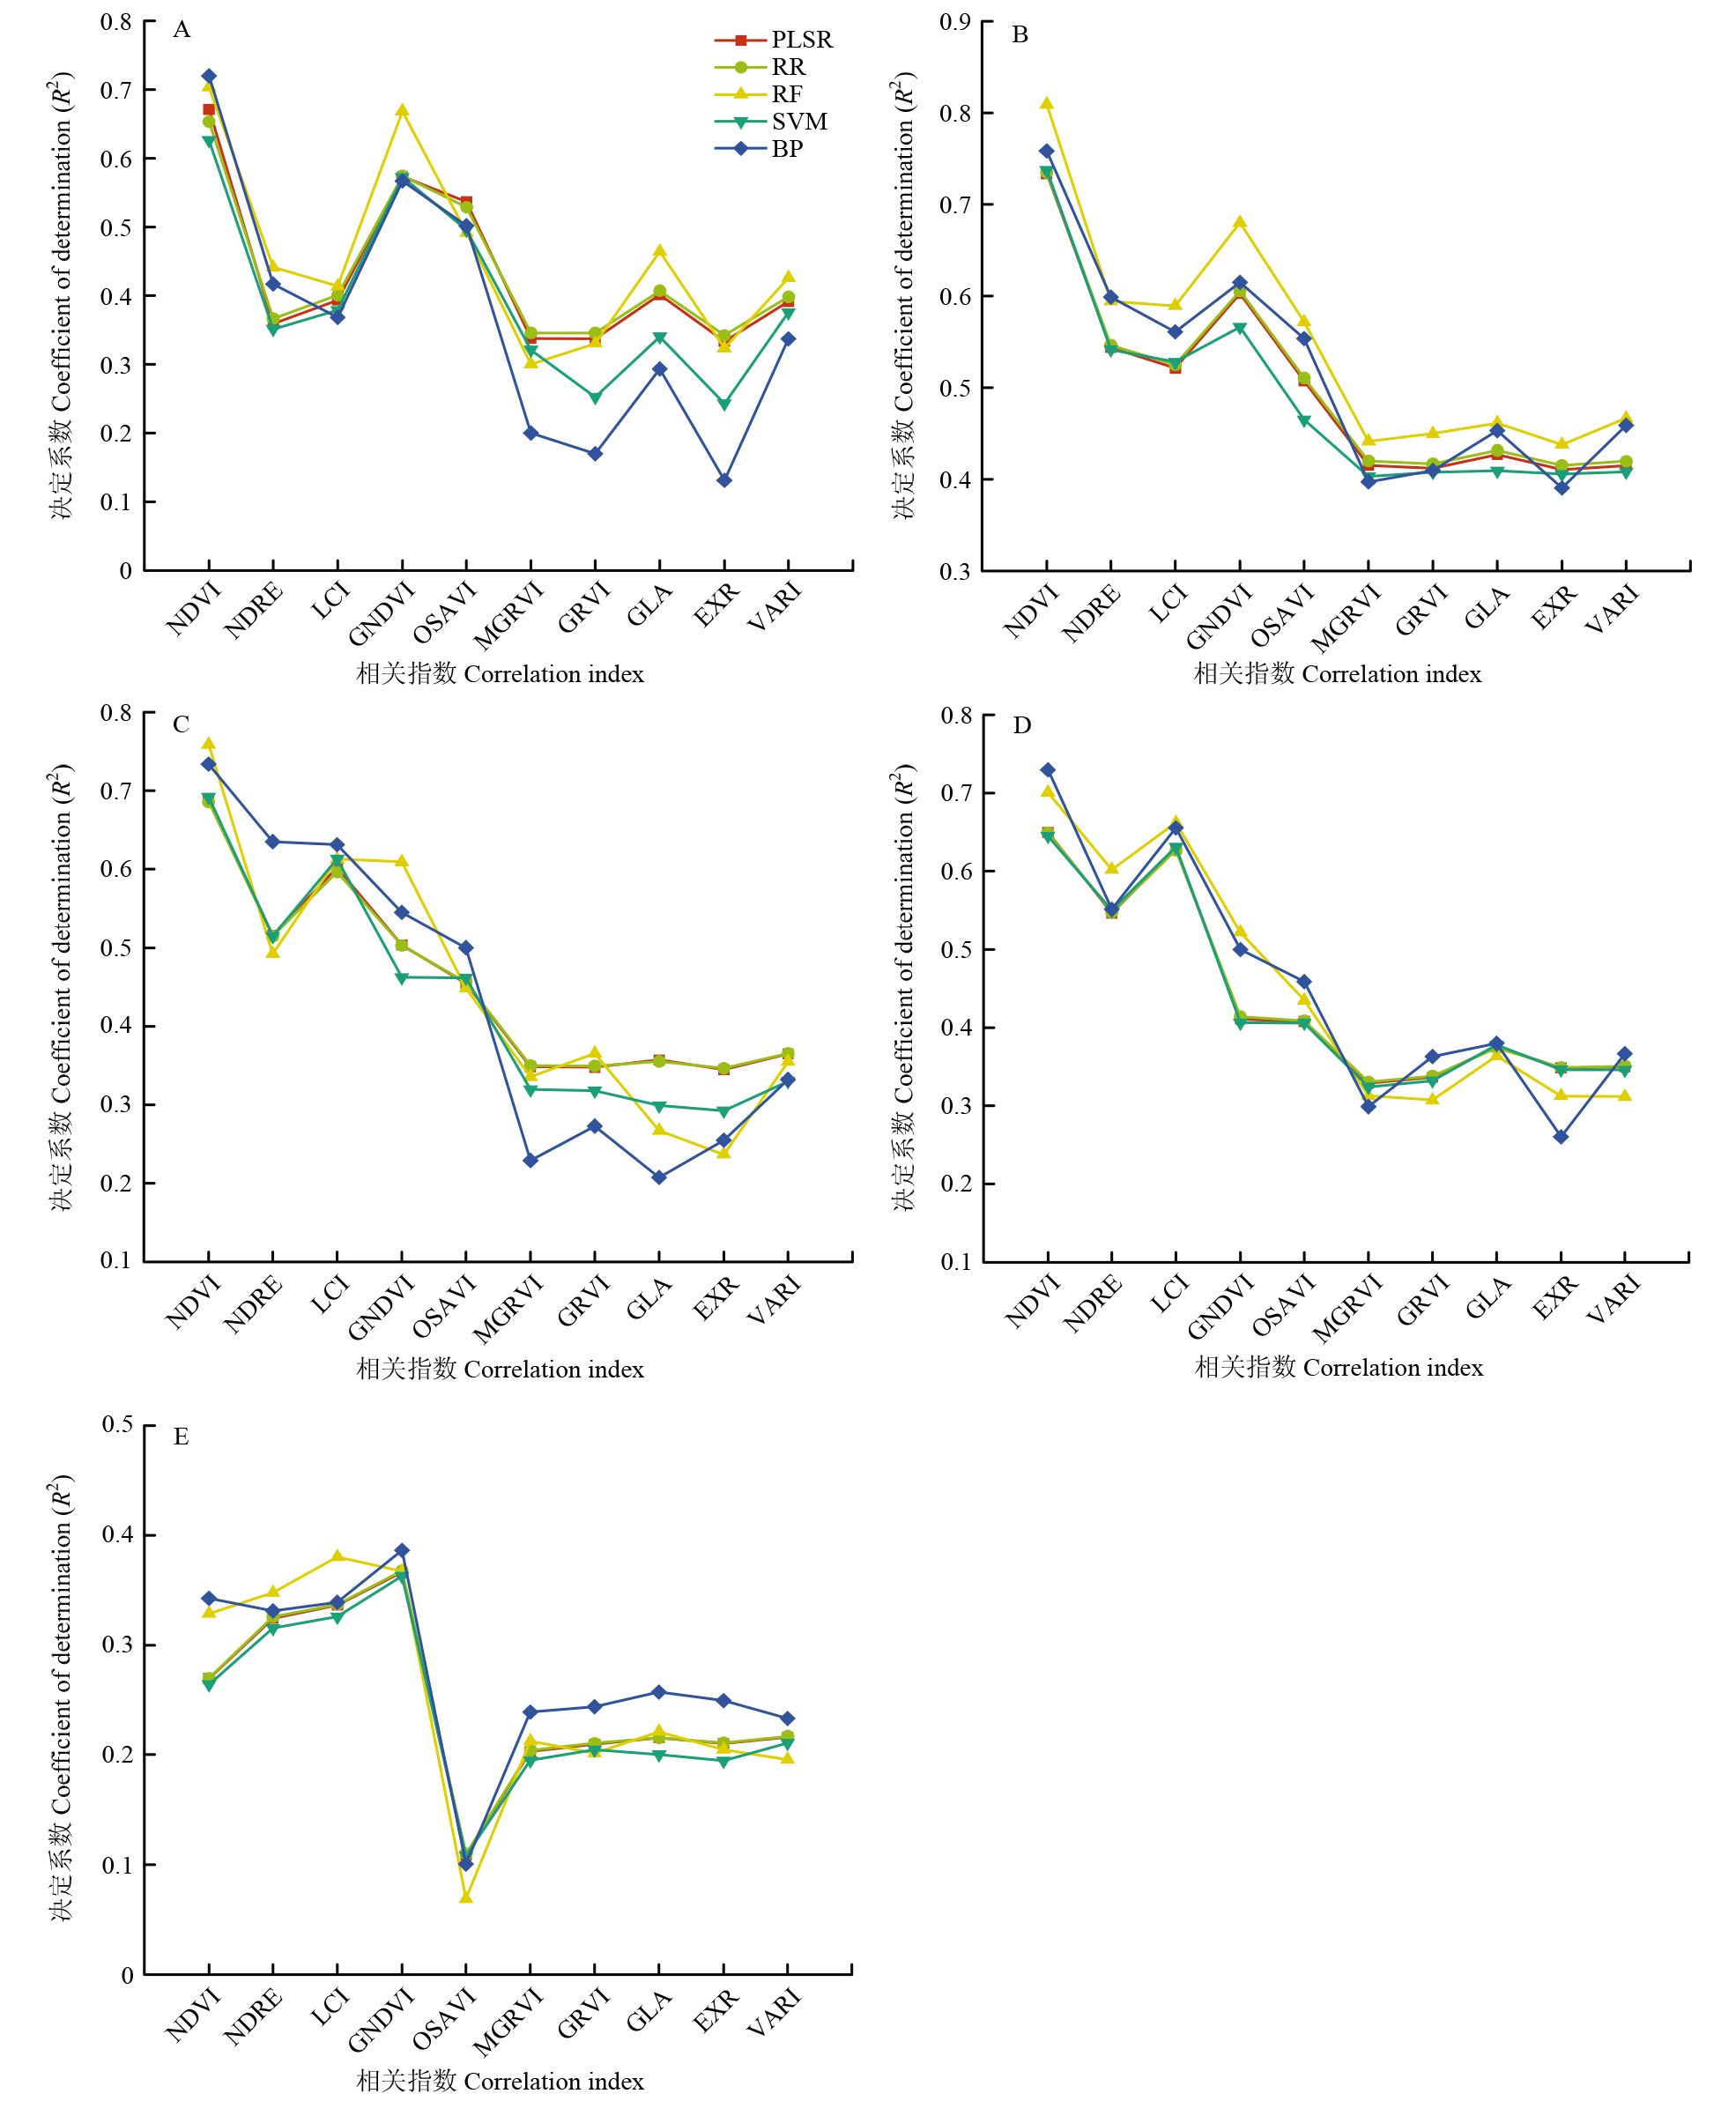
表6
各生育期和多生育期最优模型"
| 生育期 Growing stage | 最优指数 Optimal index | 最优模型 Optimal model | 训练集Training set | 验证集Validation set | ||||
|---|---|---|---|---|---|---|---|---|
| R2 | MAE | NRMSE | R2 | MAE | NRMSE | |||
| 现蕾期Budding stage | NDVI | BP | 0.708 | 0.276 | 0.101 | 0.720 | 0.239 | 0.163 |
| 初花期Initial flowering stage | NDVI | RF | 0.841 | 0.338 | 0.167 | 0.809 | 0.288 | 0.120 |
| 结铃期Boll setting stage | NDVI | RF | 0.811 | 0.375 | 0.180 | 0.746 | 0.398 | 0.147 |
| 吐絮期Open-boll stage | NDVI | BP | 0.682 | 0.361 | 0.200 | 0.730 | 0.371 | 0.180 |
| 多生育期Multiple growth stages | GNDVI | BP | 0.549 | 0.565 | 0.549 | 0.386 | 0.700 | 0.198 |

图5
各生育期及多生育期数据集合最优模型散点图"

| [1] |
邓金剑. 美国限制进口新疆棉花: 供应链与产业链之争. 国际经济合作, 2021(5): 79-89.
|
|
|
|
| [2] |
马新明, 张娟娟, 席磊, 刘合兵, 高项飞. 基于叶面积指数(LAI)的小麦变量施氮模型研究. 农业工程学报, 2008, 24(2): 22-26.
|
|
|
|
| [3] |
鱼欢, 杨改河, 王之杰. 不同施氮量及基追比例对玉米冠层生理性状和产量的影响. 植物营养与肥料学报, 2010, 16(2): 266-273.
|
|
|
|
| [4] |
吕丽华, 陶洪斌, 夏来坤, 张雅杰, 赵明, 赵久然, 王璞. 不同种植密度下的夏玉米冠层结构及光合特性. 作物学报, 2008, 34(3): 447-455.
|
|
doi: 10.3724/SP.J.1006.2008.00447 |
|
| [5] |
王健, 蔡焕杰, 陈凤, 陈新民. 夏玉米田蒸发蒸腾量与棵间蒸发的试验研究. 水利学报, 2004(11): 108-113.
|
|
|
|
| [6] |
doi: 10.1016/j.rse.2011.08.010 |
| [7] |
吴伟斌, 洪添胜, 王锡平, 彭万喜, 李震, 张文昭. 叶面积指数地面测量方法的研究进展. 华中农业大学学报, 2007, 26(2): 270-275.
|
|
|
|
| [8] |
doi: 10.1016/j.compag.2008.05.022 |
| [9] |
贾玉秋, 李冰, 程永政, 刘婷, 郭燕, 武喜红, 王来刚. 基于GF-1与Landsat-8多光谱遥感影像的玉米LAI反演比较. 农业工程学报, 2015, 31(9): 173-179.
|
|
|
|
| [10] |
doi: 10.1016/j.jag.2021.102519 |
| [11] |
doi: 10.1016/j.agrformet.2023.109357 |
| [12] |
doi: 10.3389/fpls.2023.1158837 |
| [13] |
doi: 10.3390/su11236829 |
| [14] |
doi: 10.1016/j.fcr.2022.108582 |
| [15] |
doi: 10.3390/rs15061597 |
| [16] |
冯文斌. 基于无人机多光谱遥感的夏玉米长势监测及产量估测[D]. 泰安: 山东农业大学, 2022.
|
|
|
|
| [17] |
刘帅兵, 金秀良, 冯海宽, 聂臣巍, 白怡, 余汛. 基于无人机多源遥感的玉米LAI垂直分布估算. 农业机械学报, 2023, 54(5): 181-193, 287.
|
|
|
|
| [18] |
罗小波, 谢天授, 董圣贤. 基于无人机多光谱影像的柑橘冠层叶绿素含量反演. 农业机械学报, 2023, 54(4): 198-205.
|
|
|
|
| [19] |
聂松伟. 基于无人机多光谱遥感的冬小麦长势指标监测[D]. 乌鲁木齐: 新疆农业大学, 2022.
|
|
|
|
| [20] |
张佑铭. 基于多源遥感数据的猕猴桃园LAI反演研究[D]. 杨凌: 西北农林科技大学, 2022.
|
|
|
|
| [21] |
陶惠林, 冯海宽, 杨贵军, 杨小冬, 刘明星, 刘帅兵. 基于无人机成像高光谱影像的冬小麦LAI估测. 农业机械学报, 2020, 51(1): 176-187.
|
|
|
|
| [22] |
曹中盛, 李艳大, 黄俊宝, 叶春, 孙滨峰, 舒时富, 朱艳, 何勇. 基于无人机数码影像的水稻叶面积指数监测. 中国水稻科学, 2022, 36(3): 308-317.
doi: 10.16819/j.1001-7216.2022.210712 |
|
doi: 10.16819/j.1001-7216.2022.210712 |
|
| [23] |
付虹雨, 王薇, 卢建宁, 岳云开, 崔国贤, 佘玮. 基于无人机多光谱遥感和机器学习的苎麻理化性状估测. 农业机械学报, 2023, 54(5): 194-200, 347.
|
|
|
|
| [24] |
田明璐, 班松涛, 常庆瑞, 由明明, 罗丹, 王力, 王烁. 基于低空无人机成像光谱仪影像估算棉花叶面积指数. 农业工程学报, 2016, 32(21): 102-108.
|
|
|
|
| [25] |
马怡茹, 吕新, 易翔, 马露露, 祁亚琴, 侯彤瑜, 张泽. 基于机器学习的棉花叶面积指数监测. 农业工程学报, 2021, 37(13): 152-162.
|
|
|
|
| [26] |
韩建文, 冯春晖, 彭杰, 王彦宇, 史舟. 不同分辨率无人机多光谱影像的棉花叶面积指数估测研究. 棉花学报, 2022, 34(4): 338-349.
|
|
|
|
| [27] |
胡清阳, 曹红霞, 何子建, 丁邦新, 张浥. 淋洗定额与覆盖方式对北疆棉花生长和产量的影响. 灌溉排水学报, 2022, 41(5): 27-33.
|
|
|
|
| [28] |
何子建, 史文娟, 杨军强. 膜下滴灌间作盐生植物棉田水盐运移特征及脱盐效果. 农业工程学报, 2017, 33(23): 129-138.
|
|
|
|
| [29] |
doi: 10.1016/S0034-4257(97)00104-1 |
| [30] |
doi: 10.1016/S0176-1617(96)80285-9 |
| [31] |
doi: 10.1007/s11119-006-9011-z |
| [32] |
doi: 10.1081/CSS-120003058 |
| [33] |
doi: 10.1016/S0034-4257(97)00114-4 |
| [34] |
doi: 10.1016/j.jag.2015.02.012 |
| [35] |
|
| [36] |
doi: 10.1016/j.compag.2008.03.009 |
| [37] |
doi: 10.1016/S0034-4257(01)00289-9 |
| [38] |
范军亮, 王涵, 廖振棋, 戴裕珑, 余江, 冯涵龙. 基于纹理-颜色特征与植被指数融合的冬小麦LAI估测. 农业机械学报, 2023, 54(7): 347-359.
|
|
|
|
| [39] |
柴付军, 李光永, 张琼, 程鸿, 李富先, 李旌胜, 季枫. 灌水频率对膜下滴灌土壤水盐分布和棉花生长的影响研究. 灌溉排水学报, 2005, 24(3): 12-15.
|
|
|
|
| [40] |
王允喜, 李明思, 蓝明菊. 膜下滴灌土壤湿润区对田间棉花根系分布及植株生长的影响. 农业工程学报, 2011, 27(8): 31-38.
|
|
|
|
| [41] |
张琼, 李光永, 柴付军. 棉花膜下滴灌条件下灌水频率对土壤水盐分布和棉花生长的影响. 水利学报, 2004(9): 123-126.
|
|
|
|
| [42] |
何嘉晨, 何敬, 王彬, 苟静, 林远杨, 刘刚. 基于无人机高光谱影像的水稻叶绿素含量反演. 四川农业大学学报, doi: 10.16036/j.issn.1000-2650.202205194.
|
|
|
|
| [43] |
董建康, 连懿, 赵之江, 张虎, 冯晨阳. 基于卷积神经网络和特征选择的无人机多光谱影像林地提取方法. 天津师范大学学报(自然科学版), 2022, 42(4): 64-71.
|
|
|
|
| [44] |
苏伟, 王伟, 刘哲, 张明政, 边大红, 崔彦宏, 黄健熙. 无人机影像反演玉米冠层LAI和叶绿素含量的参数确定. 农业工程学报, 2020, 36(19): 58-65.
|
|
|
|
| [45] |
高林, 杨贵军, 王宝山, 于海洋, 徐波, 冯海宽. 基于无人机遥感影像的大豆叶面积指数反演研究. 中国生态农业学报, 2015, 23(7): 868-876.
|
|
|
|
| [46] |
doi: 10.1016/j.compag.2021.106138 |
| [47] |
运彬媛, 张昊, 翟勇全, 马健祯, 姬丽, 李稼润, 金学兰, 贾彪. 基于土壤氮素水平的玉米冠层SPAD值估算方法. 生态学杂志, https://kns.cnki.net/kcms/detail/21.1148.Q.20230510.1735.007.html.
|
|
|
|
| [48] |
闫成川, 曲延英, 陈全家, 武红旗, 张博, 彭海垒, 陈琴. 基于无人机多光谱影像的棉花SPAD值及叶片含水量估测. 农业工程学报, 2023, 39(2): 61-67.
|
|
|
|
| [49] |
张静, 郭思梦, 韩迎春, 雷亚平, 邢芳芳, 杜文丽, 李亚兵, 冯璐. 基于无人机RGB图像的棉花产量估算. 中国农业科技导报, 2022, 24(11): 112-120.
doi: 10.13304/j.nykjdb.2021.0918 |
|
doi: 10.13304/j.nykjdb.2021.0918 |
|
| [50] |
doi: 10.3390/rs14010136 |
| [51] |
张东彦, 韩宣宣, 林芬芳, 杜世州, 张淦, 洪琪. 基于多源无人机影像特征融合的冬小麦LAI估算. 农业工程学报, 2022, 38(9): 171-179.
|
|
|
|
| [52] |
王靖, 彭漪, 刘小娟, 莫佳才, 梁婷. 基于无人机多光谱数据的水稻LAI反演与应用. 中国农业大学学报, 2021, 26(12): 145-156.
|
|
|
|
| [53] |
doi: 10.3390/rs14174272 |
| [54] |
张建华, 冀荣华, 袁雪, 李慧, 祁力钧. 基于径向基支持向量机的棉花虫害识别. 农业机械学报, 2011, 42(8): 178-183.
|
|
|
|
| [55] |
邵亚杰, 汤秋香, 崔建平, 李晓娟, 王亮, 林涛. 融合无人机光谱信息与纹理特征的棉花叶面积指数估测. 农业机械学报, 2023, 54(6): 186-196.
|
|
|
|
| [56] |
向友珍, 安嘉琪, 赵笑, 金琳, 李志军, 张富仓. 基于无人机多光谱遥感的大豆生长参数和产量估算. 农业机械学报, 2023, 54(8): 230-239.
|
|
|
| [1] | 吴玉珍, 黄龙雨, 周大云, 黄义文, 付守阳, 彭军, 匡猛. 中国棉花审定品种SSR指纹库的构建与综合评价[J]. 中国农业科学, 2024, 57(8): 1430-1443. |
| [2] | 周智辉, 谷晓博, 程智楷, 常甜, 赵彤彤, 王玉明, 杜娅丹. 基于影像分割的覆膜玉米叶绿素含量反演[J]. 中国农业科学, 2024, 57(6): 1066-1079. |
| [3] | 雷建峰, 尤扬子, 张锦恩, 代培红, 于莉, 杜正阳, 李月, 刘晓东. 靶向敲除棉花GhAGL16高效sgRNA的筛选[J]. 中国农业科学, 2024, 57(6): 1023-1033. |
| [4] | 张永莉, 张宁, 徐姣, 许豆豆, 成芳, 张成龙, 吴碧波, 巩养仓, 贺云新, 魏尚职, 屠小菊, 刘爱玉, 周仲华. 不同带状间作模式对棉花生长发育和生产力的影响[J]. 中国农业科学, 2024, 57(22): 4444-4458. |
| [5] | 何静, 王振华, 刘健, 马占利, 温越. 灌溉水温与施氮量对滴灌棉田土壤水热及棉花生长和产量的影响[J]. 中国农业科学, 2024, 57(2): 319-335. |
| [6] | 白冰楠, 乔丹, 葛群, 栾玉娟, 刘小芳, 卢全伟, 牛皓, 龚举武, 巩万奎, ELAMEER ELSAMMAN, 闫浩亮, 李俊文, 刘爱英, 石玉真, 王海泽, 袁有禄. 陆地棉棉籽相关性状的QTN挖掘及候选基因筛选[J]. 中国农业科学, 2024, 57(15): 2901-2913. |
| [7] | 郝磊晓, 褚楚, 温佩佩, 彭松悦, 杨卓, 邹慧颖, 樊懿楷, 王海童, 刘文举, 王东薇, 刘维华, 杨俊华, 赵娟, 李委奇, 温万, 周佳敏, 张淑君. 基于中红外光谱的中国荷斯坦牛牛奶中钠钾镁含量预测模型的建立[J]. 中国农业科学, 2024, 57(14): 2862-2873. |
| [8] | 赵卫松, 郭庆港, 崔钠淇, 鹿秀云, 李社增, 马平. 外源添加L-脯氨酸对棉花黄萎病发生及其根际土壤微生物群落的影响[J]. 中国农业科学, 2024, 57(11): 2143-2160. |
| [9] | 娄慧, 朱金成, 韩泽刚, 张薇. 尖镰孢5-氧脯氨酸酶基因的鉴定及功能分析[J]. 中国农业科学, 2024, 57(10): 1915-1929. |
| [10] | 阚家强, 刘玉, 周治国, 陈兵林, 赵文青, 胡伟, 胡少鸿, 陈阳, 王友华. 蕾铃脱落对棉花果枝叶光合产物积累及“源”潜力的影响[J]. 中国农业科学, 2023, 56(9): 1658-1669. |
| [11] | 王宁, 冯克云, 南宏宇, 丛安琪, 张铜会. 水分亏缺下有机无机肥配施比例对棉花水氮利用效率的影响[J]. 中国农业科学, 2023, 56(8): 1531-1546. |
| [12] | 郭燕, 井宇航, 王来刚, 黄竞毅, 贺佳, 冯伟, 郑国清. 基于无人机影像特征的冬小麦植株氮含量预测及模型迁移能力分析[J]. 中国农业科学, 2023, 56(5): 850-865. |
| [13] | 党媛玥, 马建江, 杨书贤, 宋吉坤, 贾冰, 冯盼, 陈全家, 于霁雯. 棉花β-tubulin基因家族的鉴定及其在纤维发育中的表达[J]. 中国农业科学, 2023, 56(23): 4585-4601. |
| [14] | 唐丽媛, 蔡肖, 王海涛, 李兴河, 张素君, 刘存敬, 张建宏. 棉花FLA基因家族的全基因组鉴定及GhFLA05在棉纤维发育中的功能分析[J]. 中国农业科学, 2023, 56(23): 4602-4620. |
| [15] | 臧新山, 王康文, 张先亮, 王雪平, 王军, 梁雨, 裴小雨, 任翔, 吕宇龙, 高宇, 王星星, 彭云玲, 马雄风. 棉花功能基因图位克隆的研究进展[J]. 中国农业科学, 2023, 56(23): 4635-4647. |
|
||