


中国农业科学 ›› 2022, Vol. 55 ›› Issue (22): 4419-4432.doi: 10.3864/j.issn.0578-1752.2022.22.008
秦贞涵( ),王琼,张乃于,金玉文,张淑香()
收稿日期:2021-12-19
接受日期:2022-02-22
出版日期:2022-11-16
发布日期:2022-12-14
通讯作者:
张淑香
作者简介:秦贞涵,E-mail:基金资助:
QIN ZhenHan(),WANG Qiong,ZHANG NaiYu,JIN YuWen,ZHANG ShuXiang()
Received:2021-12-19
Accepted:2022-02-22
Online:2022-11-16
Published:2022-12-14
Contact:
ShuXiang ZHANG
摘要:
【目的】 土壤有效磷(Olsen P)的农学阈值及环境阈值是土壤磷素管理的重要依据,但不同阈值区间磷形态学特征尚不明确。研究黑土有效磷不同阈值区间的磷形态特征及其影响因素,有助于理解土壤磷的转化过程,为优化有效磷管理和提高磷资源利用效率提供参考。【方法】 采集吉林公主岭市9个有效磷含量不同(11、21、31、40、57、69、128、331、490 mg·kg-1)的农田耕层(0—20 cm)土壤,利用TIESSEN-Moir修正的HEDLEY磷分级法,对土壤无机磷和有机磷进行分级,并分析其与土壤有机质(SOM)、C/P、铁铝氧化物等土壤化学性质之间的关系,明确土壤有效磷不同阈值区间的磷形态特征及主控因素。【结果】 黑土磷库以无机磷为主,占比为71.25%—96.19%,有机磷占比较小,约为3.81%—28.75%。有效磷水平低于农学阈值(7.4—13 mg·kg-1)时,活性态磷(LP)占比最小(19.89%);有效磷水平低于环境阈值(51.0—56.4 mg·kg-1)时,中活性态磷(ML-P)和稳定态磷(OP)占比接近,分别为36.03%和35.49%,均高于LP占比(28.48%);有效磷水平高于环境阈值时,LP占比最高(42.86%)。有效磷水平高于环境阈值时,土壤的LP、ML-P的含量显著高于有效磷水平低于环境阈值的土壤,树脂磷(Resin-P)是环境阈值前后区间变幅最大的磷形态。PAC、M3-Al、游离态铝(Ald)、络合态铁铝(Fep、Alp)、非晶质态铁铝(Feo、Alo)随有效磷水平的增加而显著增加,C/P随有效磷水平增加而显著降低。相关分析表明,有效磷水平低于环境阈值时,SOM和活性较高的无机态磷(Resin-P、NaHCO3-Pi、NaOH-Pi)呈显著正相关关系;有效磷水平高于环境阈值时,Fep+Alp与无机态磷(Resin-P、NaHCO3-Pi、NaOH-Pi、D.HCl-Pi、C.HCl-Pi)呈显著正相关关系。冗余分析结果表明,有效磷水平低于环境阈值时,SOM和M3-Fe是影响黑土磷形态变化的关键因子,分别解释了全部变异的50.2%和24.1%;有效磷水平高于环境阈值时,Fep+Alp是造成磷形态差异的关键因子,解释了全部变异的68.1%。【结论】 活性态磷在有效磷水平低于农学阈值时占比最小,在有效磷水平超过环境阈值时,其占比最大,Resin-P是在环境阈值前后区间变幅最大的磷形态。SOM和M3-Fe是土壤有效磷水平低于环境阈值、Fep+Alp是高于环境阈值土壤影响磷形态变化的关键因子。
秦贞涵,王琼,张乃于,金玉文,张淑香. 黑土有效磷阈值区间的磷形态特征及对土壤化学性质的响应[J]. 中国农业科学, 2022, 55(22): 4419-4432.
QIN ZhenHan,WANG Qiong,ZHANG NaiYu,JIN YuWen,ZHANG ShuXiang. Characteristics of Phosphorus Fractions and Its Response to Soil Chemical Properties Under the Threshold Region of Olsen P in Black Soil[J]. Scientia Agricultura Sinica, 2022, 55(22): 4419-4432.
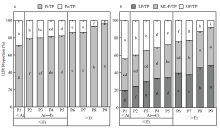
图1
不同阈值区间黑土磷形态的相对含量 LP:活性态磷Labile phosphorus;ML-P:中活性态磷Middle-labile phosphorus;OP:稳定态磷Occlude phosphorus;At:农学阈值Agronomy threshold;Et:环境阈值Environmental threshold;Pi:总无机磷Total inorganic phosphorus;Po:总有机磷Total organic phosphorus。P1—P9:Represents nine groups of soils with different levels of Olsen P。下同 The same as below 图中不同小写字母表示同一磷形态在不同土壤样品间差异显著(P<0.05)。Different lower-case letters inside the bars indicate significant differences for the same P fraction among the different soil samples at the 5% level"
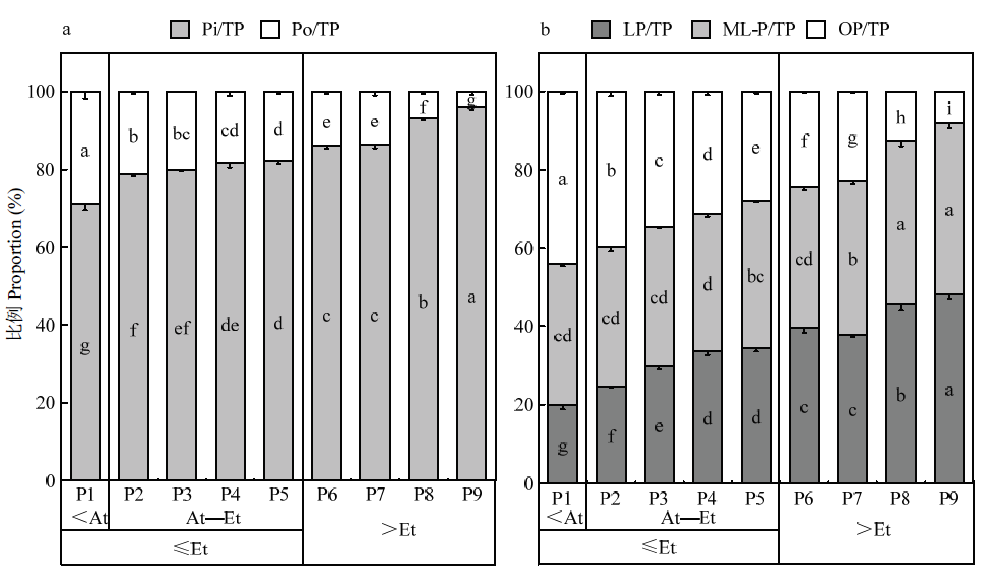
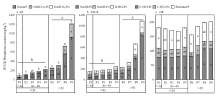
图2
不同阈值区间的黑土磷形态含量 图中不同小写字母表示同一形态磷含量在不同土壤样品间差异显著(P<0.05),不同大写字母表示同一形态磷的平均含量在环境阈值(Et)区间差异显著(P<0.05)"
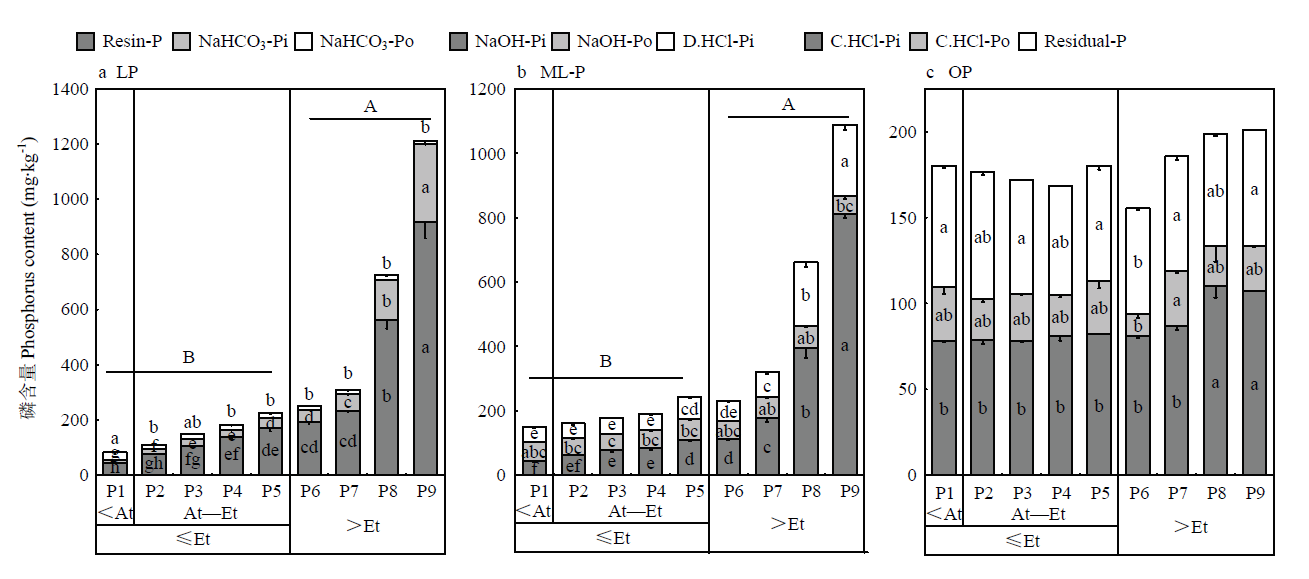
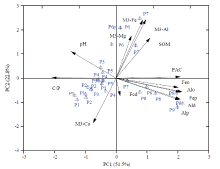
图3
土壤化学性质的主成分分析"
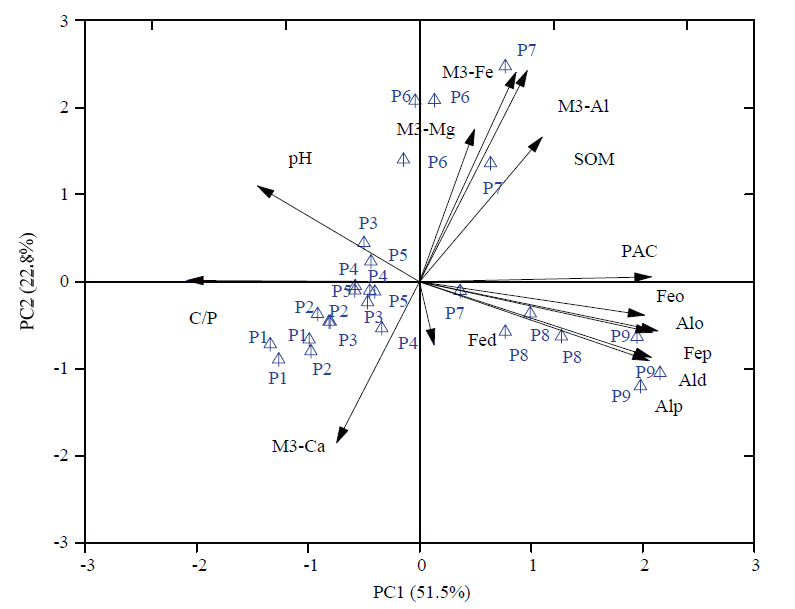
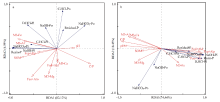
图4
环境阈值区间的土壤化学性质对磷形态的影响 (a)、(b)分为有效磷水平低于环境阈值(Et)和高于环境阈值时的冗余分析"
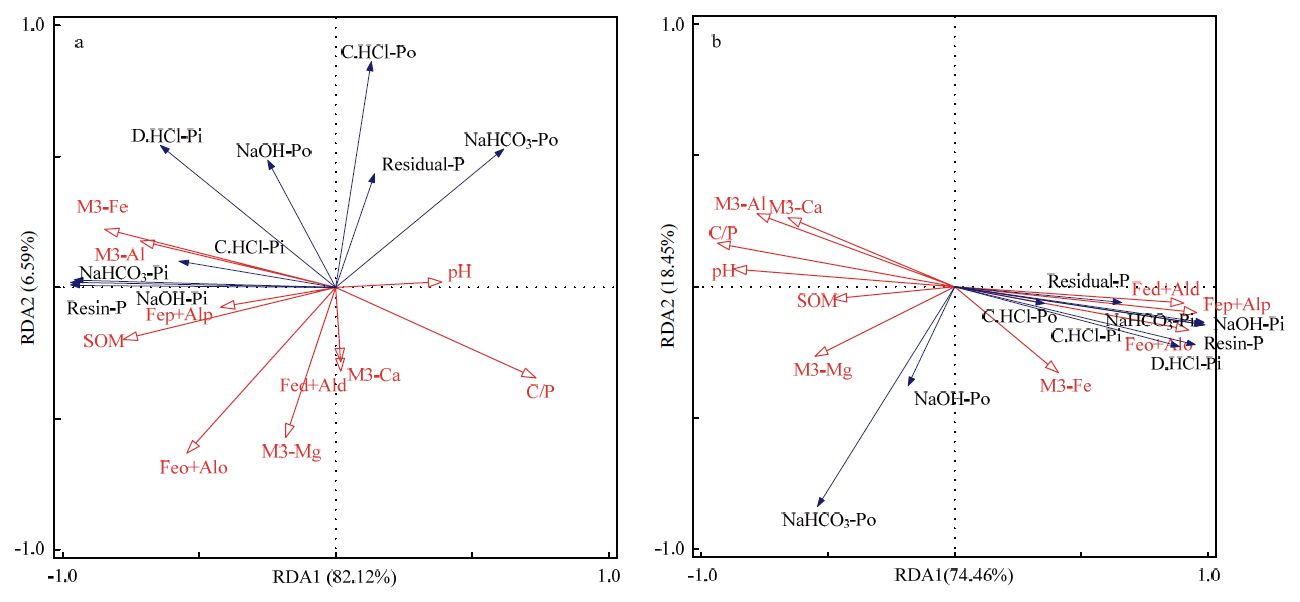
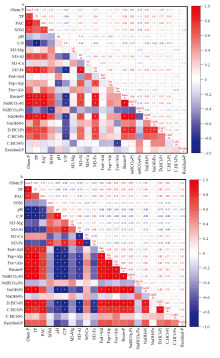
图5
环境阈值区间的土壤化学性质与磷形态的关系 (a)、(b)分为有效磷水平≤Et和>Et的相关分析。“*”代表在P<0.01水平显著"
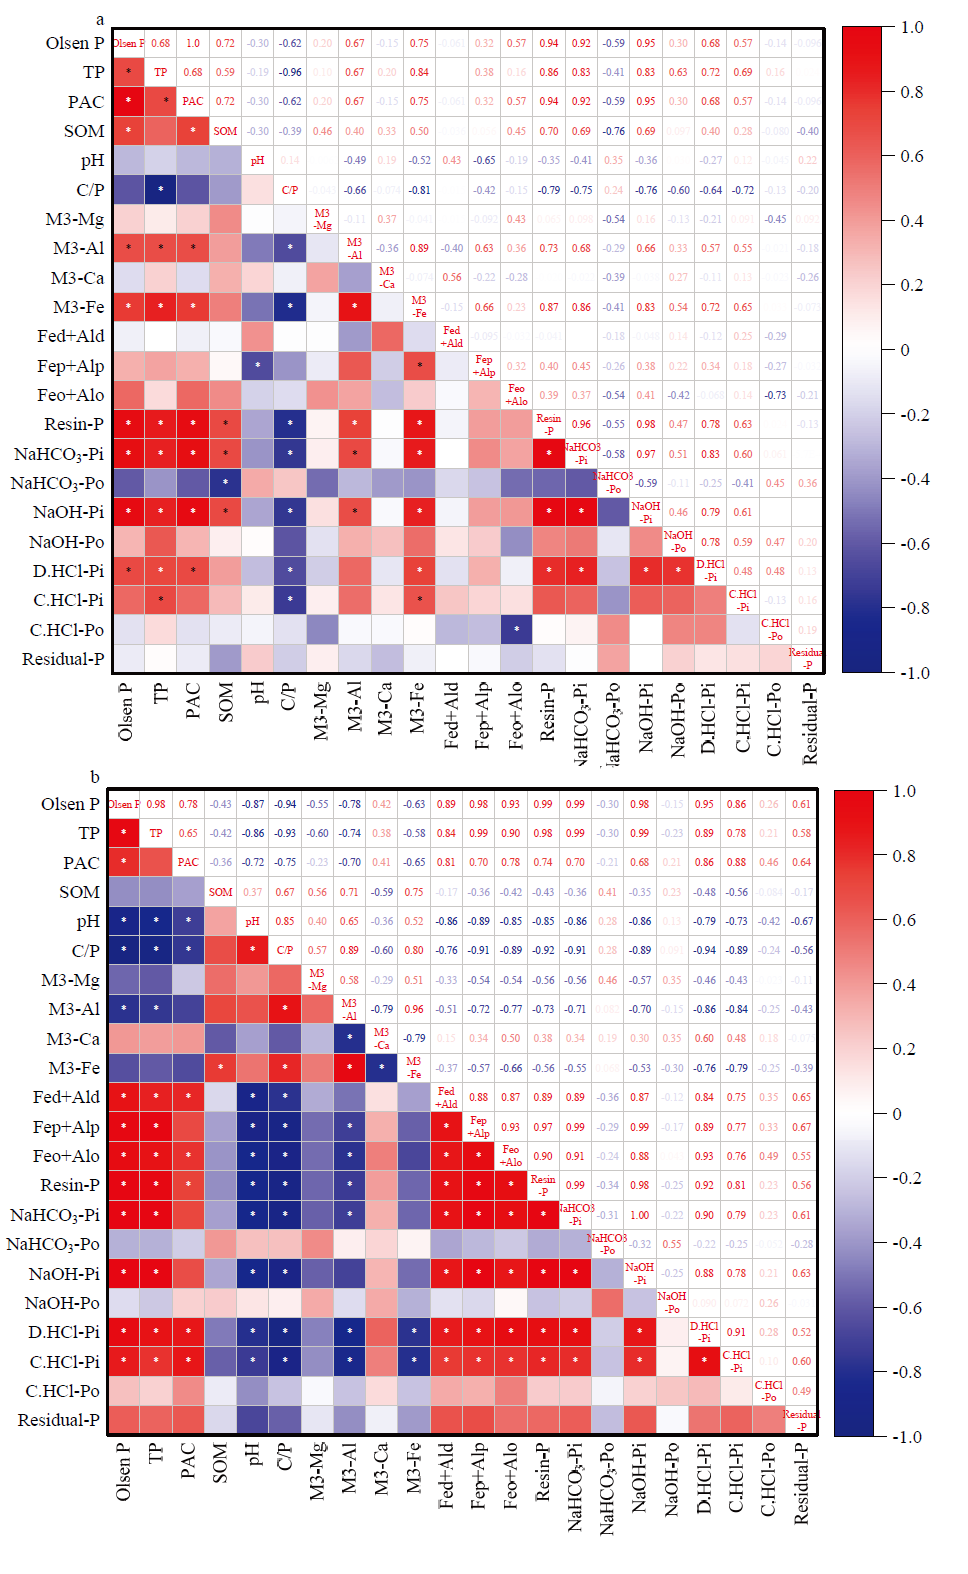
表1
黑土不同形态磷含量与有效磷含量的回归方程"
| 磷形态 P fraction | P1-P5(≤Et) | P6-P9(>Et) | ||
| 回归方程 Regression equation | R2 | 回归方程 Regression equation | R2 | |
| Pi | y = 5.38x + 231.66 | 0.97** | y = 4.09x +205.73 | 0.99** |
| Resin-P | y = 2.93x + 13.56 | 0.97** | y = 1.62x + 48.54 | 0.98** |
| NaHCO3-Pi | y = 0.60x + 3.63 | 0.93** | y = 0.52x - 3.75 | 0.98** |
| NaOH-Pi | y = 1.42x + 28.7 | 0.95** | y = 1.50x - 21.67 | 0.96** |
| D.HCl-Pi | y = 0.48x + 36.02 | 0.62** | y = 0.38x + 39.93 | 0.90** |
| C.HCl-Pi | y=0.10x + 76.25 | 0.45** | y=0.063x + 79.60 | 0.74** |
| Residual-P | y=-0.004x + 65.96 | 0.001 | y=0.009x + 63.03 | 0.37 |
| *: P<0.05; **: P<0.01. Et: 环境阈值Environmental threshold | ||||
表2
不同阈值区间黑土性质的差异"
| 区间 Region | 土壤样品 Soil sample | Olsen P (mg·kg-1) | pH | C/P | PAC (%) | TP (g·kg-1) | SOM (g·kg-1) | M3-Ca (g·kg-1) | M3-Mg (g·kg-1) | M3-Fe (g·kg-1) | M3-Al (g·kg-1) | Fed (g·kg-1) | Ald (g·kg-1) | Fep (g·kg-1) | Alp (g·kg-1) | Feo (g·kg-1) | Alo (g·kg-1) | |
| ≤Et | <At | P1 | 11.16i | 5.19ab | 25.94ab | 2.42g | 0.46e | 20.53c | 3.00a | 0.52b | 0.30d | 1.57c | 7.51ab | 1.62de | 0.30d | 1.13d | 3.46e | 2.07e |
| At-Et | P2 | 21.06h | 5.26ab | 27.46a | 4.56f | 0.46e | 21.84b | 3.03a | 0.54ab | 0.30d | 1.57c | 7.61a | 1.62de | 0.30d | 1.12d | 4.36d | 2.34de | |
| P3 | 31.93g | 5.10ab | 23.55bc | 5.90ef | 0.54de | 21.96ab | 2.81ab | 0.53ab | 0.32cd | 1.63bc | 7.54ab | 1.54e | 0.34cd | 1.13d | 4.59cd | 2.46d | ||
| P4 | 39.96f | 5.07ab | 21.88cd | 6.69de | 0.60de | 22.47ab | 3.03a | 0.54ab | 0.35bc | 1.66bc | 7.64a | 1.70d | 0.36cd | 1.14d | 4.42d | 2.54d | ||
| P5 | 56.53e | 5.11ab | 19.64d | 8.07d | 0.6d | 22.73ab | 2.99a | 0.53ab | 0.36bc | 1.66bc | 7.48ab | 1.67de | 0.37c | 1.12d | 4.25d | 2.39de | ||
| 均值 Mean | 31.64B | 5.15 | 23.70A | 5.53B | 0.55B | 21.90 | 2.97 | 0.53 | 0.33 | 1.62B | 7.51 | 1.63B | 0.33B | 1.13B | 4.16B | 2.36B | ||
| >Et | P6 | 69.44d | 5.34a | 15.79e | 8.10d | 0.86c | 23.34ab | 2.68b | 0.55ab | 0.50a | 1.94a | 7.16b | 1.67de | 0.37c | 1.21d | 4.41d | 2.61d | |
| P7 | 128.17c | 5.09ab | 13.87e | 13.00c | 1.01c | 23.22ab | 2.63b | 0.58a | 0.51a | 1.89a | 7.7a | 1.93c | 0.49b | 1.50c | 4.85c | 3.06c | ||
| P8 | 331.14b | 5.00ab | 7.32f | 18.61a | 1.77b | 22.46ab | 2.98a | 0.56ab | 0.34cd | 1.70b | 7.6a | 2.28b | 0.54b | 1.93b | 5.43b | 3.71b | ||
| P9 | 526.32a | 4.75c | 4.23f | 16.84b | 3.12a | 22.78a | 2.81ab | 0.53ab | 0.38b | 1.71b | 7.63a | 2.94a | 0.85a | 2.77a | 6.02a | 4.27a | ||
| 均值 Mean | 263.77A | 5.05 | 10.30B | 14.14A | 1.69A | 22.95 | 2.77 | 0.56 | 0.42 | 1.81A | 7.44 | 2.21A | 0.56A | 1.85A | 5.18A | 3.41A | ||
| 不同小写字母表示同一土壤化学性质在不同土壤样品间差异显著(P<0.05);不同大写字母表示同一土壤化学性质的均值在环境阈值区间差异显著(P<0.05),Mean:≤Et及>Et部分的均值。TP:全磷 Different lowercase letters indicate significant differences in the same soil chemical properties among different soil samples at 5% level; Different capital letters indicate significant differences for the mean value in the same soil chemical properties above and below the environmental threshold region at 5% level. Mean: Mean values of≤Et and >Et. TP: Total phosphorus | ||||||||||||||||||
| [1] |
DALY K, STYLES D, LALOR S, WALL D P. Phosphorus sorption, supply potential and availability in soils with contrasting parent material and soil chemical properties. European Journal of Soil Science, 2015, 66(4): 792-801. doi:10.1111/ejss.12260.
doi: 10.1111/ejss.12260. |
| [2] |
SIMS J T, EDWARDS A C, SCHOUMANS O F, SIMARD R R. Integrating soil phosphorus testing into environmentally based agricultural management practices. Journal of Environmental Quality, 2000, 29(1): 60-71. doi:10.2134/jeq2000.00472425002900010008x.
doi: 10.2134/jeq2000.00472425002900010008x. |
| [3] | 康日峰, 任意, 吴会军, 张淑香. 26年来东北黑土区土壤养分演变特征. 中国农业科学, 2016, 49(11): 2113-2125. |
| KANG R F, REN Y, WU H J, ZHANG S H. Changes in the nutrients and fertility of black soil over 26 years in Northeast China. Scientia Agricultura Sinica, 2016, 49(11): 2113-2125. (in Chinese) | |
| [4] | 马星竹, 周宝库, 郝小雨, 陈雪丽, 高中超, 迟凤琴. 小麦-大豆-玉米轮作体系长期不同施肥黑土磷素平衡及有效性. 植物营养与肥料学报, 2018, 24(6): 1672-1678. |
| MA X Z, ZHOU B K, HAO X Y, CHEN X L, GAO Z C, CHI F Q. Phosphorus balance and availability in black soil under long-term wheat-soybean-maize rotation and fertilization. Journal of Plant Nutrition and Fertilizers, 2018, 24(6): 1672-1678. (in Chinese) | |
| [5] |
MALLARINO A P, BLACKMER A M. Comparison of methods for determining critical concentrations of soil test phosphorus for corn. Agronomy Journal, 1992, 84(5): 850-856. doi:10.2134/agronj1992.00021962008400050017x.
doi: 10.2134/agronj1992.00021962008400050017x. |
| [6] |
LI H G, LIU J, LI G H, SHEN J B, BERGSTRÖM L, ZHANG F S. Past, present, and future use of phosphorus in Chinese agriculture and its influence on phosphorus losses. Ambio, 2015, 44(Suppl 2): S274-S285. doi:10.1007/s13280-015-0633-0.
doi: 10.1007/s13280-015-0633-0. |
| [7] |
ZHOU J, ZHANG Y F, WU K B, HU M P, WU H, CHEN D J. National estimates of environmental thresholds for upland soil phosphorus in China based on a meta-analysis. Science of the Total Environment, 2021, 780: 146677. doi:10.1016/j.scitotenv.2021.146677.
doi: 10.1016/j.scitotenv.2021.146677. |
| [8] | 张林, 吴宁, 吴彦, 罗鹏, 刘琳, 陈文年, 胡红宇. 土壤磷素形态及其分级方法研究进展. 应用生态学报, 2009, 20(7): 1775-1782. |
| ZHANG L, WU N, WU Y, LUO P, LIU L, CHEN W N, HU H Y. Soil phosphorus form and fractionation scheme: A review. Chinese Journal of Applied Ecology, 2009, 20(7):1775-1782. (in Chinese) | |
| [9] |
HEDLEY M J, STEWART J W B, CHAUHAN B S. Changes in inorganic and organic soil phosphorus fractions induced by cultivation practices and by laboratory incubations. Soil Science Society of America Journal, 1982, 46(5): 970-976. doi:10.2136/sssaj1982.03615995004600050017x.
doi: 10.2136/sssaj1982.03615995004600050017x. |
| [10] | TIESSEN H, MOIR J O. Characterization of Available P by Sequential Extraction. Boca Raton: CRC Press, 1993. |
| [11] |
CROSS A F, SCHLESINGER W H. A literature review and evaluation of the Hedley fractionation: applications to the biogeochemical cycle of soil phosphorus in natural ecosystems. Geoderma, 1995, 64(3/4): 197-214.doi:10.1016/0016-7061(94)00023-4.
doi: 10.1016/0016-7061(94)00023-4. |
| [12] |
NEGASSA W, LEINWEBER P. How does the Hedley sequential phosphorus fractionation reflect impacts of land use and management on soil phosphorus: a review. Journal of Plant Nutrition and Soil Science, 2009, 172(3): 305-325. doi:10.1002/jpln.200800223.
doi: 10.1002/jpln.200800223. |
| [13] | 金欣, 姚珊, Batbayar Javkhlan, 贾丽洁, 张树兰, 杨学云. 冬小麦-夏休闲体系作物产量和土壤磷形态对长期施肥的响应. 植物营养与肥料学报, 2018, 24(6): 1660-1671. |
| JIN X, YAO S, JAVKHLAN B, JIA L J, ZHANG S L, YANG X Y. Response of wheat yield and soil phosphorus fractions to long-term fertilization under rainfed winter wheat-summer fallow cropping system. Journal of Plant Nutrition and Fertilizers, 2018, 24(6): 1660-1671. (in Chinese) | |
| [14] |
SHI Y C, ZIADI N, MESSIGA A J, LALANDE R, HU Z Y. Changes in soil phosphorus fractions for a long-term corn-soybean rotation with tillage and phosphorus fertilization. Soil Science Society of America Journal, 2013, 77(4): 1402-1412. doi:10.2136/sssaj2012.0427.
doi: 10.2136/sssaj2012.0427. |
| [15] |
YAN Z J, CHEN S, LI J L, ALVA A, CHEN Q. Manure and nitrogen application enhances soil phosphorus mobility in calcareous soil in greenhouses. Journal of Environmental Management, 2016, 181: 26-35. doi:10.1016/j.jenvman.2016.05.081.
doi: S0301-4797(16)30336-X pmid: 27300290 |
| [16] | PRIYADARSHI R, KUMAR S, CHOUDHARY C. Phosphorus fraction dynamics in soil as affected by tillage and cropping system under irrigated agro-ecosystem. Journal of Pharmacognosy and Phytochemistry, 2018, 7: 392-396. |
| [17] |
贾莉洁, 李玉会, 孙本华, 杨学云. 不同管理方式对土壤无机磷及其组分的影响. 土壤通报, 2013, 44(3): 612-616. doi:10.19336/j.cnki.trtb.2013.03.017.
doi: 10.19336/j.cnki.trtb.2013.03.017. |
|
JIA L J, LI Y H, SUN B H, YANG X Y. Effect of diverse soil managements on inorganic phosphorus and its fractions in a loess soil from a long-term experiment. Chinese Journal of Soil Science, 2013, 44(3): 612-616. doi:10.19336/j.cnki.trtb.2013.03.017. (in Chinese)
doi: 10.19336/j.cnki.trtb.2013.03.017. |
|
| [18] | 焦亚鹏, 齐鹏, 王晓娇, 姚一铭, 武均, 蔡立群, 张仁陟. 氮磷配施对黄土高原旱作农业区典型农田土壤无机磷形态的影响. 植物营养与肥料学报, 2020, 26(8): 1459-1472. |
| JIAO Y P, QI P, WANG X J, YAO Y M, WU J, CAI L Q, ZHANG R Z. Effects of nitrogen and phosphorus fertilization on inorganic phosphorus forms of typical farmland soil in the dry farming area of the Loess Plateau. Journal of Plant Nutrition and Fertilizers, 2020, 26(8): 1459-1472. (in Chinese) | |
| [19] | 王蕾, 王艳玲, 李欢, 石嘉琦, 周亦靖. 长期施肥下红壤旱地磷素有效性影响因子的冗余分析. 中国土壤与肥料, 2021(1): 17-25. |
| WANG L, WANG Y L, LI H, SHI J Q, ZHOU Y J. Redundancy analysis of influencing factors of phosphorus availability in red soil upland under long-term fertilization. Soil and Fertilizer Sciences in China, 2021(1): 17-25. (in Chinese) | |
| [20] |
YAN Y P, LIU F Jr, LI W, LIU F, FENG X H, SPARKS D L. Sorption and desorption characteristics of organic phosphates of different structures on aluminium (oxyhydr)oxides. European Journal of Soil Science, 2014, 65(2): 308-317. doi:10.1111/ejss.12119.
doi: 10.1111/ejss.12119. |
| [21] |
CELI L, PRATI M, MAGNACCA G, SANTORO V, MARTIN M. Role of crystalline iron oxides on stabilization of inositol phosphates in soil. Geoderma, 2020, 374: 114442. doi:10.1016/j.geoderma.2020.114442.
doi: 10.1016/j.geoderma.2020.114442. |
| [22] | 颜晓, 卢志红, 魏宗强, 周春火. 几种典型酸性旱地土壤磷吸附的关键影响因素. 中国土壤与肥料, 2019(3): 1-7. |
| YAN X, LU Z H, WEI Z Q, ZHOU C H. Key factors influencing phosphorus sorption for several acid upland soils. Soil and Fertilizer Sciences in China, 2019(3): 1-7. (in Chinese) | |
| [23] | 徐明岗. 土壤离子吸附1.离子吸附的类型及研究方法. 土壤肥料, 1997(5): 3-7. |
| XU M G. Soil ion adsorption 1. Types of ion adsorption and research methods. Soil and Fertilizer Sciences in China, 1997(5): 3-7.. (in Chinese) | |
| [24] | 吴璐璐, 张水清, 黄绍敏, 杜伟, 柳小琪, 王晓红, 吕家珑. 长期定位施肥对潮土磷素形态和有效性的影响. 土壤通报, 2021, 52(2): 379-386. |
| WU L L, ZHANG S Q, HUANG S M, DU W, LIU X Q, WANG X H, LÜ J L. Effect of long-term fertilization on phosphorus fraction and availability in fluvo-aquic soil. Chinese Journal of Soil Science, 2021, 52(2): 379-386. (in Chinese) | |
| [25] | 王琼, 展晓莹, 张淑香, 彭畅, 高洪军, 张秀芝, 朱平,Colinet Gilles. 长期有机无机肥配施提高黑土磷含量和活化系数. 植物营养与肥料学报, 2018, 24(6): 1679-1688. |
| WANG Q, ZHAN X Y, ZHANG S X, PENG C, GAO H J, ZHANG X Z, ZHU P, GILLES C. Increment of soil phosphorus pool and activation coefficient through long-term combination of NPK fertilizers with manures in black soil. Journal of Plant Nutrition and Fertilizers, 2018, 24(6): 1679-1688. (in Chinese) | |
| [26] | 沈浦. 长期施肥下典型农田土壤有效磷的演变特征及机制[D]. 北京: 中国农业科学院, 2014. |
| SHEN P. Evolution characteristics and mechanisms of soil available phosphorus in typical croplands under long-term fertilization[D]. Beijing: Chinese Academy of Agricultural Sciences, 2014. (in Chinese) | |
| [27] |
BAI Z H, LI H G, YANG X Y, ZHOU B K, SHI X J, WANG B R, LI D C, SHEN J B, CHEN Q, QIN W, OENEMA O, ZHANG F S. The critical soil P levels for crop yield, soil fertility and environmental safety in different soil types. Plant and Soil, 2013, 372(1/2): 27-37. doi:10.1007/s11104-013-1696-y.
doi: 10.1007/s11104-013-1696-y. |
| [28] |
SHEN P, HE X H, XU M G, ZHANG H M, PENG C, GAO H J, LIU H, XU Y M, QIN S, XIAO H J. Soil organic carbon accumulation increases percentage of soil Olsen-P to total P at two 15-year mono-cropping systems in Northern China. Journal of Integrative Agriculture, 2014, 13(3):597-603.doi:10.1016/S2095-3119(13)60717-0.
doi: 10.1016/S2095-3119(13)60717-0 |
| [29] |
张鑫, 谷会岩, 陈祥伟. 择伐干扰对小兴安岭阔叶红松林土壤磷形态及有效性的影响. 应用生态学报, 2018, 29(2): 441-448. doi:10.13287/j.1001-9332.201802.009.
doi: 10.13287/j.1001-9332.201802.009 |
|
ZHANG X, GU H Y, CHEN X W. Effects of selective cutting on soil phosphorus forms and availability in Korean pine broad-leaved forest in Xiaoxing'an Mountains of China. Chinese Journal of Applied Ecology, 2018, 29(2): 441-448. doi:10.13287/j.1001-9332.201802.009. (in Chinese)
doi: 10.13287/j.1001-9332.201802.009 |
|
| [30] | 闫金垚, 郭丽璇, 王昆昆, 廖世鹏, 陆志峰, 丛日环, 李小坤, 任涛, 鲁剑巍. 长江流域稻-油轮作区土壤磷库现状及环境风险分析. 土壤学报, 2021: 1-13. |
| YAN J Y, GUO L X, WANG K K, LIAO S P, LU Z F, CONG R H, LI X K, REN T, LU J W. Status of soil phosphorus pool and environmental risk assessment in rice oilseed rape rotation area in the Yangtze River Basin. Acta Pedologica Sinica, 2021: 1-13. (in Chinese) | |
| [31] | 李若楠, 王政培, BATBAYAR Javkhlan, 张东杰, 张树兰, 杨学云. 等有机质塿土有效磷和无机磷形态的关系. 中国农业科学, 2019, 52(21): 3852-3865. |
| LI R N, WANG Z P, BATBAYAR J, ZHANG D J, ZHANG S L, YANG X Y. Relationship between soil available phosphorus and inorganic phosphorus forms under equivalent organic matter condition in a tier soil. Scientia Agricultura Sinica, 2019, 52(21): 3852-3865. (in Chinese) | |
| [32] |
ZHANG W W, ZHAN X Y, ZHANG S X, IBRAHIMA K H M, XU M G. Response of soil Olsen-P to P budget under different long-term fertilization treatments in a fluvo-aquic soil. Journal of Integrative Agriculture, 2019, 18(3):667-676. doi:10.1016/S2095-3119(18) 62070-2.
doi: 10.1016/S2095-3119(18)62070-2 |
| [33] | 刘彦伶, 李渝, 张艳, 张雅蓉, 黄兴成, 张萌, 张文安, 蒋太明. 长期施用磷肥和有机肥黄壤微生物量磷特征. 中国农业科学, 2021, 54(6): 1188-1198. |
| LIU Y L, LI Y, ZHANG Y, ZHANG Y R, HUANG X C, ZHANG M, ZHANG W A, JIANG T M. Characteristics of microbial biomass phosphorus in yellow soil under long-term application of phosphorus and organic fertilizer. Scientia Agricultura Sinica, 2021, 54(6): 1188-1198. (in Chinese) | |
| [34] |
YANG X, POST W M. Phosphorus transformations as a function of pedogenesis: a synthesis of soil phosphorus data using Hedley fractionation method. Biogeosciences, 2011, 8(10): 2907-2916. doi: 10.5194/bg-8-2907-2011.
doi: 10.5194/bg-8-2907-2011. |
| [35] |
颜晓军, 苏达, 郑朝元, 叶德练, 吴良泉. 长期施肥对酸性土壤磷形态及有效性的影响. 土壤, 2020, 52(6): 1139-1144. doi:10.13758/j.cnki.tr.2020.06.006.
doi: 10.13758/j.cnki.tr.2020.06.006. |
|
YAN X J, SU D, ZHENG C Y, YE D L, WU L Q. Effects of long-term fertilization on phosphorus forms and availability in acid soils. Soils, 2020, 52(6): 1139-1144. doi:10.13758/j.cnki.tr.2020.06.006. (in Chinese)
doi: 10.13758/j.cnki.tr.2020.06.006. |
|
| [36] |
SIDDIQUE M T, ROBINSON J S. Phosphorus sorption and availability in soils amended with animal manures and sewage sludge. Journal of Environmental Quality, 2003, 32(3): 1114-1121. doi:10.2134/jeq2003.1114.
doi: 10.2134/jeq2003.1114. pmid: 12809313 |
| [37] |
王琼, 展晓莹, 张淑香, 彭畅, 高洪军, 张秀芝, 朱平,GILLES Colinet. 长期不同施肥处理黑土磷的吸附-解吸特征及对土壤性质的响应. 中国农业科学, 2019, 52(21): 3866-3877. doi:10.3864/j.issn.0578-1752.2019.21.015.
doi: 10.3864/j.issn.0578-1752.2019.21.015. |
|
WANG Q, ZHAN X Y, ZHANG S X, PENG C, GAO H J, ZHANG X Z, ZHU P, COLINET G. Phosphorus adsorption and desorption characteristics and its response to soil properties of black soil under long-term different fertilization. Scientia Agricultura Sinica, 2019, 52(21): 3866-3877. doi:10.3864/j.issn.0578-1752.2019.21.015. (in Chinese)
doi: 10.3864/j.issn.0578-1752.2019.21.015. |
|
| [38] |
BLAKE L, HESKETH N, FORTUNE S, BROOKES P C. Assessing phosphorus ‘Change-Points’ and leaching potential by isotopic exchange and sequential fractionation. Soil Use and Management, 2002, 18(3): 199-207. doi:10.1111/j.1475-2743.2002.tb00240.x.
doi: 10.1111/j.1475-2743.2002.tb00240.x. |
| [39] |
许艳, 张仁陟. 陇中黄土高原不同耕作措施下土壤磷动态研究. 土壤学报, 2017, 54(3): 670-681. doi:10.11766/trxb201607220250.
doi: 10.11766/trxb201607220250. |
|
XU Y, ZHANG R Z. Dynamics of soil phosphorus as affected by tillage on the loess plateau in central Gansu, China. Acta Pedologica Sinica, 2017, 54(3): 670-681. doi:10.11766/trxb201607220250. (in Chinese)
doi: 10.11766/trxb201607220250. |
|
| [40] |
VERMA S, SUBEHIA S K, SHARMA S P. Phosphorus fractions in an acid soil continuously fertilized with mineral and organic fertilizers. Biology and Fertility of Soils, 2005, 41(4): 295-300. doi:10.1007/s00374-004-0810-y.
doi: 10.1007/s00374-004-0810-y. |
| [41] | 夏海勇, 王凯荣. 有机质含量对石灰性黄潮土和砂姜黑土磷吸附-解吸特性的影响. 植物营养与肥料学报, 2009, 15(6): 1303-1310. |
| XIA H Y, WANG K R. Effects of soil organic matter on characteristics of phosphorus adsorption and desorption in calcareous yellow fluvo-aquic soil and lime concretion black soil. Plant Nutrition and Fertilizer Science, 2009, 15(6): 1303-1310. (in Chinese) | |
| [42] |
WADE J, CULMAN S W, SHARMA S, MANN M, DEMYAN M S, MERCER K L, BASTA N T. How does phosphorus restriction impact soil health parameters in Midwestern corn-soybean systems? Agronomy Journal, 2019, 111(4): 1682-1692. doi:10.2134/agronj2018.11.0739.
doi: 10.2134/agronj2018.11.0739. |
| [43] |
LIU J, YANG J, CADE-MENUN B J, HU Y, LI J, PENG C, MA Y. Molecular speciation and transformation of soil legacy phosphorus with and without long-term phosphorus fertilization: insights from bulk and microprobe spectroscopy. Scientific Reports, 2017, 7: 15354. doi:10.1038/s41598-017-13498-7.
doi: 10.1038/s41598-017-13498-7 pmid: 29127287 |
| [44] |
MCDOWELL R W, CONDRON L M, STEWART I. Variation in environmentally- and agronomically-significant soil phosphorus concentrations with time since stopping the application of phosphorus fertilisers. Geoderma, 2016, 280: 67-72. doi:10.1016/j.geoderma.2016.06.022.
doi: 10.1016/j.geoderma.2016.06.022. |
| [45] |
TIECHER T, DOS SANTOS D R, CALEGARI A. Soil organic phosphorus forms under different soil management systems and winter crops, in a long term experiment. Soil and Tillage Research, 2012, 124: 57-67. doi:10.1016/j.still.2012.05.001.
doi: 10.1016/j.still.2012.05.001. |
| [46] |
YANG X, POST W M. Phosphorus transformations as a function of pedogenesis: a synthesis of soil phosphorus data using Hedley fractionation method. Biogeosciences, 2011, 8(10): 2907-2916. doi:10.5194/bg-8-2907-2011.
doi: 10.5194/bg-8-2907-2011. |
| [47] |
ZHANG T Q, MACKENZIE A F, LIANG B C, DRURY C F. Soil test phosphorus and phosphorus fractions with long-term phosphorus addition and depletion. Soil Science Society of America Journal, 2004, 68(2): 519-528. doi:10.2136/sssaj2004.5190.
doi: 10.2136/sssaj2004.5190. |
| [48] |
WANG X M, HU Y F, TANG Y D, YANG P, FENG X H, XU W Q, ZHU M Q. Phosphate and phytate adsorption and precipitation on ferrihydrite surfaces. Environmental Science: Nano, 2017, 4(11): 2193-2204. doi:10.1039/c7en00705a.
doi: 10.1039/c7en00705a. |
| [49] | HAVLIN J L, TISDALE S L, NELSON W L BEATON J D. Soil fertility and fertilizers: an introduction to nutrient management. Soil Fertility & Fertilizers an Introduction to Nutrient Management, 1999. |
| [50] |
HEDLEY M J, STEWART J W B, CHAUHAN B S. Changes in inorganic and organic soil phosphorus fractions induced by cultivation practices and by laboratory incubations. Soil Science Society of America Journal, 1982, 46(5): 970-976. doi:10.2136/sssaj1982.03615995004600050017x.
doi: 10.2136/sssaj1982.03615995004600050017x. |
| [51] |
WRIGHT R B, LOCKABY B G, WALBRIDGE M R. Phosphorus availability in an artificially flooded southeastern floodplain forest soil. Soil Science Society of America Journal, 2001, 65(4): 1293-1302. doi:10.2136/sssaj2001.6541293x.
doi: 10.2136/sssaj2001.6541293x. |
| [52] |
YAN X, WANG D J, ZHANG H L, ZHANG G, WEI Z Q. Organic amendments affect phosphorus sorption characteristics in a paddy soil. Agriculture, Ecosystems & Environment, 2013, 175: 47-53. doi:10.1016/j.agee.2013.05.009.
doi: 10.1016/j.agee.2013.05.009. |
| [53] |
YAN Z J, CHEN S, DARI B, SIHI D, CHEN Q. Phosphorus transformation response to soil properties changes induced by manure application in a calcareous soil. Geoderma, 2018, 322: 163-171. doi:10.1016/j.geoderma.2018.02.035.
doi: 10.1016/j.geoderma.2018.02.035. |
| [54] |
NOBILE C M, BRAVIN M N, BECQUER T, PAILLAT J M. Phosphorus sorption and availability in an andosol after a decade of organic or mineral fertilizer applications: importance of pH and organic carbon modifications in soil as compared to phosphorus accumulation. Chemosphere, 2020, 239: 124709. doi:10.1016/j.chemosphere.2019.124709.
doi: 10.1016/j.chemosphere.2019.124709. |
| [55] | 孟思明. 长期施肥对土壤粘粒矿物组成及其演变特征的影响[D]. 武汉: 华中农业大学, 2014. |
| MENG S M. Effect of long-term fertilization on soil clay mineral composition and its evolution characteristics[D]. Wuhan: Huazhong Agricultural University, 2014. (in Chinese) | |
| [56] |
MA J, MA Y L, WEI R F, CHEN Y L, WENG L P, OUYANG X X, LI Y T. Phosphorus transport in different soil types and the contribution of control factors to phosphorus retardation. Chemosphere, 2021, 276: 130012. doi:10.1016/j.chemosphere.2021.130012.
doi: 10.1016/j.chemosphere.2021.130012. |
| [57] |
ZAMUNER E C, PICONE L I, ECHEVERRIA H E. Organic and inorganic phosphorus in Mollisol soil under different tillage practices. Soil and Tillage Research, 2008, 99(2): 131-138. doi:10.1016/j.still.2007.12.006.
doi: 10.1016/j.still.2007.12.006. |
| [58] |
ABDALA D B, DA SILVA I R, VERGÜTZ L, SPARKS D L. Long-term manure application effects on phosphorus speciation, kinetics and distribution in highly weathered agricultural soils. Chemosphere, 2015, 119: 504-514. doi:10.1016/j.chemosphere.2014.07.029.
doi: S0045-6535(14)00889-3 pmid: 25112576 |
| [59] |
CELI L, DE LUCA G, BARBERIS E. Effects of interaction of organic and inorganic p with ferrihydrite and kaolinite-iron oxide systems on iron release. Soil Science, 2003, 168(7): 479-488. doi:10.1097/01.ss.0000080333.10341.a4.
doi: 10.1097/01.ss.0000080333.10341.a4. |
| [60] |
CELI L, PRATI M, MAGNACCA G, SANTORO V, MARTIN M. Role of crystalline iron oxides on stabilization of inositol phosphates in soil. Geoderma, 2020, 374: 114442. doi:10.1016/j.geoderma.2020.114442.
doi: 10.1016/j.geoderma.2020.114442. |
| [61] |
WU Q H, ZHANG S X, REN Y, ZHAN X Y, XU M G, FENG G. Soil phosphorus management based on the agronomic critical value of Olsen P. Communications in Soil Science and Plant Analysis, 2018, 49(8): 934-944. doi:10.1080/00103624.2018.1448410.
doi: 10.1080/00103624.2018.1448410. |
| [62] | 张淑香, 徐明岗. 中国土壤磷素演变与高效利用. 北京: 中国农业科学技术出版社, 2020: 71-111. |
| ZHANG S X, XU M G. Evolution and Efficient Use of Phosphorus in Chinese Soils. Beijing: China Agricultural Science and Technology Press, 2020: 71-111. (in Chinese) |
| [1] | 王浩琳,马悦,李永华,李超,赵明琴,苑爱静,邱炜红,何刚,石美,王朝辉. 基于小麦产量与籽粒锰含量的磷肥优化管理[J]. 中国农业科学, 2022, 55(9): 1800-1810. |
| [2] | 高佳蕊,方胜志,张玉玲,安晶,虞娜,邹洪涛. 东北黑土不同开垦年限稻田土壤有机氮矿化特征[J]. 中国农业科学, 2022, 55(8): 1579-1588. |
| [3] | 张学林, 吴梅, 何堂庆, 张晨曦, 田明慧, 李晓立, 侯小畔, 郝晓峰, 杨青华, 李潮海. 秸秆分解对两种类型土壤无机氮和氧化亚氮排放的影响[J]. 中国农业科学, 2022, 55(4): 729-742. |
| [4] | 董泽宽,张水勤,李燕婷,高强,赵秉强,袁亮. 添加螯合剂对磷酸二铵溶解、固定及转化的影响[J]. 中国农业科学, 2022, 55(21): 4225-4236. |
| [5] | 龚小雅,石记博,方凌,方亚鹏,吴凤芝. 淹水对辣椒连作土壤化学性质与微生物群落结构的影响[J]. 中国农业科学, 2022, 55(12): 2472-2484. |
| [6] | 张梦亭, 刘萍, 黄丹丹, 贾淑霞, 张晓珂, 张士秀, 梁文举, 陈学文, 张延, 梁爱珍. 东北黑土线虫群落对长期免耕后土壤扰动的响应[J]. 中国农业科学, 2021, 54(22): 4840-4850. |
| [7] | 任嘉欣,刘京,陈轩敬,张跃强,张勇,王洁,石孝均. 长期施肥紫色土有效磷变化及其对稻麦轮作产量的影响[J]. 中国农业科学, 2021, 54(21): 4601-4610. |
| [8] | 吉冰洁,李文海,徐梦洋,牛金璨,张树兰,杨学云. 不同磷肥品种在石灰性土壤中的磷形态差异[J]. 中国农业科学, 2021, 54(12): 2581-2594. |
| [9] | 尹思佳,李慧,徐志强,裴久渤,戴继光,刘雨薇,李艾蒙,于雅茜,刘维,汪景宽. 东北典型黑土区旱地耕层土壤肥力指标的纬度变化特征及其关系[J]. 中国农业科学, 2021, 54(10): 2132-2141. |
| [10] | 马原,迟美静,张玉玲,范庆峰,虞娜,邹洪涛. 黑土旱地改稻田土壤水稳性团聚体有机碳和全氮的变化特征[J]. 中国农业科学, 2020, 53(8): 1594-1605. |
| [11] | 魏丹,蔡姗姗,李艳,金梁,王伟,李玉梅,白杨,胡钰. 黑土水溶性有机碳对有机物料还田的响应[J]. 中国农业科学, 2020, 53(6): 1180-1188. |
| [12] | 张秀芝,李强,高洪军,彭畅,朱平,高强. 长期施肥对黑土水稳性团聚体稳定性及有机碳分布的影响[J]. 中国农业科学, 2020, 53(6): 1214-1223. |
| [13] | 高洪军,彭畅,张秀芝,李强,朱平,王立春. 秸秆还田量对黑土区土壤及团聚体有机碳变化特征和 固碳效率的影响[J]. 中国农业科学, 2020, 53(22): 4613-4622. |
| [14] | 区惠平,周柳强,黄金生,谢如林,朱晓晖,彭嘉宇,曾艳,莫宗标,谭宏伟,叶盛勤. 赤红壤蔗区11年连续增量施磷下磷素演变及其 对甘蔗产量与磷流失的影响[J]. 中国农业科学, 2020, 53(22): 4623-4633. |
| [15] | 巩皓,杨柳,李丹丹,刘国富,肖知新,吴清莹,崔国文. 寒地黑土农区紫花苜蓿生产与品质对施肥和刈割频次的响应及效益分析[J]. 中国农业科学, 2020, 53(13): 2657-2667. |
|
||