


中国农业科学 ›› 2024, Vol. 57 ›› Issue (5): 950-964.doi: 10.3864/j.issn.0578-1752.2024.05.010
朱瑞明1,2( ), 赵荣钦1(), 焦士兴3, 李小建2, 肖连刚1, 谢志祥1, 杨青林1, 王帅1, 张慧芳1
收稿日期:2023-03-31
接受日期:2023-06-09
出版日期:2024-03-06
发布日期:2024-03-06
通信作者:
联系方式:
朱瑞明,E-mail:ruiming1227@henu.edu.cn。
基金资助:
ZHU RuiMing1,2(), ZHAO RongQin1(), JIAO ShiXing3, LI XiaoJian2, XIAO LianGang1, XIE ZhiXiang1, YANG QingLin1, WANG Shuai1, ZHANG HuiFang1
Received:2023-03-31
Accepted:2023-06-09
Published:2024-03-06
Online:2024-03-06
摘要:
【目的】探索不同乡镇和灌溉模式的农业碳排放空间格局及其影响机制,揭示农业水资源和能源消耗的组合特征差异,为农业灌溉模式优化、水资源与能源节约以及低碳可持续发展提供参考依据。【方法】利用遥感影像、气象数据、统计资料和问卷调研等多源数据,对河南省乡镇尺度冬小麦灌溉碳排放强度及其空间分布格局进行分析,对比不同灌溉模式(雨养为主的灌溉模式,PI模式;地表水灌溉为主的灌溉模式,SWI模式;引水灌溉工程为主的灌溉模式,WDI模式;地下水灌溉为主的灌溉模式,GI模式)下的碳排放强度差异,并通过地理探测器探究其影响机制。【结果】(1)2018年河南省乡镇尺度冬小麦灌溉碳排放强度均值为15.05 kg·t-1,并呈现出由西向东波动下降和从北向南减少的空间分布格局。碳排放强度高(>20.64 kg·t-1)的乡镇主要集中在西部高海拔地区,碳排放强度低(<13.76 kg·t-1)的乡镇主要分布在东南部地区。(2)4种灌溉模式中,冬小麦单位产量灌溉碳排放强度最高的是PI模式(22.22 kg·t-1),最低的是SWI模式(11.05 kg·t-1)。(3)平均海拔与有效降水量对碳排放强度空间分异的解释力分别达到49%和39%,是影响冬小麦灌溉碳排放强度的关键因素。同一驱动因素在不同灌溉模式下的影响具有差异性,能源消耗对WDI模式下的冬小麦灌溉碳排放强度空间分异格局的影响力最强,土地投入强度在GI模式下的驱动作用最为显著。此外,不同驱动因素交互作用后具有双因子增强效应和非线性增强效应。【结论】河南省乡镇尺度冬小麦灌溉碳排放强度存在空间异质性和灌溉模式差异,PI模式的冬小麦灌溉碳排放强度最高,WDI模式的碳排放量最高。平均海拔与降水是主导河南省乡镇尺度冬小麦灌溉碳排放强度空间分异格局形成的主要原因,人为因素则是不同灌溉模式下灌溉碳排放强度空间分异的主导力量。
朱瑞明, 赵荣钦, 焦士兴, 李小建, 肖连刚, 谢志祥, 杨青林, 王帅, 张慧芳. 河南省乡镇尺度冬小麦灌溉碳排放强度空间格局及影响因素分析[J]. 中国农业科学, 2024, 57(5): 950-964.
ZHU RuiMing, ZHAO RongQin, JIAO ShiXing, LI XiaoJian, XIAO LianGang, XIE ZhiXiang, YANG QingLin, WANG Shuai, ZHANG HuiFang. Spatial Distribution and Driving Factors of Winter Wheat Irrigation Carbon Emission Intensity at Township Level in Henan Province[J]. Scientia Agricultura Sinica, 2024, 57(5): 950-964.

图1
河南省冬小麦灌溉模式及调研点空间分布"
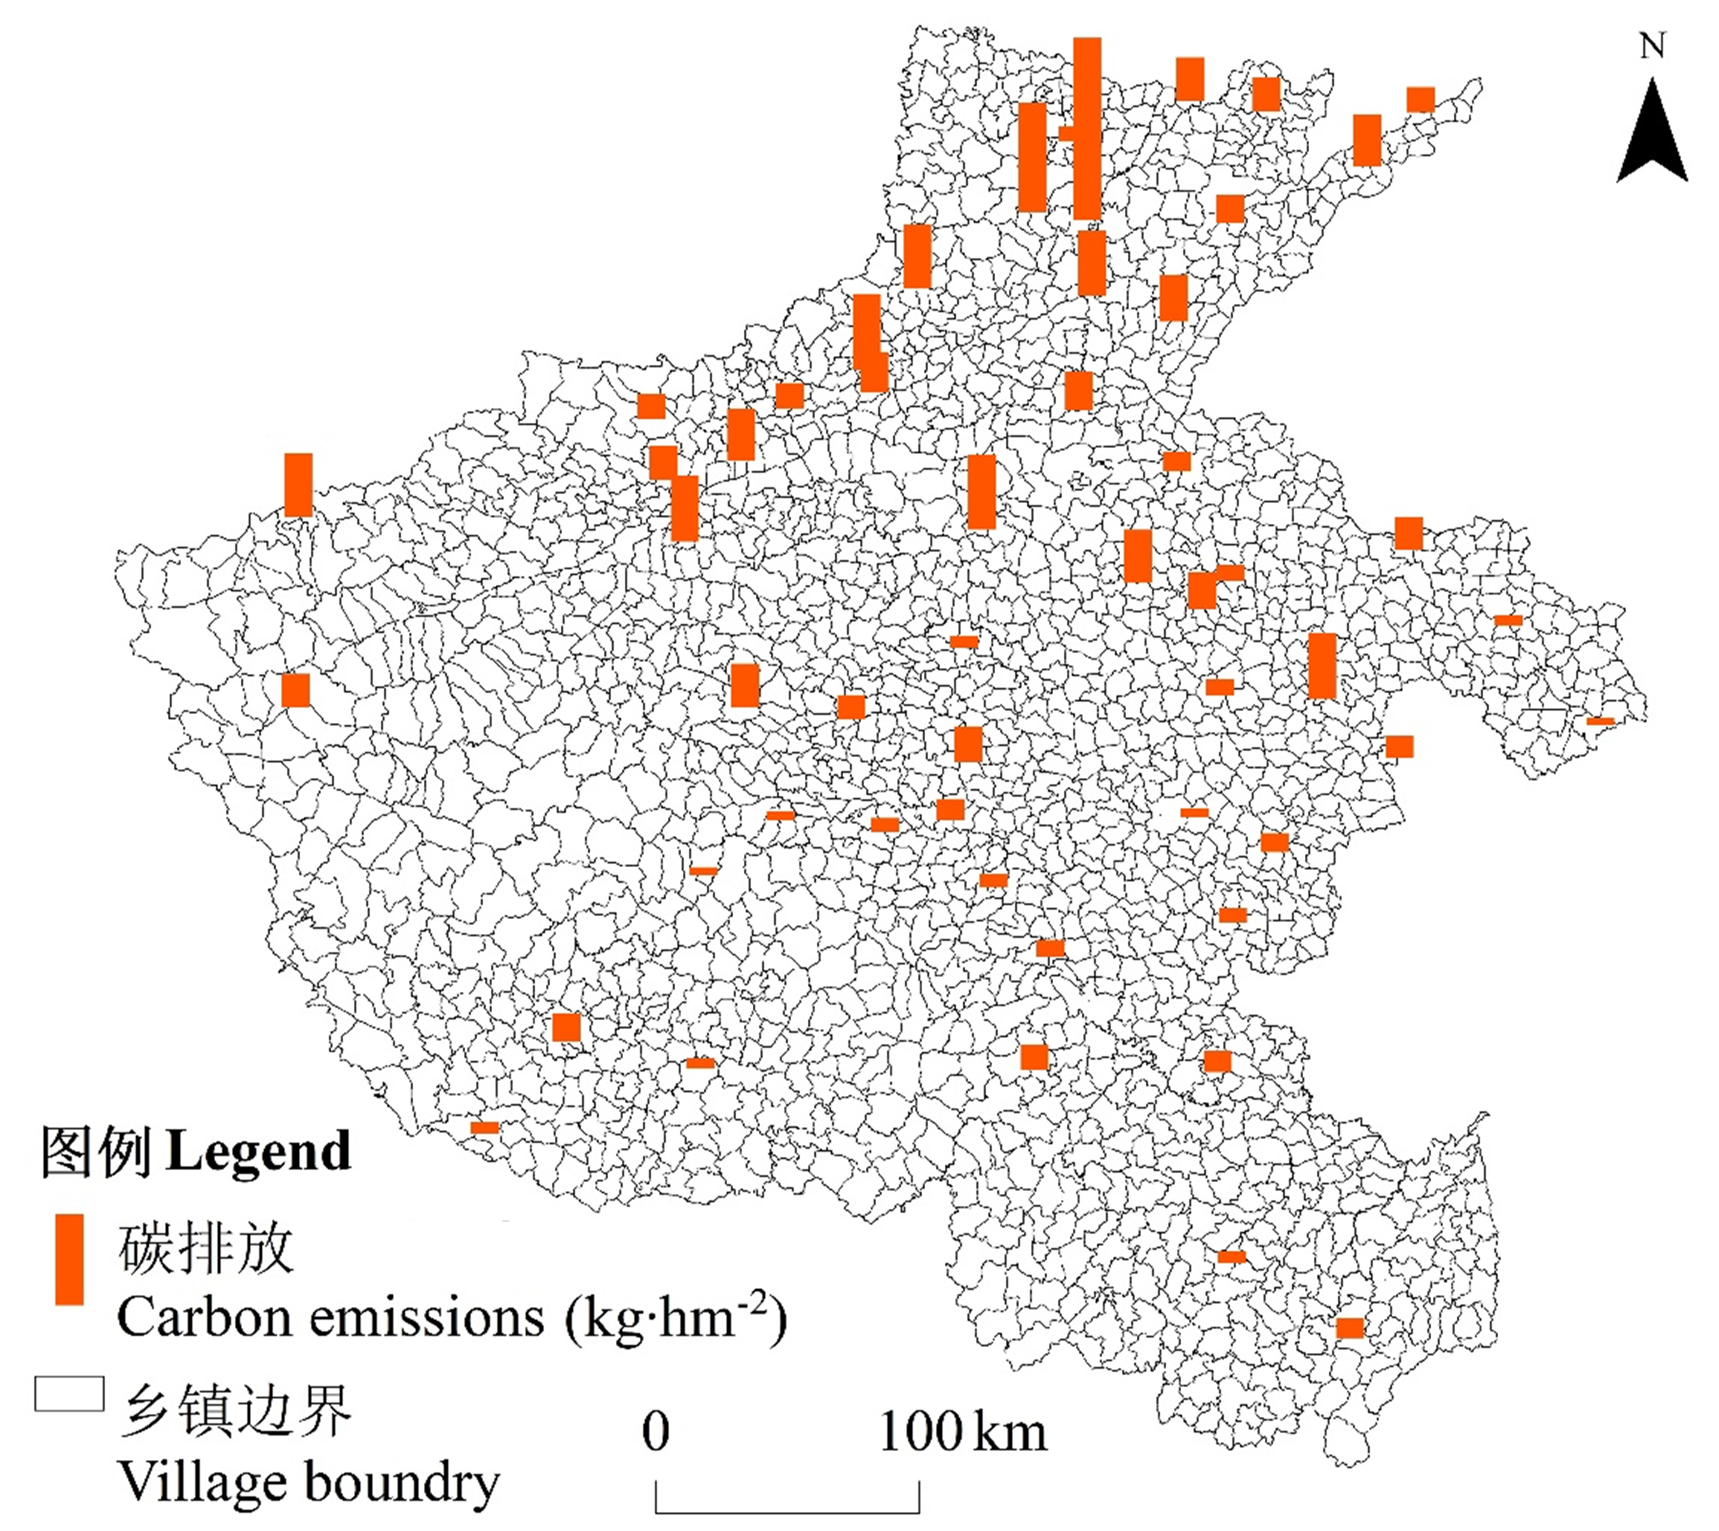
图2
河南省65个调研村庄的冬小麦灌溉碳排放"

图3
河南省乡镇尺度冬小麦灌溉碳排放及其强度空间分布图"
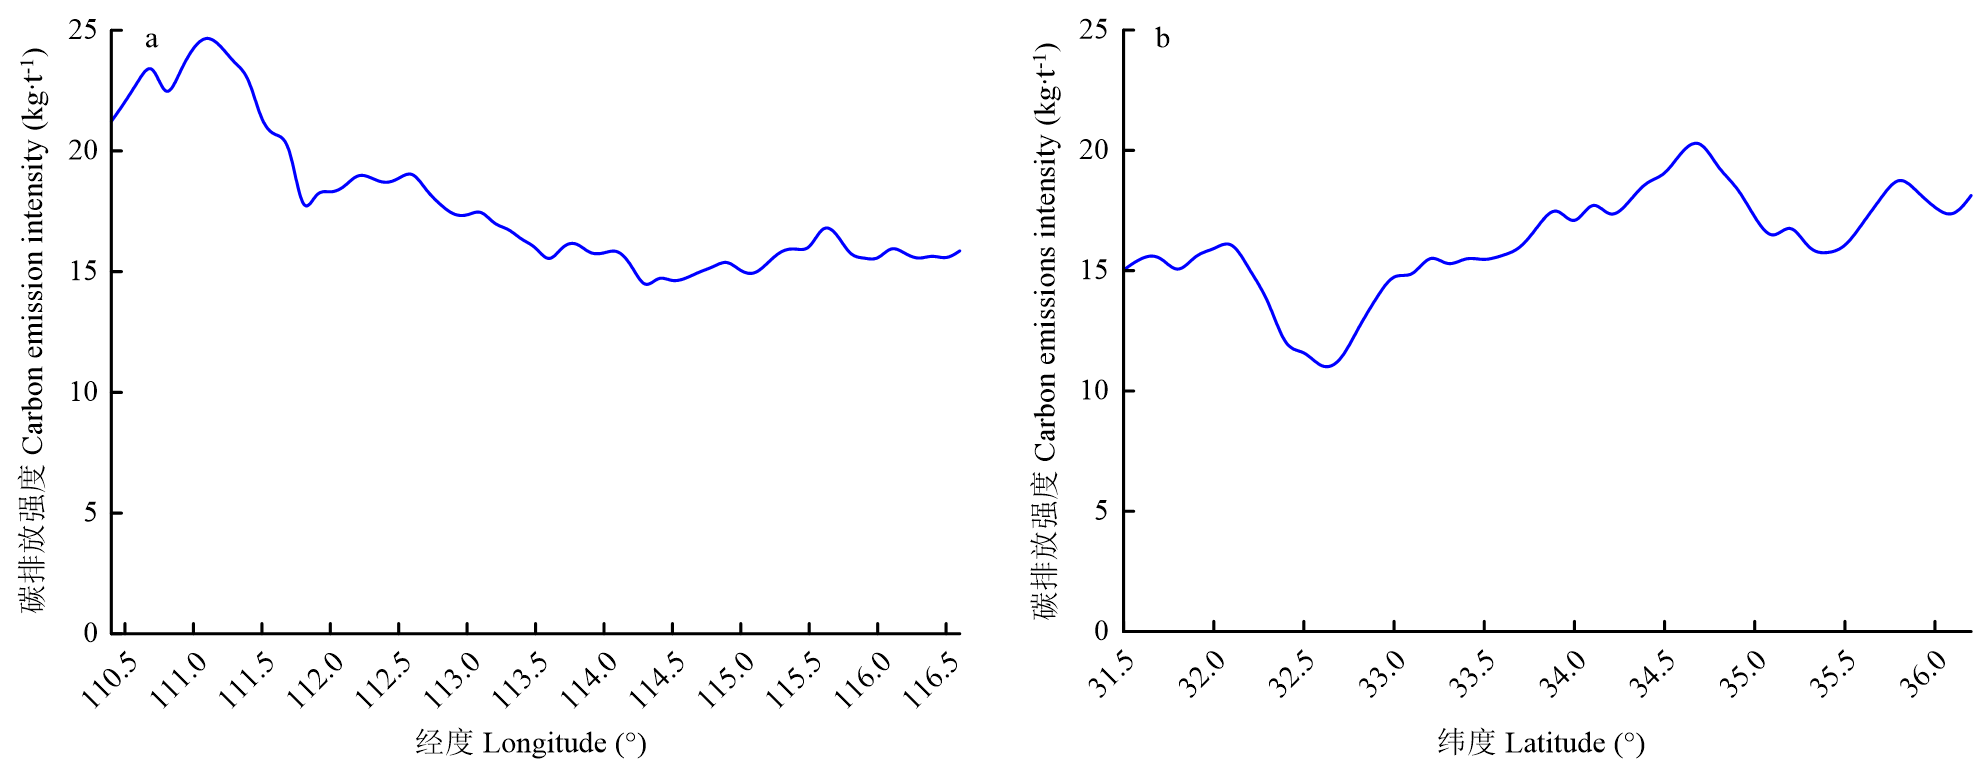
图4
河南省乡镇尺度冬小麦灌溉碳排放强度随经纬度变化 纵坐标为质心相等乡镇灌溉碳排放强度均值"
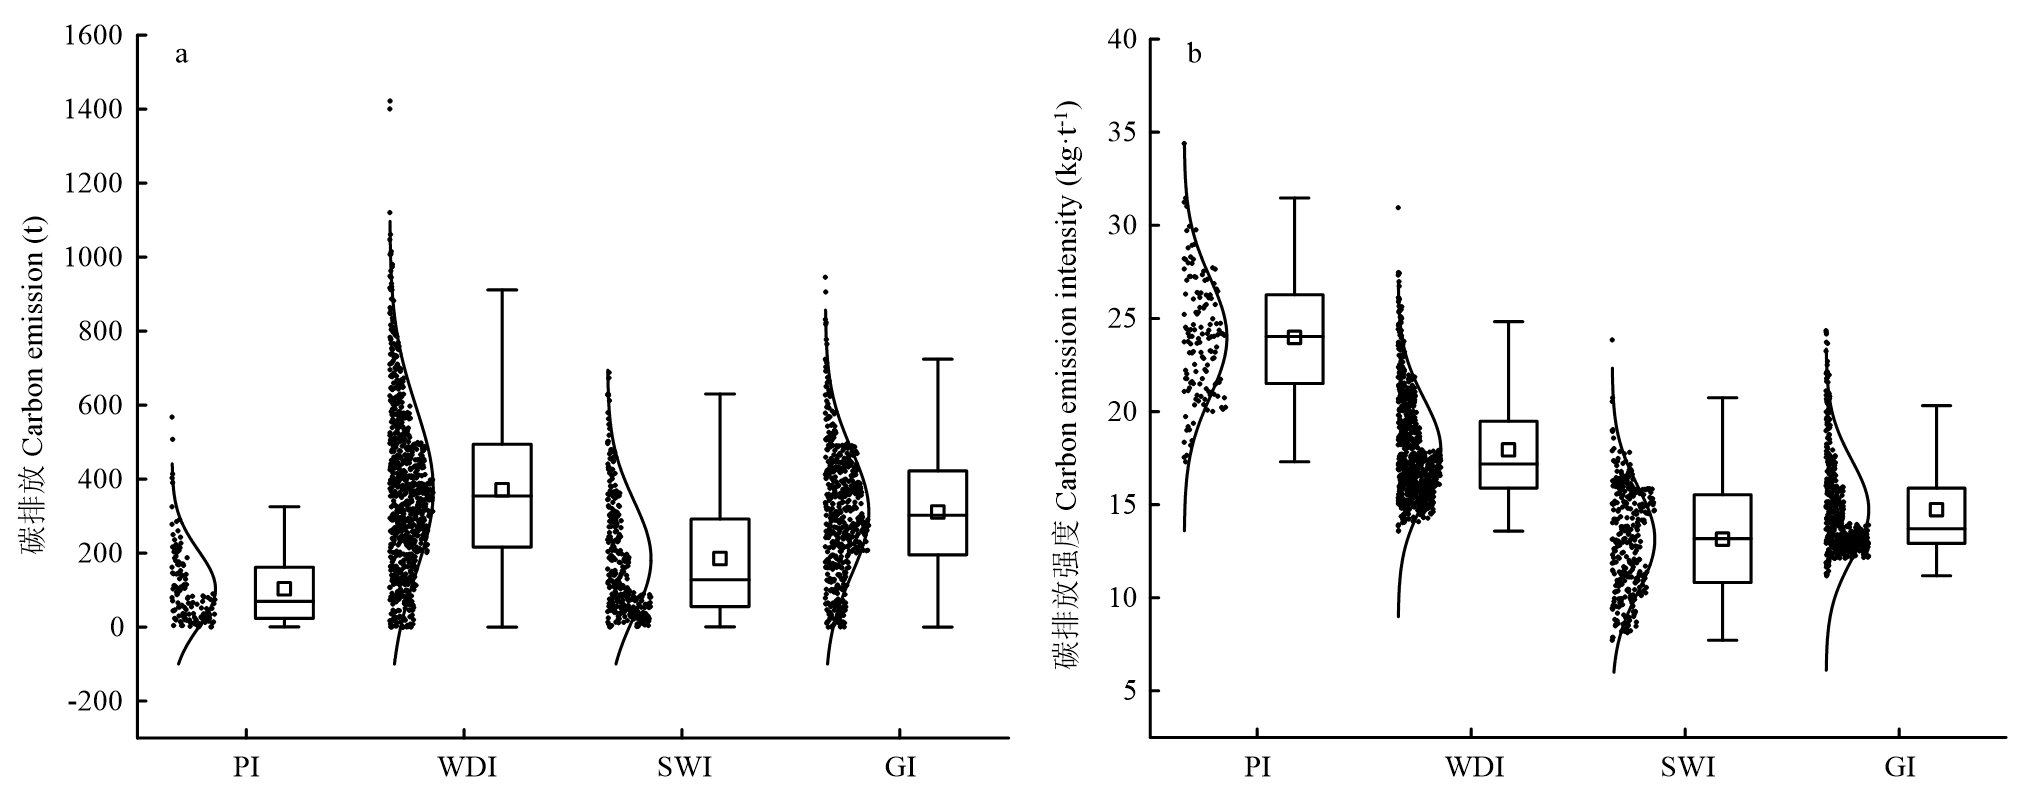
图5
河南省乡镇尺度不同灌溉模式的碳排放及其强度箱型图"
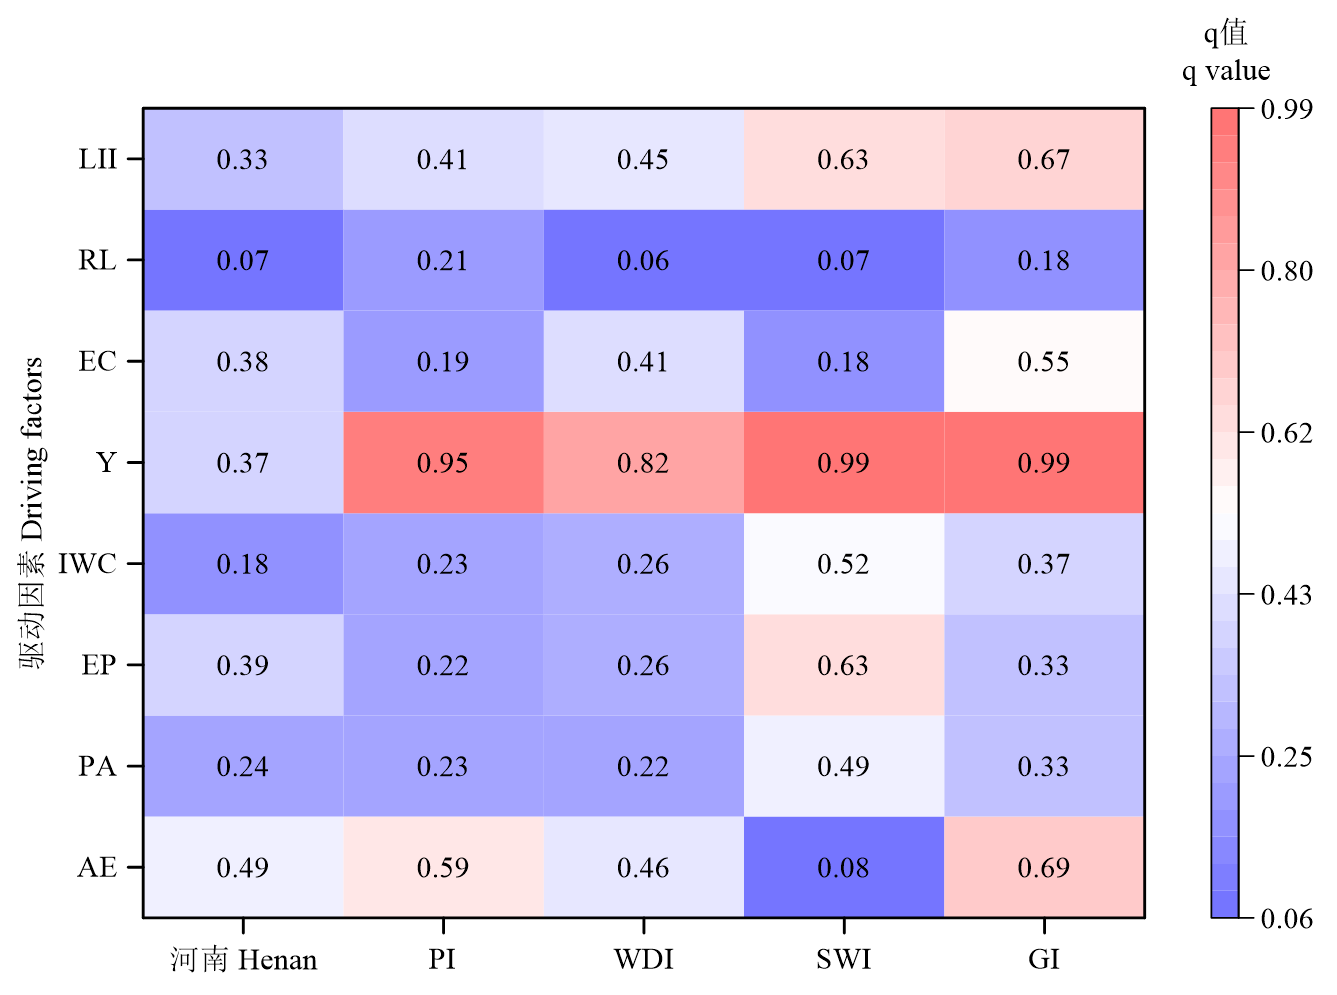
图6
不同灌溉模式下的风险因子探测结果 AE代表平均海拔,EP代表有效降水量,RL代表河流长度,PA代表种植面积,IWC代表灌溉用水量,Y代表产量,EC代表能源,LII代表土地投入强度"

图7
河南省灌溉碳排放强度驱动因素空间分布"
表1
不同灌溉模式下各驱动因素交互作用探测结果"
| 灌溉模式 Irrigation mode | 驱动因素 Driving factors | AE | PA | EP | IWC | Y | EC | RL | LII |
|---|---|---|---|---|---|---|---|---|---|
| 河南省 Henan Province | AE | 0.49 | |||||||
| PA | 0.56 | 0.24 | |||||||
| EP | 0.74 | 0.58 | 0.39 | ||||||
| IWC | 0.53 | 0.29 | 0.61 | 0.18 | |||||
| Y | 0.59 | 0.48 | 0.75 | 0.41 | 0.37 | ||||
| EC | 0.55 | 0.51 | 0.66 | 0.45 | 0.56 | 0.38 | |||
| RL | 0.55 | 0.35 | 0.54 | 0.28 | 0.48 | 0.46 | 0.07 | ||
| LII | 0.56 | 0.38 | 0.68 | 0.38 | 0.51 | 0.51 | 0.44 | 0.33 | |
| PI | AE | 0.59 | |||||||
| PA | 0.73 | 0.23 | |||||||
| EP | 0.79 | 0.58 | 0.22 | ||||||
| IWC | 0.70 | 0.30 | 0.47 | 0.23 | |||||
| Y | 0.97 | 0.96 | 0.97 | 0.96 | 0.95 | ||||
| EC | 0.79 | 0.57 | 0.60 | 0.49 | 0.97 | 0.19 | |||
| RL | 0.78 | 0.53 | 0.68 | 0.46 | 0.97 | 0.53 | 0.21 | ||
| LII | 0.75 | 0.47 | 0.67 | 0.47 | 0.96 | 0.62 | 0.58 | 0.41 | |
| WDI | AE | 0.46 | |||||||
| PA | 0.53 | 0.22 | |||||||
| EP | 0.74 | 0.53 | 0.26 | ||||||
| IWC | 0.52 | 0.31 | 0.59 | 0.26 | |||||
| Y | 0.83 | 0.84 | 0.99 | 0.83 | 0.82 | ||||
| EC | 0.48 | 0.52 | 0.72 | 0.51 | 0.83 | 0.41 | |||
| RL | 0.49 | 0.38 | 0.36 | 0.42 | 0.83 | 0.46 | 0.06 | ||
| LII | 0.64 | 0.50 | 0.75 | 0.48 | 0.87 | 0.63 | 0.57 | 0.45 | |
| SWI | AE | 0.08 | |||||||
| PA | 0.56 | 0.49 | |||||||
| EP | 0.77 | 0.81 | 0.63 | ||||||
| IWC | 0.58 | 0.56 | 0.80 | 0.52 | |||||
| Y | 0.99 | 0.99 | 0.99 | 0.99 | 0.99 | ||||
| EC | 0.21 | 0.63 | 0.79 | 0.63 | 0.99 | 0.18 | |||
| RL | 0.26 | 0.65 | 0.71 | 0.63 | 0.99 | 0.29 | 0.07 | ||
| LII | 0.67 | 0.68 | 0.85 | 0.66 | 0.99 | 0.70 | 0.74 | 0.63 | |
| GI | AE | 0.69 | |||||||
| PA | 0.78 | 0.33 | |||||||
| EP | 0.77 | 0.57 | 0.33 | ||||||
| IWC | 0.78 | 0.42 | 0.63 | 0.37 | |||||
| Y | 0.99 | 0.99 | 0.99 | 0.99 | 0.99 | ||||
| EC | 0.72 | 0.75 | 0.69 | 0.76 | 0.99 | 0.55 | |||
| RL | 0.75 | 0.68 | 0.59 | 0.68 | 0.99 | 0.65 | 0.18 | ||
| LII | 0.84 | 0.77 | 0.80 | 0.74 | 0.99 | 0.83 | 0.80 | 0.67 |
| [1] |
doi: 10.1038/s41558-020-0876-z |
| [2] |
doi: 10.1038/s41467-020-19520-3 |
| [3] |
张扬, 李涵, 赵正豪. 中国粮食作物种植变化对省际农业碳排放量的影响研究. 中国农业资源与区划. https://kns.cnki.net/kcms/detail/11.3513.S.20220831.1438.012.html.
|
|
|
|
| [4] |
杜景新, 赵荣钦, 肖连刚, 杨青林, 王帅, 杨文娟, 张慧芳, 王天俣, 李永涛, 冯浩. 基于“水-能”关联的河南省农业灌溉过程的碳排放研究. 灌溉排水学报, 2020, 39(10): 82-90.
|
|
|
|
| [5] |
doi: 10.1016/j.jclepro.2020.125489 |
| [6] |
赵荣钦, 张帅, 黄贤金, 秦耀辰, 刘英, 丁明磊, 焦士兴. 中原经济区县域碳收支空间分异及碳平衡分区. 地理学报, 2014, 69(10): 1425-1437.
doi: 10.11821/dlxb201410003 |
|
doi: 10.11821/dlxb201410003 |
|
| [7] |
顾张锋, 徐丽华, 马淇蔚, 施益军, 陆张维, 吴亚琪. 浙江省都市区碳排放时空演变及其影响因素. 自然资源学报, 2022, 37(6): 1524-1539.
doi: 10.31497/zrzyxb.20220611 |
|
doi: 10.31497/zrzyxb.20220611 |
|
| [8] |
徐玉秀, 郭李萍, 谢立勇, 云安萍, 李迎春, 张璇, 赵迅, 刁田田. 中国主要旱地农田N2O背景排放量及排放系数特点. 中国农业科学, 2016, 49(9): 1729-1743. doi: 10.3864/j.issn.0578-1752.2016.09.009.
|
|
|
|
| [9] |
doi: 10.1016/S0167-8809(01)00233-X |
| [10] |
doi: 10.1080/17583004.2020.1750265 |
| [11] |
doi: 10.1016/j.agsy.2020.102959 |
| [12] |
白义鑫, 王霖娇, 盛茂银. 黔中喀斯特地区农业生产碳排放实证研究. 中国农业资源与区划, 2021, 42(3): 150-157.
|
|
|
|
| [13] |
doi: 10.1016/j.jclepro.2020.122255 |
| [14] |
田云, 王梦晨. 湖北省农业碳排放效率时空差异及影响因素. 中国农业科学, 2020, 53(24): 5063-5072. doi: 10.3864/j.issn.0578-1752.2020.24.009.
|
|
|
|
| [15] |
doi: 10.1038/srep36912 pmid: 27830739 |
| [16] |
李明琦, 刘世梁, 武雪, 孙永秀, 侯笑云, 赵爽. 云南省农田生态系统碳足迹时空变化及其影响因素. 生态学报, 2018, 38(24): 8822-8834.
|
|
|
|
| [17] |
谢花林, 黄萤乾. 非农就业与土地流转对农户耕地撂荒行为的影响: 以闽赣湘山区为例. 自然资源学报, 2022, 37(2): 408-423.
doi: 10.31497/zrzyxb.20220210 |
|
doi: 10.31497/zrzyxb.20220210 |
|
| [18] |
刘晔, 刘丹, 张林秀. 中国省域城镇居民碳排放驱动因素分析. 地理科学, 2016, 36(5): 691-696.
doi: 10.13249/j.cnki.sgs.2016.05.006 |
|
doi: 10.13249/j.cnki.sgs.2016.05.006 |
|
| [19] |
王劲峰, 徐成东. 地理探测器: 原理与展望. 地理学报, 2017, 72(1): 116-134.
doi: 10.11821/dlxb201701010 |
|
doi: 10.11821/dlxb201701010 |
|
| [20] |
张振龙, 孙慧, 苏洋. 中国西北干旱地区农牧业生态系统碳排放的空间分布与演变趋势. 生态学报, 2017, 37(16): 5263-5272.
|
|
|
|
| [21] |
doi: 10.1016/j.landusepol.2017.12.029 |
| [22] |
王帅, 赵荣钦, 苏辉, 冯德显, 肖连刚, 杨青林, 熊涛, 杨文娟. 河南省典型区农业水土资源开发的碳排放效应研究. 华北水利水电大学学报(自然科学版), 2019, 40(1): 71-78.
|
|
|
|
| [23] |
doi: 10.1016/j.agee.2016.05.023 |
| [24] |
刘琼, 肖海峰. 农地经营规模与财政支农政策对农业碳排放的影响. 资源科学, 2020, 42(6): 1063-1073.
doi: 10.18402/resci.2020.06.05 |
|
doi: 10.18402/resci.2020.06.05 |
|
| [25] |
田云, 张俊飚, 李波. 中国粮食主产区农业碳排强度估算及其分析. 地理科学进展, 2012, 31(11): 1546-1551.
|
|
doi: 10.11820/dlkxjz.2012.11.016 |
|
| [26] |
doi: 10.1016/j.oneear.2023.04.010 |
| [27] |
doi: 10.1016/j.agee.2023.108535 |
| [28] |
王晓云, 蔡焕杰, 李亮, 徐家屯, 陈慧. 亏缺灌溉对冬小麦农田温室气体排放的影响. 环境科学, 2019, 40(5): 2413-2425.
|
|
|
|
| [29] |
doi: 10.1038/s41586-018-0594-0 |
| [30] |
doi: 10.1016/j.agwat.2022.107685 |
| [31] |
许尔琪. 中国农业资源环境分区数据集. 全球变化数据学报(中英文), 2021, 5(1): 19-26.
|
|
|
|
| [32] |
王帅, 赵荣钦, 杨青林, 肖连刚, 杨文娟, 余娇, 朱瑞明, 揣小伟, 焦士兴. 碳排放约束下的农业生产效率及其空间格局: 基于河南省65个村庄的调查. 自然资源学报, 2020, 35(9): 2092-2104.
doi: 10.31497/zrzyxb.20200905 |
|
doi: 10.31497/zrzyxb.20200905 |
|
| [33] |
张峰, 吴炳方, 罗治敏. 美国冬小麦产量遥感预测方法. 遥感学报, 2004, 8(6): 611-617.
|
|
|
|
| [34] |
doi: 10.3390/rs13061162 |
| [35] |
doi: 10.3906/tar-1312-90 |
| [36] |
王帅, 赵荣钦, 韩枫, 黄会平, 张师赫, 熊涛, 张笑荣, 石金鑫. 河南省农作物虚拟水与隐含碳排放的时空格局及关联机制研究. 华北水利水电大学学报(自然科学版), 2020, 41(2): 72-80.
|
|
|
|
| [37] |
doi: 10.1016/j.jhydrol.2020.125388 |
| [38] |
doi: 10.1016/j.agwat.2020.106264 |
| [39] |
张志高, 袁征, 李贝歌, 张宏亮, 张玉, 郑美洁. 基于投入视角的河南省农业碳排放时空演化特征与影响因素分解. 中国农业资源与区划, 2017, 38(10): 152-161.
|
|
|
|
| [40] | |
|
|
|
| [41] |
doi: 10.1016/j.resconrec.2021.105709 |
| [1] | 朱琦, 贾振鹏, Tahir SHAH, 徐晨晟, 李芷琦, 吕会帅, 朱鹏超, 韦小敏, 黄冬琳, 孙艳妮, 曹卫东, 高亚军, 王朝辉, 张达斌. 绿肥配施增效产品降低旱地麦田温室气体排放及碳足迹[J]. 中国农业科学, 2026, 59(7): 1507-1522. |
| [2] | 钱瑾, 李映雪, 吴芳, 邹晓晨. 集成光谱降维的冬小麦叶片磷含量估算[J]. 中国农业科学, 2026, 59(4): 781-792. |
| [3] | 孔媛, 崔沙沙, 李美, 李健, 杨思雨, 房锋, 刘帅帅, 刘明平, 曾艳, 高兴祥, 柏连阳. 黄淮海冬小麦田多花黑麦草等5种禾本科杂草时空分布变化规律[J]. 中国农业科学, 2026, 59(4): 807-823. |
| [4] | 咸青林, 肖鉴珂, 高阿庆, 郜利闯, 刘杨. 种植方式结合测墒补灌下冬小麦产量及水分利用效率[J]. 中国农业科学, 2026, 59(3): 589-601. |
| [5] | 李贝, 郑家喜, 张蕙杰. 中国种植业生态效率区域差异、空间集聚与动态演进[J]. 中国农业科学, 2026, 59(3): 687-704. |
| [6] | 王佳美, 徐奉奇, 周慧, 胡向东. 我国农业社会化服务发展现状、地区性特征及国际经验镜鉴[J]. 中国农业科学, 2026, 59(2): 459-474. |
| [7] | 吕旭东, 孙世媛, 李亚楠, 刘玉龙, 王艳群, 付鑫, 张佳英, 宁鹏, 彭正萍. 智能机械化分层施肥对麦田根-土养分分布和小麦产量的影响[J]. 中国农业科学, 2026, 59(1): 129-146. |
| [8] | 蒲丽霞, 张佳芮, 叶建萍, 黄秀兰, 樊高琼, 杨洪坤. 二氢赤霉素与秸秆覆盖对旱地小麦分蘖成穗与产量的影响[J]. 中国农业科学, 2025, 58(9): 1735-1748. |
| [9] | 史帆, 李文广, 易树生, 杨娜, 陈玉萌, 郑伟, 张雪辰, 李紫燕, 翟丙年. 有机无机肥配施下旱地麦田土壤有机碳组分含量的变化特征[J]. 中国农业科学, 2025, 58(4): 719-732. |
| [10] | 郑煜, 陈颐, 遆晋松, 史龙飞, 许校博, 李昱霖, 郭瑞. 烟草不同轮作模式碳足迹及经济效益评价[J]. 中国农业科学, 2025, 58(4): 733-747. |
| [11] | 房康睿, 丁世杰, 陈雨珊, 杨秉庚, 郭腾飞, 徐新朋, 赵士诚, 王秀斌, 黄绍敏, 仇少君, 何萍, 周卫. 有机无机肥配施下典型潮土小麦季有机肥氮磷的当季释放率[J]. 中国农业科学, 2025, 58(24): 5234-5246. |
| [12] | 佘映军, 周子哲, 伍明, 郭魏, 师昌健, 胡超, 李平. 地下水埋深和施氮对土壤水盐分布及冬小麦养分吸收利用的影响[J]. 中国农业科学, 2025, 58(20): 4285-4304. |
| [13] | 尹忞昊, 陈池波, 卢奕亨, 田云. 中国农业碳排放密度的时空特征、动态演进与空间效应[J]. 中国农业科学, 2025, 58(18): 3710-3727. |
| [14] | 王荣荣, 徐宁璐, 黄修利, 赵凯男, 黄明, 王贺正, 付国占, 吴金芝, 李友军. 一次灌溉和氮肥运筹对旱地小麦籽粒产量和品质的影响[J]. 中国农业科学, 2025, 58(1): 43-57. |
| [15] | 高兴祥, 孔媛, 张耀中, 李美, 李健, 金岩, 张国福, 刘帅帅, 刘明平, 曾艳, 柏连阳. 河南省冬小麦田杂草群落分布现状及其变化原因分析[J]. 中国农业科学, 2025, 58(1): 91-100. |
|
||