


中国农业科学 ›› 2022, Vol. 55 ›› Issue (6): 1110-1126.doi: 10.3864/j.issn.0578-1752.2022.06.005
蔡苇荻( ),张羽,刘海燕,郑恒彪,程涛,田永超,朱艳,曹卫星,姚霞()
收稿日期:2021-05-25
接受日期:2021-09-06
出版日期:2022-03-16
发布日期:2022-03-25
联系方式:
蔡苇荻,E-mail: 2019101180@njau.edu.cn。
基金资助:
CAI WeiDi(),ZHANG Yu,LIU HaiYan,ZHENG HengBiao,CHENG Tao,TIAN YongChao,ZHU Yan,CAO WeiXing,YAO Xia()
Received:2021-05-25
Accepted:2021-09-06
Published:2022-03-16
Online:2022-03-25
摘要:
【目的】本研究利用近地面成像高光谱仪,获取接种白粉病菌后的小麦田间冠层时序影像,探索光谱信息与纹理信息的结合在冠层尺度上早期监测小麦白粉病的能力和表现。【方法】本试验以不同年份、不同抗病性小麦品种的田间试验为基础,利用连续小波(continuous wavelet transform,CWT)方法提取对小麦白粉病敏感的小波特征,并基于小波特征获取对应的纹理特征,用以构建归一化纹理指数(normalized difference texture index,NDTI),同时选取具有代表性的传统植被指数(vegetation indices,VIs),然后利用偏最小二乘判别分析模型(partial least squares-linear discrimination analysis,PLS-LDA)基于上述特征及组合,建立小麦冠层健康与感病状态识别模型,并利用偏最小二乘回归(partial least-squares regression,PLSR)构建了小麦冠层病情严重度估测模型,并利用该技术基于最优特征及组合判别接种后不同天数的小麦健康与感病状态。【结果】基于CWT算法入选的4个小波特征分别是6尺度的595 nm(黄光区域),5尺度的614 nm(红光区域),3尺度的708 nm(近红外区域)和4尺度的754 nm(近红外区域);进一步确定了构建最佳纹理指数组合的纹理特征有:754 nm处的熵(entropy,ENT)、均值(mean,MEA)、均一性(homogeneity,HOM),7 008 nm处的ENT、HOM,614 nm处的ENT、HOM、异质性(dissimilarity, DIS),595 nm处的ENT、HOM、DIS。其中,近红外波段754 nm处的纹理特征MEA表现最优越,与病情严重度的相关性最高(R2=0.67)。本研究进一步发现基于小波特征与纹理特征结合构建的小麦健康与病害判别PLS-LDA模型的精度最高,其总体分类精度为81.17%,Kappa系数为0.63;基于光谱指数与纹理指数组合构建的小麦病情严重度PLSR模型效果最优,建模和检验R2分别为0.76和0.71。本研究中最早能够识别的小麦冠层白粉病的病情严重度为26%左右(接种后24 d左右)。【结论】基于小波特征与纹理特征结合构建的小麦健康与病害识别模型能够显著提高病害的分类精度,而光谱指数与纹理指数的特征组合能够显著提高病情严重度的估测精度以及稳定性。本研究方法和结果可为其他作物的病害监测提供借鉴和参考,对现代智慧农业的精确施药提供了技术支持。
蔡苇荻,张羽,刘海燕,郑恒彪,程涛,田永超,朱艳,曹卫星,姚霞. 基于成像高光谱的小麦冠层白粉病早期监测方法[J]. 中国农业科学, 2022, 55(6): 1110-1126.
CAI WeiDi,ZHANG Yu,LIU HaiYan,ZHENG HengBiao,CHENG Tao,TIAN YongChao,ZHU Yan,CAO WeiXing,YAO Xia. Early Detection on Wheat Canopy Powdery Mildew with Hyperspectral Imaging[J]. Scientia Agricultura Sinica, 2022, 55(6): 1110-1126.
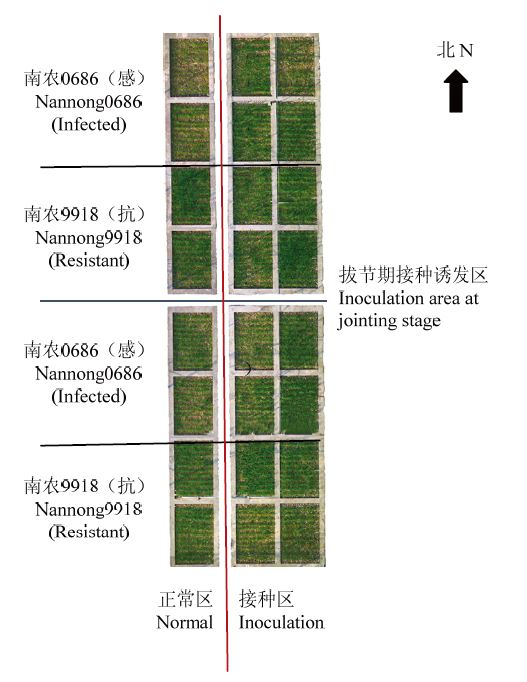
图1
冠层试验区"
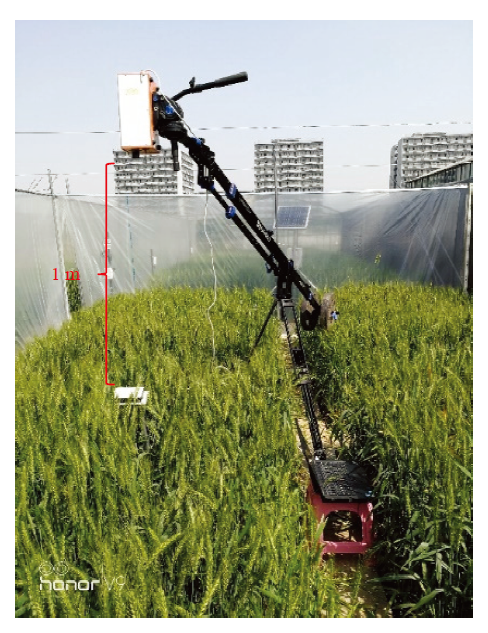
图2
冠层测试"
表1
冠层数据获取时间"
| 2018 | 测试日期 Test date | ||||||||||||
|---|---|---|---|---|---|---|---|---|---|---|---|---|---|
| 04-09 | 04-17 | 04-19 | 04-25 | 04-28 | 05-03 | 05-09 | |||||||
| 接种后天数DAI | 8 | 16 | 18 | 24 | 27 | 32 | 38 | ||||||
| 样本数量Sample number | 14 | 13 | 14 | 14 | 14 | 14 | 13 | ||||||
| 2017 | 测试日期 Test date | ||||||||||||
| 03-27 | 04-01 | 04-13 | 04-22 | 04-28 | 05-10 | ||||||||
| 接种后天数DAI | 6 | 11 | 23 | 32 | 38 | 50 | |||||||
| 样本数量Sample number | 6 | 6 | 10 | 12 | 12 | 12 | |||||||
表2
基于二阶概率统计的纹理特征"
| 名称Name | 函数表达式Function expression | 描述Description |
|---|---|---|
| 均值 Mean, MEA | $\sum_{i, j=0}^{N=j} i \times P_{i, j}$ | 反映了灰度平均值情况 Reflect the gray mean value |
| 方差 Variance, VAR | $\sum\limits_{i,j=0}^{N-1}{i\times {{P}_{i,j}}{{(i-MEA)}^{2}}}$ | 反映了灰度变化的大小Reflect the change of grayscale |
| 均一性 Homogeneity, HOM | $\sum_{i=0}^{N-1} \sum_{j=0}^{N-1} P_{i, j} P_{i, j} /\left[1+(i+j)^{2}\right]$ | 反映了纹理局部同质性Reflect local homogeneity of texture |
| 对比度 Contrast, CON | $\sum_{n=0}^{N-1} n^{2}\left\{\sum_{i=0}^{N-1} \sum_{\substack{j=0 \\|i-j|=n}}^{N-1} P_{i, j}\right\}$ | 反映了纹理的清晰度Reflect texture sharpness |
| 异质性 Dissimilarity, DIS | $\sum_{i, j=0}^{N-1} i \times P_{i, j}|i-j|$ | 反映纹理的相似性Reflect texture similarity |
| 熵 Entropy, ENT | $\sum_{i=0}^{N-1} \sum_{j=0}^{N-1} P_{i, j} \log P_{i, j}$ | 反映图像具有的信息量Reflect the amount of image information |
| 角二阶矩 Second Moment, SEM | $\sum_{i, j=0}^{N=j} i \times P_{i, j}^{2}$ | 反映了图像灰度分布的均匀性 Reflect the uniformity of image gray distribution |
| 相关性 Correlation, COR | $\left[\sum_{i=0}^{N-1} \sum_{j=0}^{N-1} i j P_{i, j}-u_{1} u_{2}\right] / \sigma_{1} \sigma_{2}$ | 反映某种灰度值沿某个方向的延伸长度 Reflect the extension length of some gray value along a certain direction |
表3
本研究中所用植被指数"
| 定义 Definition | 方程 Equation | 相关生理参数 Relative physical parameter |
|---|---|---|
| 白粉病指数 Powdery mildew index, PMI | (R515-R698)/(R515+R698)-0.5×R738 | 小麦病害Wheat disease[ |
| 简单修改比 Modified simple ratio, MSR | (R800/R670 -1)/ (R800/R670 + 1)1/2 | 叶面积Leaf area[ |
| 光化学反射指数 Photochemical reflectance index, PRI | (R570- R531)/ (R570 + R531) | 光合辐射Photosynthetic radiation[ |
| 光合辐射 Photosynthetic radiation, PhRI | (R550 - R531)/ (R550 + R531) | 光合利用效率Light use efficiency[ |
| 改进的叶绿素吸收比指数 Modified chlorophyll absorption ratio index, MCARI | [(R701-R671)-0.2(R701-R549)]/(R701/R671) | 叶绿素吸收Chlorophyll absorption[ |
| 花青素反射指数 Anthocyanin reflectance index, ARI | R550-1-R700-1 | 花青素含量Anthocyanin content[ |
| 与结构无关的色素指数 Structure independent pigment index, SIPI | (R800 - R445)/(R800 - R680) | 色素含量Pigment content[ |
| 归一化色素叶绿素比值指数 Normalized pigment chlorophyll ration index, NPCI | (R680 - R430)/(R680 + R430) | 叶绿素比值Chlorophyll ratio[ |
| 红边植被胁迫指数 Red-edge vegetation stress index, RVSI | [(R712 + R752)/2] - R732 | 生物量Biomass[ |
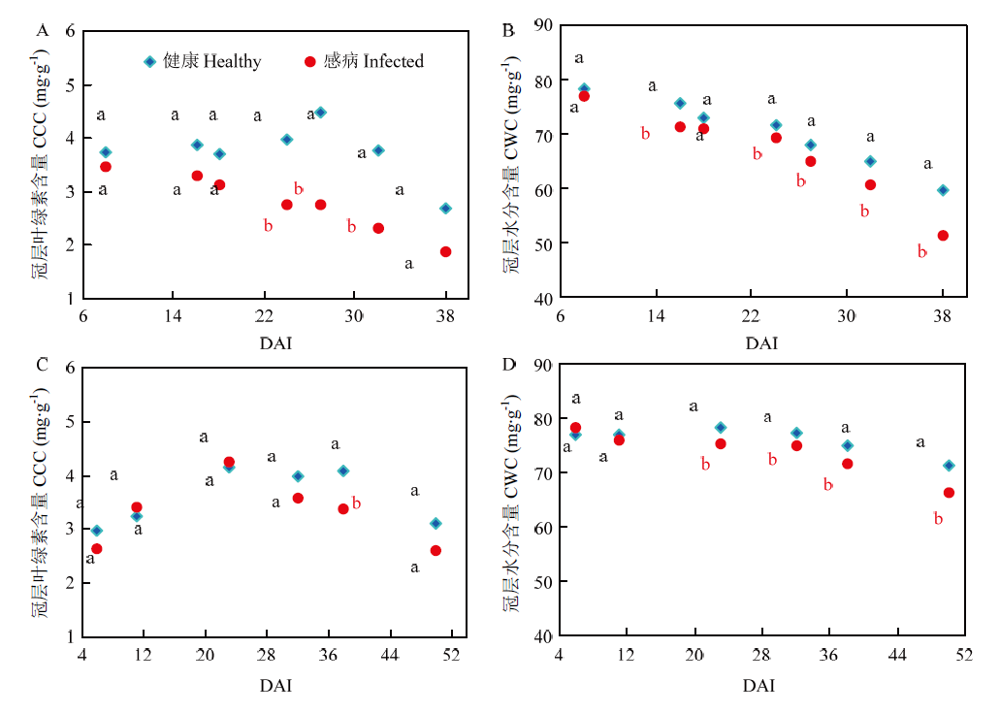
图3
健康冠层与感病冠层的叶绿素含量和水分含量的变化和比较 a代表差异不显著;b代表差异显著(P<0.05)。A、B代表2018年;C、D代表2017年"

图4
健康与感病小麦冠层光谱反射率的时序变化 8 d(4%)代表数据在接种后第8天测试光谱反射率,该天感病冠层平均病情严重度为4%,其余类似"
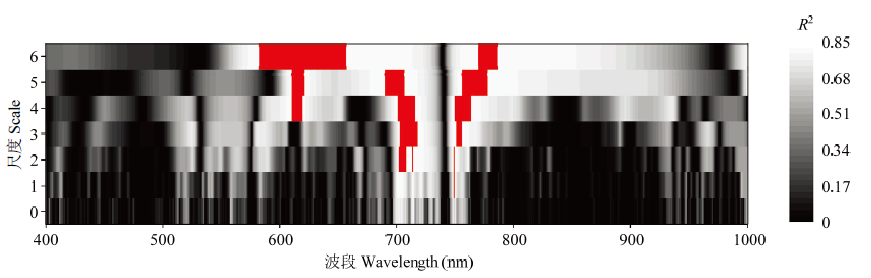
图5
不同尺度下的连续小波系数与病情严重度的相关系数图 相关系数图表示小波系数与冠层病情严重度的决定系数(R2)。红色部分表示最高的前5% R2区域"
表4
基于入选的病害敏感小波区域选取的小波特征"
| 光谱区域 Spectral region | 入选波段 Selected wavelength | 尺度 Scale | 决定系数 R2 |
|---|---|---|---|
| 黄光区域Yellow region | 595 | 6 | 0.82 |
| 红光区域Red region | 614 | 5 | 0.83 |
| 近红外区域Near infrared region | 708 | 3 | 0.85 |
| 近红外区域Near infrared region | 754 | 4 | 0.84 |
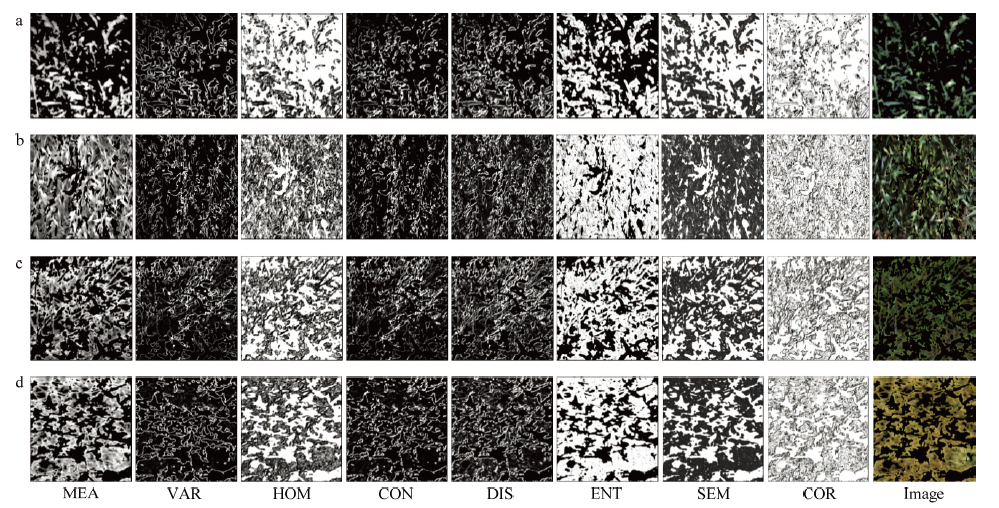
图6
近红外波段在小麦冠层接种后第8天和接种后第38天的健康冠层与感病冠层的纹理特征对比图 a:健康,b:感病,c:健康,d:感病。MEA、VAR、HOM、CON、DIS、ENT、SEM、COR 分别代表均值、方差、均一性、对比度、异质性、熵、角二阶矩、相关性"
表5
与病情严重度相关性最高的前10个纹理指数"
| 模型 Model | 纹理指数 Texture index | 入选纹理 Selected texture | 决定系数 Determinant (R2) | |
|---|---|---|---|---|
| T1 | T2 | |||
| 线性模型 Linear model | NDTI (T1, T2) | ENT754 | MEA754 | 0.51 |
| MEA754 | ENT708 | 0.50 | ||
| MEA754 | ENT595 | 0.50 | ||
| MEA754 | ENT614 | 0.50 | ||
| MEA754 | HOM708 | 0.47 | ||
| MEA754 | HOM595 | 0.47 | ||
| MEA754 | HOM614 | 0.46 | ||
| HOM754 | MEA754 | 0.46 | ||
| MEA754 | DIS595 | 0.46 | ||
| MEA754 | DIS614 | 0.45 | ||
表6
纹理特征与病情严重度的线性关系"
| 纹理特征 Texture feature | 小波特征 Wavelet feature | |||
|---|---|---|---|---|
| 595 nm | 614 nm | 708 nm | 754 nm | |
| 均值 MEA | 0.00ns | 0.00ns | 0.01ns | 0.67*** |
| 方差 VAR | 0.29*** | 0.31*** | 0.29*** | 0.01ns |
| 均一性 HOM | 0.25** | 0.23** | 0.27** | 0.27** |
| 对比度 CON | 0.27*** | 0.29*** | 0.27*** | 0.01ns |
| 异质性 DIS | 0.28** | 0.30*** | 0.28*** | 0.08** |
| 熵 ENT | 0.30ns | 0.26ns | 0.35ns | 0.38ns |
| 角二阶矩 SEM | 0.28*** | 0.27*** | 0.28*** | 0.28*** |
| 相关性 COR | 0.01ns | 0.02ns | 0.03ns | 0.01ns |
表7
基于不同特征的小麦冠层健康与感病状态识别模型的判别结果"
| 输入特征 Input feature | 特征数量 Number of features | 分类精度 Classification accuracy (%) | 总体分类精度 OAA (%) | 卡帕系数 Kappa | |
|---|---|---|---|---|---|
| 健康 Healthy | 感病 Infected | ||||
| 小波特征与纹理特征结合 WFs & TFs | 36 | 92.54 | 72.41 | 81.17 | 0.63 |
| 光谱指数 VIs | 9 | 89.55 | 70.11 | 78.57 | 0.58 |
| 光谱指数与纹理指数结合 VIs & NDTIs | 19 | 86.57 | 71.26 | 77.92 | 0.56 |
| 纹理特征 TFs | 32 | 85.07 | 71.26 | 77.27 | 0.55 |
| 纹理指数 NDTIs | 10 | 77.61 | 70.11 | 73.38 | 0.47 |
| 小波特征 WFs | 4 | 82.09 | 64.37 | 72.08 | 0.45 |
表8
基于不同特征的PLSR回归表现"
| 输入特征 Input feature | 特征数量 Number of features | 建模 Calibration | 检验 Validation | |||
|---|---|---|---|---|---|---|
| R2 | RMSE | R2 | RMSE | RRMSE | ||
| 小波特征与纹理特征结合WFs & TFs | 36 | 0.8 | 8.13 | 0.68 | 11.84 | 0.39 |
| 光谱指数VIs | 9 | 0.76 | 8.70 | 0.69 | 11.54 | 0.38 |
| 光谱指数与纹理指数结合VIs & NDTIs | 19 | 0.76 | 8.89 | 0.71 | 11.30 | 0.38 |
| 纹理特征TFs | 32 | 0.72 | 9.42 | 0.42 | 15.94 | 0.53 |
| 小波特征WFs | 4 | 0.64 | 9.72 | 0.61 | 12.93 | 0.43 |
| 纹理指数NDTIs | 10 | 0.59 | 9.85 | 0.47 | 15.31 | 0.51 |
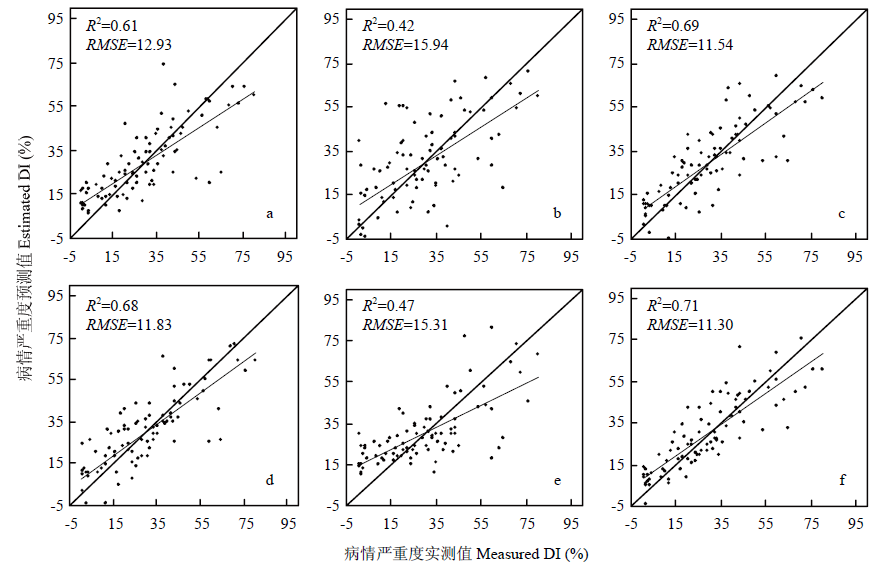
图7
冠层病情严重度的实测值与预测值之间的1:1散点图"
表9
基于小波特征与纹理特征结合的PLS-LDA判别结果"
| 年份 Year | 分类精度 Classification accuracy (%) | |||||||||||||
|---|---|---|---|---|---|---|---|---|---|---|---|---|---|---|
| 8d(7.4%) | 16d(15.9%) | 18d(26.2%) | 24d(27.7%) | 27d(32.3%) | 32d(41.7%) | 38d(63.2%) | ||||||||
| 2018 | 健康Healthy | 83.33 | 100 | 83.33 | 100 | 100 | 100 | 100 | ||||||
| 感病Infected | 75.00 | 100 | 75.00 | 100 | 100 | 100 | 100 | |||||||
| Kappa | 0.57 | 0.56 | 0.57 | 0.84 | 1 | 1 | 1 | |||||||
| 6d(1.5%) | 11d(8.9%) | 23d(25.2%) | 32d(26.2%) | 38d(33%) | 50d(33%) | |||||||||
| 2017 | 健康Healthy | 66.67 | 61.67 | 71.67 | 100 | 100 | 100 | |||||||
| 感病Infected | 66.67 | 75.00 | 77.50 | 100 | 100 | 100 | ||||||||
| Kappa | 0.33 | 0.5 | 0.55 | 0.85 | 1 | 1 | ||||||||
| [18] |
MAHLEIN A K, RUMPF T, WELKE P, DEHNE H W, PLUEMER L, STEINER U, OERKE E C. Development of spectral indices for detecting and identifying plant diseases. Remote Sensing of Environment, 2013,128:21-30.
doi: 10.1016/j.rse.2012.09.019 |
| [19] |
ZHENG Q, HUANG W, CUI X, DONG Y, SHI Y, MA H, LIU L. Identification of wheat yellow rust using optimal three-band spectral indices in different growth stages. Sensors, 2019,19(1):35.
doi: 10.3390/s19010035 |
| [20] | 王娜. 基于图像处理的玉米叶部病害识别研究[D]. 石河子: 石河子大学, 2009. |
| WANG N. Research on maize leaf disease recognition based on image processing[D]. Shihezi: Shihezi University, 2009. (in Chinese) | |
| [21] | 昌腾腾. 基于支持向量机的小麦病害识别研究[D]. 泰安: 山东农业大学, 2015. |
| CHANG T T. Research on wheat disease recognition based on Support vector Machine[D]. Taian: Shandong Agricultural University, 2015. (in Chinese) | |
| [22] | 袁琳. 小麦病虫害多尺度遥感识别和区分方法研究[D]. 杭州: 浙江大学, 2015. |
| YUAN L. Identification and differentiation of wheat disease and insects with multi-source and multi-scale remote sensing data[D]. Hangzhou: Zhejiang University, 2015. (in Chinese) | |
| [23] |
YAO X, HUANG Y, SHANG G, ZHOU C, CHENG T, TIAN Y, CAO W, ZHU Y. Evaluation of six algorithms to monitor wheat leaf nitrogen concentration. Remote Sensing, 2015,7(11):14939-14966.
doi: 10.3390/rs71114939 |
| [24] |
ZHOU K, CHENG T, ZHU Y, CAO W, USTIN S L, ZHENG H, YAO X, TIAN Y. Assessing the impact of spatial resolution on the estimation of leaf nitrogen concentration over the full season of paddy rice using near-surface imaging spectroscopy data. Frontiers in Plant Science, 2018,9:964.
doi: 10.3389/fpls.2018.00964 |
| [1] |
BOWEN K L, EVERTS K L, LEATH S. Reduction in yield of winter wheat in North Carolina due to powdery mildew and leaf rust. Phytopathology, 1991,81(5):503-511.
doi: 10.1094/Phyto-81-503 |
| [2] | 刘万才, 邵振润. 小麦白粉病流行规律及近年发生概况和分析. 植保技术与推广, 1994,6:17-19. |
| [25] |
MIRIK M, ANSLEY R J, STEDDOM K, RUSH C M, MICHELS G J, WORKNEH F, CUI S, ELLIOTT N C. High spectral and spatial resolution hyperspectral imagery for quantifying Russian wheat aphid infestation in wheat using the constrained energy minimization classifier. Journal of Applied Remote Sensing, 2014,8(1):83661.
doi: 10.1117/1.JRS.8.083661 |
| [26] |
梁栋, 刘娜, 张东彦. 利用成像高光谱区分冬小麦白粉病与条锈病. 红外与激光工程, 2017,46(1):138004.
doi: 10.3788/IRLA |
| [2] | LIU W C, SHAO Z Z. Epidemiology, occurrence and analysis of wheat powdery mildew in recent years. Plant Protection Technology and Extension, 1994,6:17-19. (in Chinese) |
| [3] |
BINGHAM I J, WALTERS D R, FOULKES M J, PAVELEY N D. Crop traits and the tolerance of wheat and barley to foliar disease. Annals of Applied Biology, 2009,154(2):159-173.
doi: 10.1111/aab.2009.154.issue-2 |
| [4] |
FOULKES M J, PAVELEY N D, WORLAND A, WELHAM S J, THOMAS J, SNAPE J W. Major genetic changes in wheat with potential to affect disease tolerance. Phytopathology, 2006,96(7):680-688.
doi: 10.1094/PHYTO-96-0680 |
| [5] | QIN W C, XUE X Y, ZHANG S M, GU W, WANG B K. Droplet deposition and efficiency of fungicides sprayed with small UAV against wheat powdery mildew. International Journal of Agricultural and Biological Engineering, 2018,11(2):27-32. |
| [6] |
MILNE A, PAVELEY N, AUCLSLEY E, PARSONS D. A model of the effect of fungicides on disease-induced yield loss, for use in wheat disease management decision support systems. Annals of Applied Biology, 2007,151(1):113-125.
doi: 10.1111/aab.2007.151.issue-1 |
| [7] |
HUSSAIN Z, LEITCH M H. The effect of applied sulphur on the growth, grain yield and control of powdery mildew in spring wheat. Annals of Applied Biology, 2005,147(1):49-56.
doi: 10.1111/aab.2005.147.issue-1 |
| [26] |
LIANG D, LIU N, ZHANG D Y. Discrimination of powdery mildew and yellow rust of winter wheat using high-resolution hyperspectra and imageries. Infrared and Laser Engineering, 2017,46(1):138004. (in Chinese)
doi: 10.3788/IRLA |
| [27] | 刘娜. 基于图像和光谱解析的小麦病害识别研究[D]. 合肥: 安徽大学, 2016. |
| LIU N. Recognition of wheat diseases based on imagery and spectral analysis[D]. Hefei: Anhui University, 2016. (in Chinese) | |
| [28] | 张东彦, 张竞成, 朱大洲, 王纪华, 罗菊花, 赵晋陵, 黄文江. 小麦叶片胁迫状态下的高光谱图像特征分析研究. 光谱学与光谱分析, 2011,31(4):1101-1105. |
| ZHANG D Y, ZHANG J C, ZHU D Z, WANG J H, LUO J H, ZHAO J L, HUANG W J. Investigation of the hyperspectral image characteristics of wheat leaves under different stress. Spectroscopy and Spectral Analysis, 2011,31(4):1101-1105. (in Chinese) | |
| [29] | 黄宇. 基于成像高光谱的小麦氮素营养监测研究[D]. 南京: 南京农业大学, 2015. |
| HUANG Y. Monitoring nitrogen status with imaging hyperspectral in wheat[D]. Nanjing: Nanjing Agricultural University, 2015. (in Chinese) | |
| [30] |
ZHENG H B, CHENG T, ZHOU M, LI D, YAO X, TIAN Y, CAO W, ZHU Y. Improved estimation of rice aboveground biomass combining textural and spectral analysis of UAV imagery. Precision Agriculture, 2019,20(3):611-629.
doi: 10.1007/s11119-018-9600-7 |
| [8] |
WOLFE M. Trying to understand and control powdery mildew. Plant Pathology, 1984,33(4):451-466.
doi: 10.1111/ppa.1984.33.issue-4 |
| [9] |
BEEST D E T, PAVELEY N D, SHAW M W, VAN DEN BOSCH F. Disease-weather relationships for powdery mildew and yellow rust on winter wheat. Phytopathology, 2008,98(5):609-617.
doi: 10.1094/PHYTO-98-5-0609 |
| [31] | 杨燕. 基于高光谱成像技术的水稻稻瘟病诊断关键技术研究[D]. 杭州: 浙江大学, 2012. |
| YANG Y. The key diagnosis technology of rice blast based on hyperspectral image[D]. Hangzhou: Zhejiang University, 2012. (in Chinese) | |
| [10] |
SHAW M W, POKORNÝ R, LEBEDA A. Preparing for changes in plant disease due to climate change. Plant Protection Science, 2009,45(Special):S3-S10.
doi: 10.17221/PPS |
| [11] | 姚树然, 霍治国, 董占强, 李敏, 陈晓静. 基于逐时温湿度的小麦白粉病指标与模型. 生态学杂志, 2013,32(5):1364-1370. |
| [32] |
CHENG T, RIVARD B, SÁNCHEZ-AZOFEIFA A. Spectroscopic determination of leaf water content using continuous wavelet analysis. Remote Sensing of Environment, 2010,115(2):659-670.
doi: 10.1016/j.rse.2010.11.001 |
| [33] |
ZHANG J C, YUAN L, WANG J H, HUANG W J, CHEN L P, ZHANG D Y. Spectroscopic leaf level detection of powdery mildew for winter wheat using continuous wavelet analysis. Journal of Integrative Agriculture, 2012,11(9):1474-1484.
doi: 10.1016/S2095-3119(12)60147-6 |
| [34] | 梁栋, 杨勤英, 黄文江, 彭代亮, 赵晋陵, 黄林生, 张东彦, 宋晓宇. 基于小波变换与支持向量机回归的冬小麦叶面积指数估算. 红外与激光工程, 2015,44(1):335-340. |
| LIANG D, YANG Q Y, HUANG W J, PENG D L, ZHAO J L, HUANG L S, ZHANG D Y, SONG X Y. Estimation of leaf area index based on wavelet transform and support vector machine regression in winter wheat. Infrared Laser Engineering, 2015,44(1):335-340. (in Chinese) | |
| [11] | YAO S R, HUO Z G, DONG Z Q, LI M, CHEN X J. Indices and modeling of wheat powdery mildew epidemic based on hourly air temperature and humidity data. Chinese Journal of Ecology, 2013,32(5):1364-1370. (in Chinese) |
| [12] |
CAUBEL J, LAUNAY M, RIPOCHE D, GOUACHE D, BUIS S, HUARD F, HUBER L, BRUN F, BANCAL M O. Climate change effects on leaf rust of wheat: Implementing a coupled crop-disease model in a French regional application. European Journal of Agronomy, 2017,90:53-66.
doi: 10.1016/j.eja.2017.07.004 |
| [35] |
SINGH S K, HOYOS-VILLEGAS V, RAY J D, SMITH J R, FRITSCHI F B. Quantification of leaf pigments in soybean (Glycine max (L.) Merr.) based on wavelet decomposition of hyperspectral features. Field Crops Research, 2013,149:20-32.
doi: 10.1016/j.fcr.2013.04.019 |
| [36] |
LIAO Q, WANG J, YANG G, ZHANG D, LII H, FU Y, LI Z. Comparison of spectral indices and wavelet transform for estimating chlorophyll content of maize from hyperspectral reflectance. Journal of Applied Remote Sensing, 2013,7(1):73575.
doi: 10.1117/1.JRS.7.073575 |
| [13] |
ZHANG J CH, PU R L, YUAN L, HUANG W J, YANG G J. Integrating remotely sensed and meteorological observations to forecast wheat powdery mildew at a regional scale. IEEE Journal of Selected Topics in Applied Earth Observations and Remote Sensing, 2014,7(11):4328-4339.
doi: 10.1109/JSTARS.4609443 |
| [14] |
MAHLEIN A K, OERKE E C, STEINER U, DEHNE H W. Recent advances in sensing plant diseases for precision crop protection. European Journal of Plant Pathology, 2012,133(1):197-209.
doi: 10.1007/s10658-011-9878-z |
| [37] |
PU R, GONG P. Wavelet transform applied to EO-1 hyperspectral data for forest LAI and crown closure mapping. Remote Sensing of Environment, 2004,91(2):212-224.
doi: 10.1016/j.rse.2004.03.006 |
| [38] |
SHI Y, HUANG W, GONZÁLEZ-MORENO P, LUKE B, DONG Y, ZHENG Q, MA H, LIU L. Wavelet-based rust spectral feature set (wrsfs): A novel spectral feature set based on continuous wavelet transformation for tracking progressive host-pathogen interaction of yellow rust on wheat. Remote Sensing, 2018,10(4):525.
doi: 10.3390/rs10040525 |
| [15] |
MARTINELLI F, SCALENGHE R, DAVINO S, PANNO S, SCUDERI G, RUISI P, VILLA P, STROPPIANA D, BOSCHETTI M, GOULART L R, DAVIS C E, DANDEKAR A M. Advanced methods of plant disease detection. A review. Agronomy for Sustainable Development, 2015,35(1):1-25.
doi: 10.1007/s13593-014-0246-1 |
| [16] |
CAO X R, LUO Y, ZHOU Y L, DUAN X Y, CHENG D F. Detection of powdery mildew in two winter wheat cultivars using canopy hyperspectral reflectance. Crop Protection, 2013,45:124-131.
doi: 10.1016/j.cropro.2012.12.002 |
| [39] | LICHTENTHALER H K. Chlorophylls and carotenoids: pigments of photosynthetic biomembranes. Methods in Enzymology, 1987,148C(1):350-382. |
| [40] | ZHANG J C, WANG B, ZHANG X X, LIU P, DONG Y Y, WU K H, HUANG W J. Impact of spectral interval on wavelet features for detecting wheat yellow rust with hyperspectral data. International Journal of Agricultural and Biological Engineering, 2018,11(6):138-144. |
| [17] |
FENG W, SHEN W, HE L, DUAN J, GUO B, LI Y, WANG C, GUO T. Improved remote sensing detection of wheat powdery mildew using dual-green vegetation indices. Precision Agriculture, 2016,17(5):608-627.
doi: 10.1007/s11119-016-9440-2 |
| [41] | HARALICK R M, SHANMUGAM K. Textural features for image classification. IEEE Transactions on Systems, Man, and Cybernetics, 1973,3(6):610-621. |
| [42] |
FENG W, QI S L, HENG Y R, ZHOU Y, WU Y P, LIU W D, HE L, LI X. Canopy vegetation indices from in situ hyperspectral data to assess plant water status of winter wheat under powdery mildew stress. Front Plant Science, 2017,8:1219.
doi: 10.3389/fpls.2017.01219 |
| [43] | 杜世州. 基于多源数据小麦白粉病遥感监测研究[D]. 合肥: 安徽农业大学, 2013. |
| DU S Z. Research on wheat powdery mildew monitoring based on Multi-source remote sensing data[D]. Hefei: Anhui University, 2013. (in Chinese) | |
| [44] | 王文雁. 基于高光谱的小麦白粉病监测研究[D]. 南京: 南京农业大学, 2016. |
| WANG W Y. Monitoring powdery mildew with hyperspectral reflectance in wheat[D]. Nanjing: Nanjing Agricultural University, 2016. (in Chinese) | |
| [45] | WOLD S, MARTENS H, WOLD H. The Multivariate Calibration Problem in Chemistry Solved by the PLS Method. Matrix pencils. Springer Berlin Heidelberg, 1983: 286-293. |
| [46] |
ORTIZ M C, SARABIA L A, SYMINGTON C. Analysis of ageing and typification of vintage ports by partial least squares and soft independent modelling class analogy. Analyst, 1996,121(8):1009-1013.
doi: 10.1039/AN9962101009 |
| [47] | DELWICHE S R, CHEN Y R, HRUSCHKA W R. Differentiation of hard red wheat by near-infrared analysis of bulk samples. Cereal Chemistry, 1995,72(3):243-247. |
| [48] |
BARKER M, RAYENS W. Partial least squares for discrimination. Journal of Chemometrics, 2003,17(3):166-173.
doi: 10.1002/(ISSN)1099-128X |
| [49] |
HUANG W J, GUAN Q S, LUO J H, ZHANG J C, ZHAO J L, LIANG D, HUANG L S, ZHANG D Y. New optimized spectral indices for identifying and monitoring winter wheat diseases. IEEE Journal of Selected Topics in Applied Earth Observations and Remote Sensing, 2014,7(6):2516-2524.
doi: 10.1109/JSTARS.4609443 |
| [50] | CHEN B, WANG K, LI S, WANG J, BAI J, XIAO C, LAI J. Spectrum characteristics of cotton canopy infected with verticillium wilt and inversion of severity level. Computer and Computing Technologies in Agriculture, 2008,2:1169-1180. |
| [51] |
GAMON J A, PENUELAS J, FIELD C B. A narrow-waveband spectral index that tracks diurnal changes in photosynthetic efficiency. Remote Sensing of Environment, 1992,41(1):35-44.
doi: 10.1016/0034-4257(92)90059-S |
| [52] |
DAUGHTRY C S T, WALTHALL C L, KIM M S, DE COLSTOUN E B, MCMURTREY J E. Estimating corn leaf chlorophyll concentration from leaf and canopy reflectance. Remote Sensing of Environment, 2000,74(2):229-239.
doi: 10.1016/S0034-4257(00)00113-9 |
| [53] |
LEWIS H G, BROWN M. A generalized confusion matrix for assessing area estimates from remotely sensed data. International Journal of Remote Sensing, 2001,22(16):3223-3235.
doi: 10.1080/01431160152558332 |
| [54] | PENUELAS J, BARET F, FILELLA I. Semiempirical indexes to assess carotenoids chlorophyll-a ratio from leaf spectral reflectance. Photosynthetica, 1995,31(2):221-230. |
| [55] | MERTON R, HUNTINGTON J. Early simulation results of the ARIES-1 satellite sensor for multi-temporal vegetation research derived from AVIRIS. Proceedings of the Eighth Annual JPL Airborne Earth Science Workshop, Pasadena, CA, USA, 1999: 9-11. |
| [56] |
WOLD S, SJÖSTRÖM M, ERIKSSON L. PLS-regression: A basic tool of chemometrics. Chemometrics and Intelligent Laboratory Systems, 2001,58(2):109-130.
doi: 10.1016/S0169-7439(01)00155-1 |
| [57] |
ZHANG J C, PU R L, WANG J H, YUAN L, LUO J H. Detecting powdery mildew of winter wheat using leaf level hyperspectral measurements. Computers and Electronics in Agriculture, 2012,85:13-23.
doi: 10.1016/j.compag.2012.03.006 |
| [58] |
ZHANG J, PU R, LORAAMM R W, YANG G, WANG J. Comparison between wavelet spectral features and conventional spectral features in detecting yellow rust for winter wheat. Computers and Electronics in Agriculture, 2014,100:79-87.
doi: 10.1016/j.compag.2013.11.001 |
| [59] |
SHI Y, HUANG W J, ZHOU X F. Evaluation of wavelet spectral features in pathological detection and discrimination of yellow rust and powdery mildew in winter wheat with hyperspectral reflectance data. Journal of Applied Remote Sensing, 2017,11(2):26025.
doi: 10.1117/1.JRS.11.026025 |
| [60] |
CAO X R, LUO Y, ZHOU Y L, ZHOU Y L, DUAN X Y, CHENG D F. Detection of powdery mildew in two winter wheat cultivars using canopy hyperspectral reflectance. Crop Protection, 2013,45:124-131.
doi: 10.1016/j.cropro.2012.12.002 |
| [61] | 郑恒彪. 水稻生育期及生长参数的近地面遥感监测研究[D]. 南京: 南京农业大学, 2018. |
| ZHENG H B. Monitoring rice phenology and growth parameters using near-ground remote sensing platforms[D]. Nanjing: Nanjing Agricultural University, 2018. (in Chinese) | |
| [62] |
LU D. Aboveground biomass estimation using Landsat TM data in the Brazilian Amazon. International Journal of Remote Sensing, 2005,26(12):2509-2525.
doi: 10.1080/01431160500142145 |
| [63] |
WULDER M, FRANKLIN S, LAVIGNE M. High spatial resolution optical image texture for improved estimation of forest stand leaf area index. Canadian Journal of Remote Sensing, 1996,22(4):441-449.
doi: 10.1080/07038992.1996.10874668 |
| [64] |
WULDER M A, LEDREW E F, FRANKLIN S E, LAVIGNE M B. Aerial image texture information in the estimation of northern deciduous and mixed wood forest leaf area index (LAI). Remote Sensing of Environment, 1998,64(1):64-76.
doi: 10.1016/S0034-4257(97)00169-7 |
| [1] | 赵耀, 程前, 徐田军, 刘正, 王荣焕, 赵久然, 陆大雷, 李从锋. 高密度条件下株型改良对春玉米根-冠特征及籽粒产量的影响[J]. 中国农业科学, 2025, 58(7): 1296-1310. |
| [2] | 宋岩, 柴明堂, 李王成, 孙利英, 吾连恩·赛尔奴, 杜天择. 基于RGB和纹理特征的土壤表层水盐信息反演方法[J]. 中国农业科学, 2025, 58(6): 1159-1172. |
| [3] | 梁雪, 姜艳, 危常州, 薛冰, 李芳芳, 崔怡蕊, 张夏然. 基于无人机遥感的玉米农田土壤水分诊断模型研究[J]. 中国农业科学, 2025, 58(23): 4979-4992. |
| [4] | 张梦雨, 何在菊, 王星星, 任昊, 任佰朝, 刘鹏, 张吉旺, 赵斌. 玉米大豆带状复合种植模式下不同株高玉米品种搭配对群体冠层光分布及玉米光合特性的影响[J]. 中国农业科学, 2025, 58(23): 4886-4904. |
| [5] | 石德杨, 高春华, 李艳红, 赵海军, 夏德君. 行距配置对间作玉米冠层特性及产量的影响[J]. 中国农业科学, 2025, 58(23): 4872-4885. |
| [6] | 宋旭辉, 赵雪盈, 赵斌, 任佰朝, 张吉旺, 刘鹏, 任昊. 行比配置对玉米大豆带状复合种植系统冠层光合特性及产量形成的影响[J]. 中国农业科学, 2025, 58(23): 4858-4871. |
| [7] | 杨启睿, 李岚涛, 张潇, 张倩, 张银杰, 张铎, 王宜伦. 施钾对夏花生产量、品质及光温生理特性的影响[J]. 中国农业科学, 2024, 57(7): 1335-1349. |
| [8] | 周智辉, 谷晓博, 程智楷, 常甜, 赵彤彤, 王玉明, 杜娅丹. 基于影像分割的覆膜玉米叶绿素含量反演[J]. 中国农业科学, 2024, 57(6): 1066-1079. |
| [9] | 李法计, 程敦公, 余晓丛, 闻伟锷, 刘金栋, 翟胜男, 刘爱峰, 郭军, 曹新有, 刘成, 宋健民, 刘建军, 李豪圣. 冠层活性相关性状全基因组关联分析及其对产量性状遗传效应的解析[J]. 中国农业科学, 2024, 57(4): 627-637. |
| [10] | 齐欣, 汪洋, 黄玉芳, 叶优良, 郭宇龙, 赵亚南. 基于直方图的手机玉米冠层数字图像氮素诊断方法[J]. 中国农业科学, 2024, 57(20): 4094-4106. |
| [11] | 郭燕, 井宇航, 王来刚, 黄竞毅, 贺佳, 冯伟, 郑国清. 基于无人机影像特征的冬小麦植株氮含量预测及模型迁移能力分析[J]. 中国农业科学, 2023, 56(5): 850-865. |
| [12] | 王伟康, 张嘉懿, 汪慧, 曹强, 田永超, 朱艳, 曹卫星, 刘小军. 基于固定翼无人机多光谱影像的水稻长势关键指标无损监测[J]. 中国农业科学, 2023, 56(21): 4175-4191. |
| [13] | 冯子恒,宋莉,张少华,井宇航,段剑钊,贺利,尹飞,冯伟. 基于无人机多光谱和热红外影像信息融合的小麦白粉病监测[J]. 中国农业科学, 2022, 55(5): 890-906. |
| [14] | 陶海玉,张爱武,庞海洋,康孝岩. 智能手机原位牧草生物量估算[J]. 中国农业科学, 2021, 54(5): 933-944. |
| [15] | 周萌,韩晓旭,郑恒彪,程涛,田永超,朱艳,曹卫星,姚霞. 基于参数化和非参数化法的棉花生物量高光谱遥感估算[J]. 中国农业科学, 2021, 54(20): 4299-4311. |
|
||