


中国农业科学 ›› 2023, Vol. 56 ›› Issue (23): 4742-4756.doi: 10.3864/j.issn.0578-1752.2023.23.015
侯赵玉( ), 龚亦钊, 钱祎, 程卓雅, 陶俊(), 赵大球()
收稿日期:2023-04-12
接受日期:2023-06-14
出版日期:2023-12-04
发布日期:2023-12-04
通信作者:
联系方式:
侯赵玉,E-mail:1148570156@qq.com。
基金资助:
HOU ZhaoYu(), GONG YiZhao, QIAN Yi, CHENG ZhuoYa, TAO Jun(), ZHAO DaQiu()
Received:2023-04-12
Accepted:2023-06-14
Published:2023-12-04
Online:2023-12-04
摘要:
【目的】采用多元统计分析方法评价不同芍药品种的耐热能力、筛选芍药耐热性鉴定指标,建立更加全面可靠的芍药耐热性评价体系。【方法】本研究以140个芍药品种为材料,采用田间试验,在芍药经过夏季高温胁迫后于8月份测定热害指数、株高、冠幅、叶绿素相对含量(SPAD)等8个形态结构指标以及丙二醛(MDA)、相对电导率(REC)等13个生理指标。采用相关性分析、隶属函数分析、主成分分析、聚类分析和逐步回归分析对芍药耐热性进行综合评价并筛选耐热性鉴定指标。【结果】21个指标之间存在不同程度的变异,变异系数范围为6.66%—78.02%,变异系数具体表现为:过氧化氢酶(CAT)>过氧化物酶(POD)>净光合速率(Pn)>非光化学猝灭系数(qN)>超氧化物歧化酶(SOD)>气孔密度>栅栏/海绵组织>可溶性糖含量(SSC)>可溶性蛋白含量(SPC)>热害指数>SPAD>实际光合效率(Y(Ⅱ))>色相(b)>丙二醛(MDA)>非调节性能量耗散(Y(NO))>冠幅>叶片厚度>株高>相对电导率(REC)>有效光化学量子产量(Fv/Fm)>色度角(H),其中变异系数最大的为CAT,变异系数最小的为H;通过对各项指标进行相关性分析发现,X1(热害指数)与X2(株高)、X3(冠幅)、X4(SPAD)、X7(Fv/Fm)、X12(叶片厚度)、X17(SSC)呈极显著负相关,与X6(Pn)、X8[Y(Ⅱ)]、X13(气孔密度)、X20(CAT)呈显著负相关,与X5(REC)、X9[Y(NO)]、X16(MDA)、X18(SPC)呈极显著正相关,各指标之间存在不同程度的相关性,较为复杂;通过主成分分析法将21个指标提取为7个主成分因子,贡献率分别为20.50%、11.66%、8.24%、7.24%、7.06%、5.31%和4.85%,累计贡献率达到64.87%;利用隶属函数分析法计算出140个芍药品种的综合得分值(W),在此基础之上采用聚类分析将芍药品种分为“优”“良”“中”“差”4个耐热等级,其中“优”占比14.3%,“良”占比26.4%,“中”占比46.4%,“差”占比12.9%;进一步利用逐步回归分析建立最优线性回归方程W=0.228-0.166X1+0.002X4+0.325X7-0.257X9+0.112X10+ 0.00028X13+ 0.002X17+0.00015X19+0.001X20,从21个指标中筛选出X1(热害指数)、X4(SPAD)、X7(Fv/Fm)、X9[Y(NO)]、X10(qN)、X13(气孔密度)、X17(SSC)、X19(SOD)、X20(CAT)这9个指标作为芍药耐热性的鉴定指标。【结论】采用多元统计分析的方法评价芍药耐热性,将140个芍药品种分为4类(优、良、中、差),筛选出热害指数、SPAD值等9个指标作为芍药耐热性鉴定指标,快速评价芍药的耐热能力,从而显著提高芍药耐热性鉴定的效率。
侯赵玉, 龚亦钊, 钱祎, 程卓雅, 陶俊, 赵大球. 芍药耐热性评价及其鉴定指标筛选[J]. 中国农业科学, 2023, 56(23): 4742-4756.
HOU ZhaoYu, GONG YiZhao, QIAN Yi, CHENG ZhuoYa, TAO Jun, ZHAO DaQiu. Evaluation of Heat Tolerance of Herbaceous Peony and Screening of Its Identification Indices[J]. Scientia Agricultura Sinica, 2023, 56(23): 4742-4756.
表1
供试芍药品种资源编号"
| 编号 Number | 品种 Cultivar | 编号 Number | 品种 Cultivar | 编号 Number | 品种 Variety | 编号 Number | 品种 Cultivar | 编号 Number | 品种 Cultivar | ||||
|---|---|---|---|---|---|---|---|---|---|---|---|---|---|
| SY1 | 胜桃花 Sheng Taohua | SY29 | 雨润奇花 Yurun Qihua | SY57 | 红玫瑰 Hong Meigui | SY85 | 玛瑙绣球 Manao Xiuqiu | SY113 | 粉绫娇艳 Fenling Jiaoyan | ||||
| SY2 | 种生粉 Zhongsheng Fen | SY30 | 玉楼红星 Yulou Hongxing | SY58 | 红盘彩球 Hongpan Caiqiu | SY86 | 墨楼金辉 Molou Jinhui | SY114 | 粉楼 Fen Lou | ||||
| SY3 | 紫兰系金 Zilan Xijin | SY31 | 赵园粉 Zhaoyuan Fen | SY59 | 红线绣玉 Hongxian Xiuyu | SY87 | 墨蕴 Mo Yun | SY115 | 粉楼插翠 Fenlou Chacui | ||||
| SY4 | 墨紫含金 Mozi Hanjin | SY32 | 赵园红 Zhaoyuan Hong | SY60 | 红绣针 Hong Xiuzhen | SY88 | 墨紫冠芳 Mozi Guanfang | SY116 | 粉楼殿春 Fenlou Dianchun | ||||
| SY5 | 杨妃出浴 Yangfei Chuyu | SY33 | 朱砂点玉 Zhusha Dianyu | SY61 | 红艳遇霜 Hongyan Yushuang | SY89 | 墨紫含金 Mozi Hanjin | SY117 | 粉盘金辉 Fenpan Jinhui | ||||
| SY6 | 粉珠盘 Fenzhu Pan | SY34 | 珠光 Zhu Guang | SY62 | 红银针 Hong Yinzhen | SY90 | 墨紫绫 Mozi Ling | SY118 | 粉盘盛宴 Fenpan Shengyan | ||||
| SY7 | 向阳奇花 Xiangyang Qihua | SY35 | 烛光粉玉 Zhuguang Fenyu | SY63 | 红羽球 Hong Yuqiu | SY91 | 鸟巢 Niao Chao | SY119 | 粉银针 Fen Yinzhen | ||||
| SY8 | 红峰 Hong Feng | SY36 | 紫光霞佩 Ziguangxiapei | SY64 | 湖水荡霞 Hushui Dangyang | SY92 | 盘托金沙 Pantuo Jinsha | SY120 | 粉银妆 Fen Yinzhuang | ||||
| SY9 | 巧玲 Qiao Ling | SY37 | 紫红剪绒 Zihong Jianrong | SY65 | 皇冠粉 Huangguan Fen | SY93 | 奇花落羽 Qihua Luoyu | SY121 | 粉羽球 Fen Yuqiu | ||||
| SY10 | 双红楼 Shuanghong Lou | SY38 | 紫红争辉Zihong Zhenghui | SY66 | 黄金丝 Huangjin Si | SY94 | 奇丽 Qi Li | SY122 | 粉玉珑 Fen Yulong | ||||
| SY11 | 桃花飞雪 Taohua Feixue | SY39 | 紫兰魁 Zilan Kui | SY67 | 黄玉簪 Huang Yuzan | SY95 | 珊瑚多姿 Shanhu Duozi | SY123 | 粉玉楼 Fenyu Lou | ||||
| SY12 | 桃花系金 Taohua Xijin | SY40 | 紫莲望月 Zilian Wangyue | SY68 | 江山如画 Jiangshan Ruhua | SY96 | 少女装 Shaonü Zhuang | SY124 | 粉云仙 Fenyun Xian | ||||
| SY13 | 桃花争春 Taohua Zhengchun | SY41 | 紫绫藏金 Ziling Cangjin | SY69 | 金凤羽 Jinfeng Yu | SY97 | 胜美菊 Sheng Meiju | SY125 | 粉紫露金 Fenzi Lujin | ||||
| SY14 | 桃李艳妆 Taoli Yanzhuang | SY42 | 紫绫金星 Ziling Jinxing | SY70 | 金辉 Jin Hui | SY98 | 胜桃花 Sheng Taohua | SY126 | 佛光珠影 Foguang Zhuying | ||||
| SY15 | 晚妆粉 Wanzhuang Fen | SY43 | 紫楼 Zi Lou | SY71 | 金莲献羽 Jinlian Xianyu | SY99 | 奇花露霜 Qihua Lushaung | SY127 | 高杆红 Gaogan Hong | ||||
| SY16 | 万代生色 Wandai Shengse | SY44 | 紫楼显金 Zilou Xiangjin | SY72 | 金星灿烂 Jinxing Canlan | SY100 | 莲台 Lian Tai | SY128 | 高莲台 Gao Liantai | ||||
| SY17 | 乌龙集盛 Wulong Jisheng | SY45 | 紫盘托金 Zipan Tuojin | SY73 | 金玉兰盘 Jinyu Lanpan | SY101 | 碧天晴空 Bitian Qingkong | SY129 | 海棠系金 Haitang Xijin | ||||
| SY18 | 乌龙探海 Wulong Tanhai | SY46 | 紫袍 Zi Pao | SY74 | 金簪刺红绫 Jinzan Cihongling | SY102 | 长凤羽 Chang Fengyu | SY130 | 红凤羽 Hong Fengyu | ||||
| SY19 | 夕霞映雪 Xixia Yingxue | SY47 | 紫袍金带 Zipao Jindai | SY75 | 锦红缎 Jinhong Duan | SY103 | 迟粉 Chi Fen | SY131 | 红绫 Hong Ling | ||||
| SY20 | 西施粉 Xishi Fen | SY48 | 紫绒系腰 Zirong Xiyao | SY76 | 锦玲飘香 Jinling Piaoxiang | SY104 | 大地露霜 Dadi Lushaung | SY132 | 红绫翠玉 Hongling Cuiyu | ||||
| SY21 | 雪峰 Xue Feng | SY49 | 紫檀镶玉 Zitan Xiangyu | SY77 | 兰翠球 Lan Cuiqiu | SY105 | 大红楼 Da Honglou | SY133 | 红楼 Hong Lou | ||||
| SY22 | 雪山红梅 Xueshan Hongmei | SY50 | 紫托绒花 Zituo Ronghua | SY78 | 兰玉环翠 Lanyu Huancui | SY106 | 东海朝阳 Donghai Chaoyang | SY134 | 红楼锦菊 Honglou Jinju | ||||
| SY23 | 雪山紫玉 Xueshan Ziyu | SY51 | 紫艳 Zi Yan | SY79 | 兰玉交辉 Lanyu Jiaohui | SY107 | 多叶紫 Duoye Zi | SY135 | 红楼飘香 Honglou Piaoxiang | ||||
| SY24 | 雪原红花 Xueyuan Honghua | SY52 | 紫艳飞霜 Ziyan Feishuang | SY80 | 兰重楼 Lan Chonglou | SY108 | 粉池滴脂 Fenchi Dizhi | SY136 | 红楼显贵 Honglou Xiangui | ||||
| SY25 | 艳紫向阳 Yanzi Xiangyang | SY53 | 紫羽球 Ziyu Qiu | SY81 | 蓝玉藏金 Lanyu Cangjin | SY109 | 粉翠楼 Fen Cuilou | SY137 | 粉绫红花 Fenling Honghua | ||||
| SY26 | 银边红阁 Yinbian Hongge | SY54 | 凌花晨浴 Linghua Chenyu | SY82 | 恋蝶 Lian Die | SY110 | 粉兰楼 Fen Lanlou | SY138 | 红茶花 Hong Chahua | ||||
| SY27 | 英雄花 Yingxiong Hua | SY55 | 冰山 Bing Shan | SY83 | 玲珑玉 Linglong Yu | SY111 | 粉兰绣球 FenlanXiuqiu | SY139 | 晴雯 Qing Wen | ||||
| SY28 | 永生红 Yongsheng Hong | SY56 | 艳阳天 Yanyang Tian | SY84 | 凌花露霜 Linghua Lushuang | SY112 | 粉蓝魁 Fenlan Kui | SY140 | 烈火金刚 Liehuo Jingang |
表2
芍药不同指标的变异分析"
| 编号 Number | 指标 Index | 最大值 Max | 最小值 Min | 均值 Mean±SD | 变异系数 CV (%) |
|---|---|---|---|---|---|
| X1 | 热害指数 Heat damage index | 0.84 | 0.20 | 0.45±0.13 | 28.12 |
| X2 | 株高 Plant height (cm) | 100.30 | 37.00 | 70.87±10.70 | 15.08 |
| X3 | 冠幅 Crown breadth (cm) | 129.10 | 41.90 | 86.80±15.03 | 17.31 |
| X4 | 叶绿素相对含量 SPAD | 44.50 | 11.30 | 29.03±6.69 | 23.06 |
| X5 | 相对电导率 REC (%) | 58.39 | 27.73 | 41.06±5.91 | 14.39 |
| X6 | 净光合速率 Pn (μmol CO2·m-2·s-1) | 36.20 | 0.33 | 9.38±6.49 | 69.18 |
| X7 | 有效光化学量子产量 Fv/Fm | 0.84 | 0.27 | 0.73±0.07 | 9.76 |
| X8 | 实际光合效率 Y(Ⅱ) | 0.73 | 0.18 | 0.54±0.12 | 22.48 |
| X9 | 非调节性能量耗散 Y(NO) | 0.65 | 0.25 | 0.33±0.07 | 20.01 |
| X10 | 非光化学猝灭系数 qN | 0.69 | 0.12 | 0.33±0.04 | 42.81 |
| X11 | 栅栏/海绵组织 Barrier tissue thickness/sponge tissue thickness | 1.43 | 0.24 | 0.72±0.23 | 32.12 |
| X12 | 叶片厚度 Leaf thickness (μm) | 402.41 | 190.54 | 293.72±47.03 | 16.01 |
| X13 | 气孔密度 Stomatal density (pcs∙mm-2) | 333.87 | 64.72 | 166.80±52.56 | 31.51 |
| X14 | 色相 b | 44.00 | 11.40 | 28.08±5.80 | 20.4 |
| X15 | 色度角 H | 124.70 | 58.80 | 105.59±7.03 | 6.66 |
| X16 | 丙二醛含量 MDA (nmol∙g-1) | 78.95 | 23.44 | 54.41±11.19 | 20.56 |
| X17 | 可溶性糖含量 SSC (mg∙g-1) | 33.33 | 3.03 | 18.41±5.82 | 31.60 |
| X18 | 可溶性蛋白含量 SPC (mg∙g-1) | 12.86 | 2.49 | 7.01±2.08 | 29.73 |
| X19 | 超氧化物歧化酶活性 SOD (U∙g-1) | 422.97 | 39.56 | 245.00±80.17 | 32.72 |
| X20 | 过氧化氢酶活性 CAT (nmol∙min-1∙g-1) | 207.41 | 4.57 | 41.33±32.24 | 78.02 |
| X21 | 过氧化物酶活性 POD (U∙g-1) | 571.79 | 37.26 | 129.15±91.05 | 70.50 |
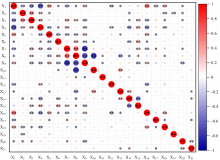
图1
芍药不同指标间的相关性分析 不同颜色表示相关性的强度,越接近红色(正)或蓝色(负)说明相关性越高,圆形直径越大说明相关系数越大"

表3
各性状主成分特征向量、特征值、贡献率"
| 编号 Number | 特征向量 Power vector | ||||||
|---|---|---|---|---|---|---|---|
| C1 | C2 | C3 | C4 | C5 | C6 | C7 | |
| X1 | -0.682 | -0.492 | 0.012 | 0.165 | 0.048 | -0.066 | 0.121 |
| X2 | 0.281 | 0.253 | -0.565 | 0.241 | 0.490 | 0.017 | -0.087 |
| X3 | 0.563 | 0.194 | -0.241 | 0.218 | 0.252 | 0.152 | -0.198 |
| X4 | 0.633 | 0.378 | -0.163 | 0.058 | -0.276 | 0.046 | 0.106 |
| X5 | -0.475 | -0.035 | -0.368 | 0.193 | 0.361 | 0.035 | 0.295 |
| X6 | 0.421 | -0.151 | 0.019 | 0.145 | -0.350 | -0.327 | -0.346 |
| X7 | 0.706 | -0.179 | 0.287 | 0.077 | 0.238 | 0.218 | 0.300 |
| X8 | 0.670 | -0.612 | 0.151 | -0.105 | 0.239 | -0.105 | 0.026 |
| X9 | -0.707 | 0.246 | -0.356 | -0.163 | -0.169 | -0.147 | -0.244 |
| X10 | -0.276 | 0.678 | 0.089 | 0.264 | -0.227 | 0.244 | 0.145 |
| X11 | 0.167 | -0.276 | 0.143 | 0.298 | -0.112 | 0.047 | 0.218 |
| X12 | 0.279 | 0.231 | 0.072 | -0.441 | -0.053 | -0.076 | 0.447 |
| X13 | -0.115 | 0.654 | 0.137 | 0.221 | 0.077 | 0.045 | 0.209 |
| X14 | -0.394 | 0.240 | 0.547 | -0.243 | 0.420 | 0.080 | -0.137 |
| X15 | 0.455 | -0.069 | -0.281 | 0.398 | -0.387 | -0.118 | 0.143 |
| X16 | -0.533 | -0.469 | -0.126 | 0.330 | 0.059 | 0.209 | -0.062 |
| X17 | 0.331 | 0.023 | -0.108 | -0.303 | 0.028 | 0.550 | -0.341 |
| X18 | -0.405 | -0.203 | 0.254 | 0.367 | -0.176 | 0.286 | 0.064 |
| X19 | 0.023 | 0.075 | 0.467 | 0.146 | -0.346 | 0.213 | -0.197 |
| X20 | 0.278 | 0.150 | 0.288 | 0.508 | 0.307 | -0.015 | -0.262 |
| X21 | -0.032 | 0.318 | 0.369 | 0.220 | 0.234 | -0.577 | -0.069 |
| 特征值 Eigenvectors | 4.31 | 2.45 | 1.73 | 1.52 | 1.48 | 1.12 | 1.02 |
| 贡献率 Contribution rate | 20.50 | 11.66 | 8.24 | 7.24 | 7.06 | 5.31 | 4.85 |
| 累计贡献 Accumulative contribution rate | 20.50 | 32.16 | 40.41 | 47.65 | 54.71 | 60.02 | 64.87 |
表4
不同芍药品种的综合得分"
| 编号 Number | W | 编号 Number | W | 编号 Number | W | 编号 Number | W | 编号 Number | W | ||||
|---|---|---|---|---|---|---|---|---|---|---|---|---|---|
| SY1 | 0.65 | SY29 | 0.54 | SY57 | 0.59 | SY85 | 0.49 | SY113 | 0.50 | ||||
| SY2 | 0.68 | SY30 | 0.52 | SY58 | 0.58 | SY86 | 0.65 | SY114 | 0.62 | ||||
| SY3 | 0.63 | SY31 | 0.40 | SY59 | 0.59 | SY87 | 0.68 | SY115 | 0.50 | ||||
| SY4 | 0.65 | SY32 | 0.41 | SY60 | 0.61 | SY88 | 0.54 | SY116 | 0.40 | ||||
| SY5 | 0.71 | SY33 | 0.60 | SY61 | 0.55 | SY89 | 0.58 | SY117 | 0.45 | ||||
| SY6 | 0.72 | SY34 | 0.55 | SY62 | 0.59 | SY90 | 0.55 | SY118 | 0.56 | ||||
| SY7 | 0.71 | SY35 | 0.67 | SY63 | 0.55 | SY91 | 0.56 | SY119 | 0.59 | ||||
| SY8 | 0.66 | SY36 | 0.54 | SY64 | 0.30 | SY92 | 0.49 | SY120 | 0.53 | ||||
| SY9 | 0.63 | SY37 | 0.59 | SY65 | 0.64 | SY93 | 0.62 | SY121 | 0.48 | ||||
| SY10 | 0.59 | SY38 | 0.53 | SY66 | 0.61 | SY94 | 0.57 | SY122 | 0.45 | ||||
| SY11 | 0.64 | SY39 | 0.59 | SY67 | 0.54 | SY95 | 0.52 | SY123 | 0.50 | ||||
| SY12 | 0.72 | SY40 | 0.54 | SY68 | 0.57 | SY96 | 0.62 | SY124 | 0.56 | ||||
| SY13 | 0.65 | SY41 | 0.52 | SY69 | 0.60 | SY97 | 0.46 | SY125 | 0.42 | ||||
| SY14 | 0.55 | SY42 | 0.50 | SY70 | 0.61 | SY98 | 0.58 | SY126 | 0.63 | ||||
| SY15 | 0.58 | SY43 | 0.47 | SY71 | 0.57 | SY99 | 0.48 | SY127 | 0.55 | ||||
| SY16 | 0.52 | SY44 | 0.53 | SY72 | 0.57 | SY100 | 0.63 | SY128 | 0.59 | ||||
| SY17 | 0.56 | SY45 | 0.55 | SY73 | 0.56 | SY101 | 0.77 | SY129 | 0.35 | ||||
| SY18 | 0.54 | SY46 | 0.58 | SY74 | 0.56 | SY102 | 0.50 | SY130 | 0.67 | ||||
| SY19 | 0.52 | SY47 | 0.56 | SY75 | 0.59 | SY103 | 0.58 | SY131 | 0.32 | ||||
| SY20 | 0.57 | SY48 | 0.54 | SY76 | 0.55 | SY104 | 0.58 | SY132 | 0.53 | ||||
| SY21 | 0.54 | SY49 | 0.53 | SY77 | 0.55 | SY105 | 0.55 | SY133 | 0.68 | ||||
| SY22 | 0.55 | SY50 | 0.52 | SY78 | 0.52 | SY106 | 0.54 | SY134 | 0.52 | ||||
| SY23 | 0.61 | SY51 | 0.63 | SY79 | 0.52 | SY107 | 0.44 | SY135 | 0.40 | ||||
| SY24 | 0.63 | SY52 | 0.58 | SY80 | 0.50 | SY108 | 0.67 | SY136 | 0.31 | ||||
| SY25 | 0.59 | SY53 | 0.63 | SY81 | 0.64 | SY109 | 0.62 | SY137 | 0.56 | ||||
| SY26 | 0.47 | SY54 | 0.51 | SY82 | 0.67 | SY110 | 0.62 | SY138 | 0.48 | ||||
| SY27 | 0.60 | SY55 | 0.59 | SY83 | 0.61 | SY111 | 0.53 | SY139 | 0.54 | ||||
| SY28 | 0.54 | SY56 | 0.57 | SY84 | 0.55 | SY112 | 0.54 | SY140 | 0.55 |
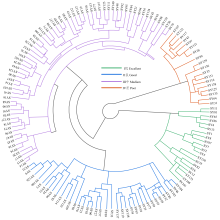
图2
基于W值的芍药耐热能力聚类分析"

表5
不同芍药品种的预测值得分"
| 编号 Number | 预测值 PV | 编号 Number | 预测值 PV | 编号 Number | 预测值 PV | 编号 Number | 预测值 PV | 编号 Number | 预测值 PV | ||||
|---|---|---|---|---|---|---|---|---|---|---|---|---|---|
| SY1 | 0.63 | SY29 | 0.57 | SY57 | 0.61 | SY85 | 0.46 | SY113 | 0.52 | ||||
| SY2 | 0.61 | SY30 | 0.47 | SY58 | 0.54 | SY86 | 0.60 | SY114 | 0.58 | ||||
| SY3 | 0.57 | SY31 | 0.37 | SY59 | 0.54 | SY87 | 0.62 | SY115 | 0.53 | ||||
| SY4 | 0.69 | SY32 | 0.43 | SY60 | 0.52 | SY88 | 0.52 | SY116 | 0.41 | ||||
| SY5 | 0.74 | SY33 | 0.57 | SY61 | 0.56 | SY89 | 0.55 | SY117 | 0.51 | ||||
| SY6 | 0.72 | SY34 | 0.57 | SY62 | 0.63 | SY90 | 0.54 | SY118 | 0.52 | ||||
| SY7 | 0.73 | SY35 | 0.67 | SY63 | 0.55 | SY91 | 0.56 | SY119 | 0.63 | ||||
| SY8 | 0.62 | SY36 | 0.56 | SY64 | 0.28 | SY92 | 0.51 | SY120 | 0.56 | ||||
| SY9 | 0.69 | SY37 | 0.55 | SY65 | 0.63 | SY93 | 0.59 | SY121 | 0.53 | ||||
| SY10 | 0.57 | SY38 | 0.51 | SY66 | 0.60 | SY94 | 0.54 | SY122 | 0.45 | ||||
| SY11 | 0.62 | SY39 | 0.58 | SY67 | 0.53 | SY95 | 0.50 | SY123 | 0.52 | ||||
| SY12 | 0.76 | SY40 | 0.57 | SY68 | 0.54 | SY96 | 0.61 | SY124 | 0.60 | ||||
| SY13 | 0.68 | SY41 | 0.54 | SY69 | 0.59 | SY97 | 0.49 | SY125 | 0.46 | ||||
| SY14 | 0.59 | SY42 | 0.54 | SY70 | 0.63 | SY98 | 0.55 | SY126 | 0.59 | ||||
| SY15 | 0.60 | SY43 | 0.49 | SY71 | 0.55 | SY99 | 0.45 | SY127 | 0.56 | ||||
| SY16 | 0.56 | SY44 | 0.58 | SY72 | 0.59 | SY100 | 0.64 | SY128 | 0.62 | ||||
| SY17 | 0.61 | SY45 | 0.58 | SY73 | 0.55 | SY101 | 0.79 | SY129 | 0.34 | ||||
| SY18 | 0.57 | SY46 | 0.61 | SY74 | 0.59 | SY102 | 0.48 | SY130 | 0.75 | ||||
| SY19 | 0.51 | SY47 | 0.58 | SY75 | 0.61 | SY103 | 0.59 | SY131 | 0.31 | ||||
| SY20 | 0.60 | SY48 | 0.53 | SY76 | 0.56 | SY104 | 0.61 | SY132 | 0.51 | ||||
| SY21 | 0.51 | SY49 | 0.52 | SY77 | 0.53 | SY105 | 0.54 | SY133 | 0.70 | ||||
| SY22 | 0.57 | SY50 | 0.52 | SY78 | 0.49 | SY106 | 0.57 | SY134 | 0.53 | ||||
| SY23 | 0.65 | SY51 | 0.62 | SY79 | 0.50 | SY107 | 0.48 | SY135 | 0.41 | ||||
| SY24 | 0.57 | SY52 | 0.53 | SY80 | 0.50 | SY108 | 0.65 | SY136 | 0.30 | ||||
| SY25 | 0.61 | SY53 | 0.65 | SY81 | 0.61 | SY109 | 0.65 | SY137 | 0.63 | ||||
| SY26 | 0.51 | SY54 | 0.50 | SY82 | 0.64 | SY110 | 0.61 | SY138 | 0.48 | ||||
| SY27 | 0.61 | SY55 | 0.60 | SY83 | 0.65 | SY111 | 0.52 | SY139 | 0.52 | ||||
| SY28 | 0.56 | SY56 | 0.60 | SY84 | 0.52 | SY112 | 0.50 | SY140 | 0.57 |
表6
W值与PV值相关性分析"
| 评价值 W | 预测值 PV | |
|---|---|---|
| 评价值 W | 1 | 0.925** |
| 预测值 PV | 0.925** | 1 |
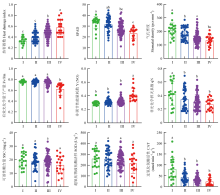
图3
聚类结果中不同耐热能力类型芍药品种的形态及生理表现特征"
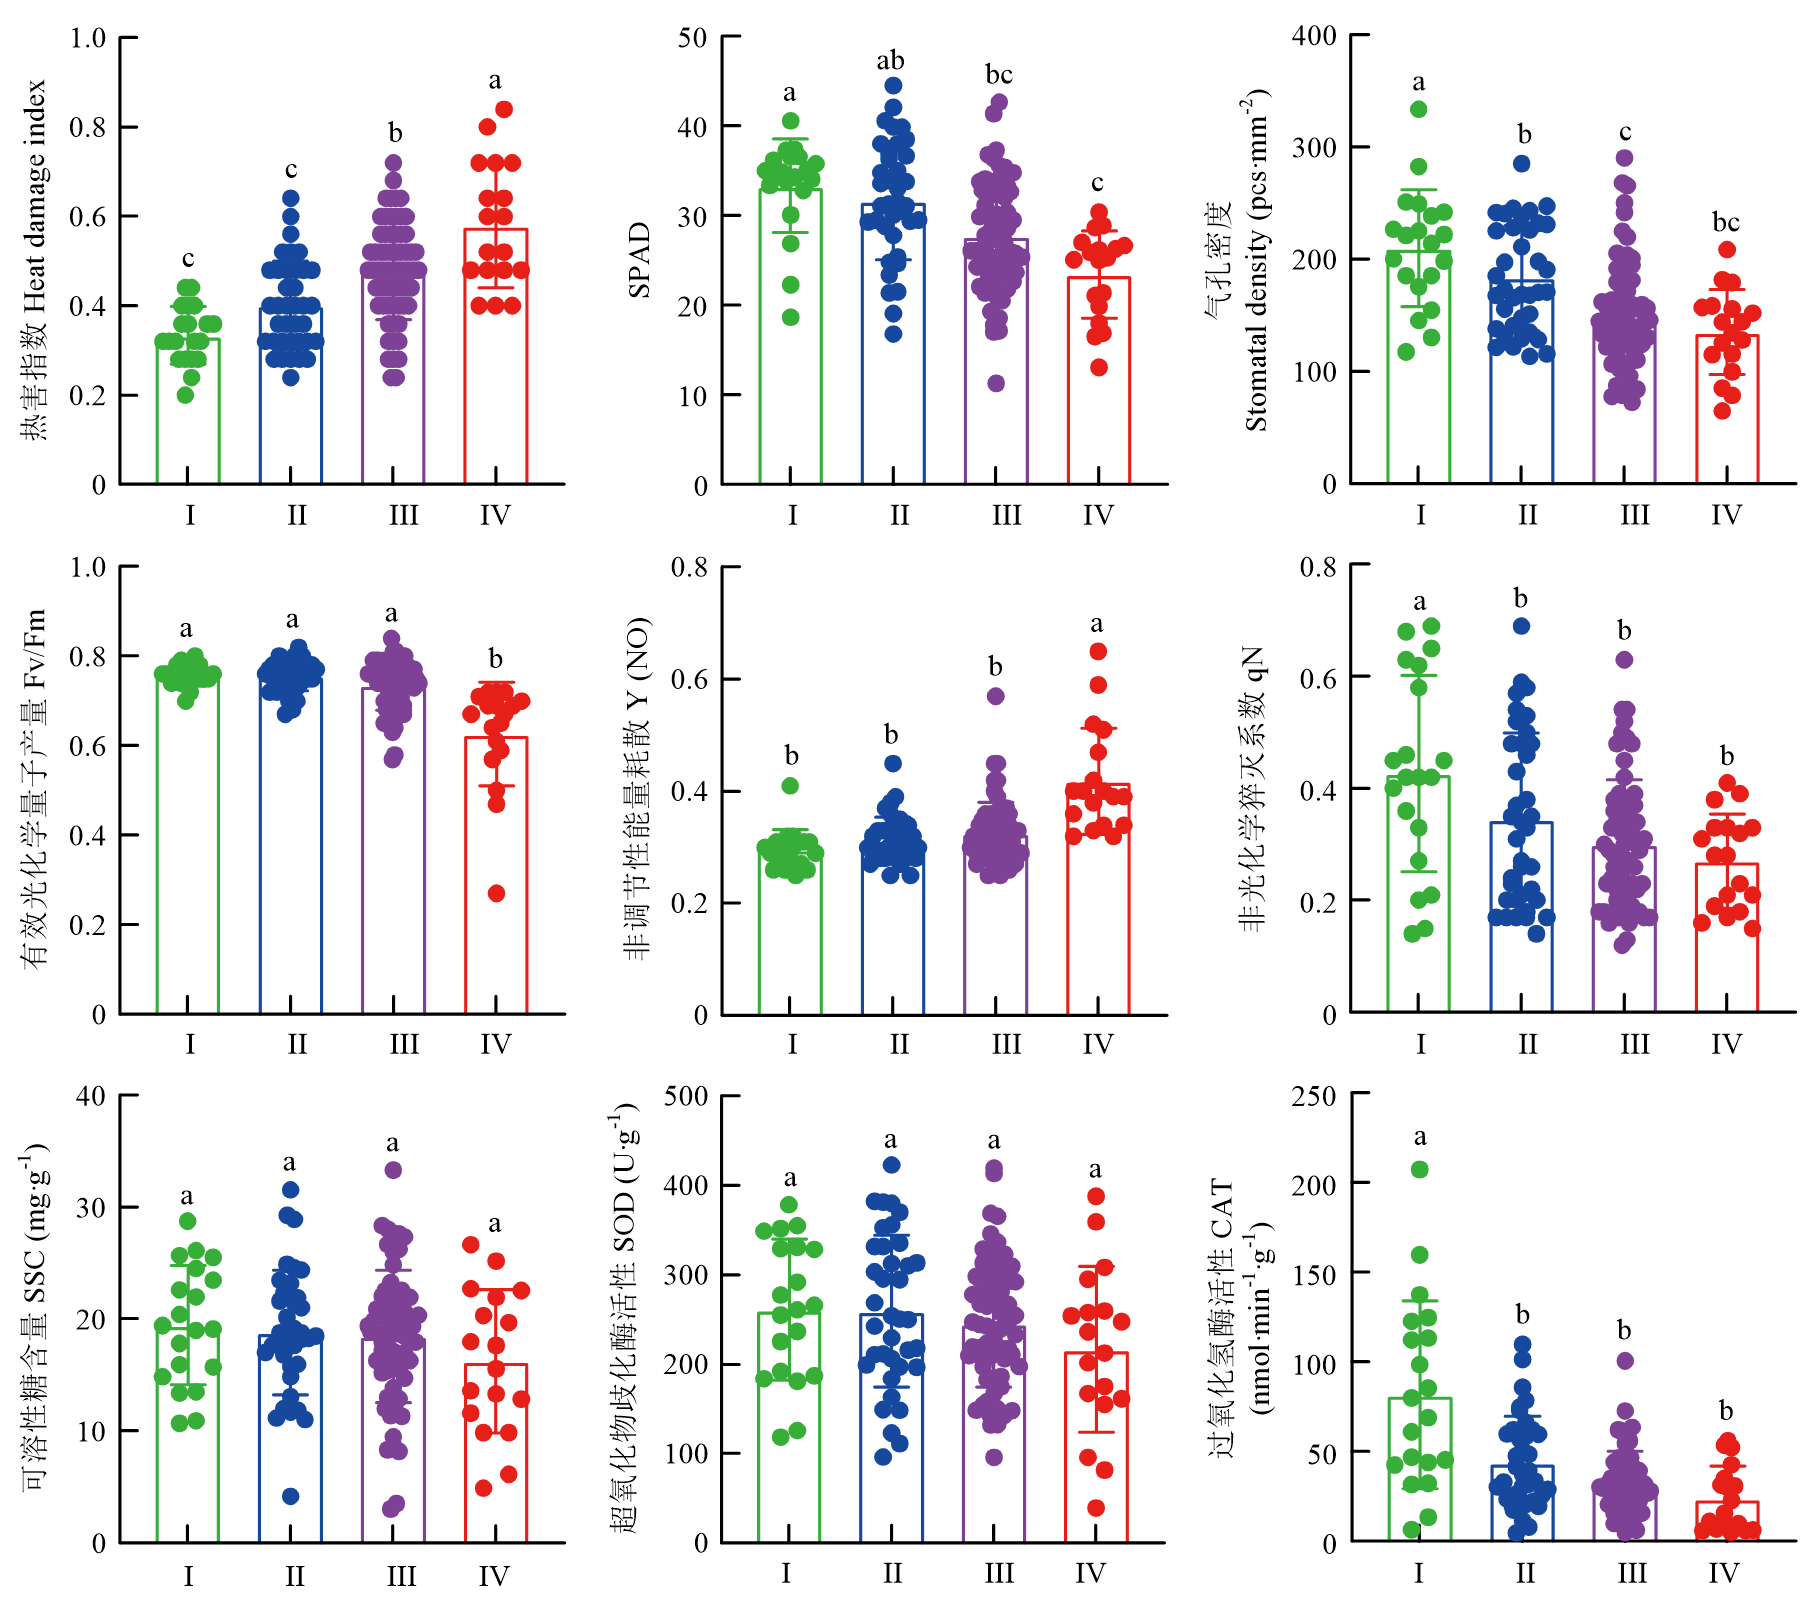
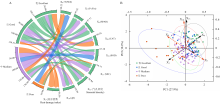
图4
芍药品种耐热能力类型与耐热性鉴定指标关系(A)与耐热性指标主成分分析(B)"

| [1] |
吕长平, 刘林艳. 高温胁迫对芍药部分生理生化指标的影响. 湖南农业大学学报(自然科学版), 2008, 34(6): 664-667.
|
|
|
|
| [2] |
于莎莎, 张楠. 中国观赏园艺产业现状与发展趋势. 现代农业科技 2020(17): 112-113.
|
|
|
|
| [3] |
刘林艳. 几个芍药品种的耐湿热生理生化特性研究[D]. 长沙: 湖南农业大学, 2008.
|
|
|
|
| [4] |
赵大球, 韩晨霞, 陶俊. 不同芍药品种耐热性鉴定. 扬州大学学报(农业与生命科学版), 2015, 36(4): 105-109.
|
|
|
|
| [5] |
张佳平, 李丹青, 聂晶晶, 夏宜平. 高温胁迫下芍药的生理生化响应和耐热性评价. 核农学报, 2016, 30(9): 1848-1856.
doi: 10.11869/j.issn.100-8551.2016.09.1848 |
|
|
|
| [6] |
张方静, 罗峰, 谭殷殷, 张旻桓, 邢文, 金晓玲. 高温胁迫对月季生理特性和叶绿素荧光参数的影响. 河南农业科学, 2019, 48(4): 108-115.
|
|
|
|
| [7] |
余炳伟, 董日月, 雷建军, 陈长明, 周火燕, 曹必好. 黄瓜耐热材料的筛选与鉴定. 分子植物育种, 2017, 15(11): 4695-4705.
|
|
|
|
| [8] |
毛静, 董艳芳, 周媛, 童俊, 徐冬云, 方林川. 十六个德国鸢尾品种的耐热性评价. 北方园艺, 2019(3): 94-100.
|
|
|
|
| [9] |
韩晨霞. 芍药耐热生理机制的初步研究[D]. 扬州: 扬州大学, 2005.
|
|
|
|
| [10] |
楼柏丹, 姚岚. 几种观察植物表皮气孔方法的比较. 生物学教学, 2015(9): 42-43.
|
|
|
|
| [11] |
邓绮雯, 刘志霞, 张强, 高云, 江奕君, 郑奕雄, 胡巍. 水稻叶片徒手切片的荧光显微镜观察. 仲恺农业工程学院学报, 2020, 33(1): 24-27.
|
|
|
|
| [12] |
武晓玲, 梁海媛, 杨峰, 刘卫国, 佘跃辉, 杨文钰. 大豆苗期耐荫性综合评价及其鉴定指标的筛选. 中国农业科学, 2015, 48(13): 2497-2507. doi: 10.3864/j.issn.0578-1752.2015.13.002.
|
|
|
|
| [13] |
李春红, 姚兴东, 鞠宝韬, 朱明月, 王海英, 张惠君, 敖雪, 于翠梅, 谢甫绨, 宋书宏. 不同基因型大豆耐荫性分析及其鉴定指标的筛选. 中国农业科学, 2014, 47(15): 2927-2939. doi: 10.3864/j.issn.0578-1752.2014.15.003.
|
|
|
|
| [14] |
doi: 10.1016/j.plaphy.2020.08.050 |
| [15] |
doi: 10.1016/j.plaphy.2020.01.015 |
| [16] |
doi: 10.3390/ijms14059643 pmid: 23644891 |
| [17] |
doi: 10.1104/pp.109.137265 pmid: 19403728 |
| [18] |
doi: 10.1007/s11099-013-0021-6 |
| [19] |
doi: 10.1016/0958-1669(95)80024-7 |
| [20] |
doi: 10.3390/agronomy8070128 |
| [21] |
doi: 10.1038/s41598-019-51425-0 pmid: 31636314 |
| [22] |
doi: 10.1139/cjps-2015-0255 |
| [23] |
李璇, 岳红, 王升, 黄璐琦, 马炯, 郭兰萍. 影响植物抗氧化酶活性的因素及其研究热点和现状. 中国中药杂志, 2013, 38(7): 973-978.
|
|
|
|
| [24] |
徐如强, 孙其信, 张树榛. 春小麦耐热性的筛选方法与指标. 华北农学报, 1997, 12(3): 22-29.
|
|
|
|
| [25] |
陈希勇, 孙其信, 孙长征. 春小麦耐热性表现及其评价. 中国农业大学学报, 2000, 5(1): 43-49.
|
|
|
|
| [26] |
doi: 10.1007/s10535-018-0811-6 |
| [27] |
doi: 10.1111/jac.2009.195.issue-2 |
| [28] |
doi: 10.1016/j.fcr.2017.09.001 |
| [29] |
doi: 10.1007/s00344-015-9508-7 |
| [30] |
doi: 10.1038/s41598-019-50853-2 pmid: 31594984 |
| [31] |
李敏, 苏慧, 李阳阳, 李金鹏, 李金才, 朱玉磊, 宋有洪. 黄淮海麦区小麦耐热性分析及其鉴定指标的筛选. 中国农业科学, 2021, 54(16): 3381-3392. doi: 10.3864/j.issn.0578-1752.2021.16.002.
|
|
|
|
| [32] |
蔡继鸿, 陈远华, 赖金莉, 郑薇, 胡江涛, 刘淑媛, 罗素梅, 刘小平, 郭荣生. 18个杜鹃品种耐热性评价. 现代园艺, 2022, 45(17): 6-9, 26.
|
|
|
|
| [33] |
凌瑞, 戴中武, 代晓雨, 吴春梅, 翟俊文, 郑泽新, 吴沙沙. 8个绣球品种耐热性综合评价与耐热指标筛选. 热带作物学报, 2021, 42(8): 2209-2218.
|
|
|
|
| [34] |
付丽军, 李聪晓, 苏胜宇, 李玉华, 周禹. 黄瓜苗期耐热种质筛选与耐热性评价体系构建. 植物生理学报, 2020, 56(7): 1593-1604.
|
|
|
|
| [35] |
胡江龙, 郭林涛, 王友华, 周治国. 棉花渍害恢复的生理指示指标探讨. 中国农业科学, 2013, 46(21): 4446-4453. doi: 10.3864/j.issn.0578-1752.2013.21.006.
|
|
|
| [1] | 贺丹, 尤啸龙, 何松林, 张明星, 张佼蕊, 华超, 王政, 刘艺平. 芍药胼胝质合成酶基因家族鉴定及PlCalS5功能分析[J]. 中国农业科学, 2023, 56(16): 3183-3198. |
| [2] | 王秀秀,邢爱双,杨茹,何守朴,贾银华,潘兆娥,王立如,杜雄明,宋宪亮. 陆地棉种质资源表型性状综合评价[J]. 中国农业科学, 2022, 55(6): 1082-1094. |
| [3] | 刘进,胡佳晓,马小定,陈武,勒思,Jo Sumin,崔迪,周慧颖,张立娜,Shin Dongjin,黎毛毛,韩龙植,余丽琴. 水稻RIL群体高密度遗传图谱的构建及苗期耐热性QTL定位[J]. 中国农业科学, 2022, 55(22): 4327-4341. |
| [4] | 杜金霞,李奕莎,李美霖,陈文浛,张木清. 甘蔗不同基因型对白条病抗性的评价[J]. 中国农业科学, 2022, 55(21): 4118-4130. |
| [5] | 万映伶,朱梦婷,刘爱青,金亦佳,刘燕. 中国观赏芍药表型多样性解析与资源评价[J]. 中国农业科学, 2022, 55(18): 3629-3639. |
| [6] | 刘瑞瑶,黄国弘,李海艳,梁敏敏,逯明辉. 辣椒CaHsfA2上游转录因子的筛选及耐热功能分析[J]. 中国农业科学, 2022, 55(16): 3200-3209. |
| [7] | 李敏, 苏慧, 李阳阳, 李金鹏, 李金才, 朱玉磊, 宋有洪. 黄淮海麦区小麦耐热性分析及其鉴定指标的筛选[J]. 中国农业科学, 2021, 54(16): 3381-3392. |
| [8] | 张斌斌,蔡志翔,沈志军,严娟,马瑞娟,俞明亮. 观赏桃种质资源表型性状多样性评价[J]. 中国农业科学, 2021, 54(11): 2406-2418. |
| [9] | 王珊珊,赵晨辉,李红莲,张冰冰,梁英海,宋宏伟. 东北地区10份李种质资源果实香气成分分析[J]. 中国农业科学, 2021, 54(11): 2476-2486. |
| [10] | 贺丹,谢栋博,张佼蕊,何松林,李朝梅,郑云冰,王政,刘艺平,栗燕,逯久幸. 利用iTRAQ技术和转录组筛选芍药属远缘杂交不亲和基因[J]. 中国农业科学, 2020, 53(6): 1234-1246. |
| [11] | 祝令晓,刘连涛,张永江,孙红春,张科,白志英,董合忠,李存东. 化学封顶对棉花株型的调控及评价指标筛选[J]. 中国农业科学, 2020, 53(20): 4152-4163. |
| [12] | 宋楚君,范方媛,龚淑英,郭昊蔚,李春霖,纵榜正. 不同产地红茶的滋味特征及主要贡献物质[J]. 中国农业科学, 2020, 53(2): 383-394. |
| [13] | 万华方,魏帅,冯宇霞,钱伟. 以六倍体(AnAnCnCnCoCo)为桥梁创制抗旱新型甘蓝型油菜(AnArCnCo)[J]. 中国农业科学, 2020, 53(16): 3225-3234. |
| [14] | 王远鹏,黄晶,孙钰翔,柳开楼,周虎,韩天富,都江雪,蒋先军,陈金,张会民. 近35年红壤稻区土壤肥力时空演变特征—以进贤县为例[J]. 中国农业科学, 2020, 53(16): 3294-3306. |
| [15] | 李玲,徐舒,曹如霞,陈玲玲,崔鹏,吕尊富,陆国权. 基于PCA-Entropy TOPSIS的甘薯品种块根质构品质评价[J]. 中国农业科学, 2020, 53(11): 2161-2170. |
|
||