


中国农业科学 ›› 2021, Vol. 54 ›› Issue (13): 2724-2736.doi: 10.3864/j.issn.0578-1752.2021.13.003
闻竞( ),沈彦岐,王梓钰,李世界,莫蓝月,雷宇豪,张艳,韩四平()
收稿日期:2020-12-09
修回日期:2021-01-18
出版日期:2021-07-01
发布日期:2021-07-12
联系方式:
闻竞,E-mail: jlruby1988@126.com。
基金资助:
WEN Jing(),SHEN YanQi,WANG ZiYu,LI ShiJie,MO LanYue,LEI YuHao,ZHANG Yan,HAN SiPing()
Received:2020-12-09
Revised:2021-01-18
Published:2021-07-01
Online:2021-07-12
摘要:
【目的】玉米穗腐病是一种在全世界广泛发生且危害严重的真菌性病害,其中,拟轮枝镰孢引起的穗腐病(Fusarium ear rot,FER)在中国发生最为普遍。通过图像分析方法进行FER抗病QTL定位,并对前期通过病害评级方法定位的FER抗病QTL进行验证,探索一种新的玉米穗腐病的病害鉴定方法,为玉米穗腐病的遗传改良提供依据。【方法】利用高感FER的自交系(ZW18)分别与3个高抗自交系(承351、丹598和吉V203)构建F2群体(F2-C、F2-D和F2-J)和相应的F2﹕3家系,通过图像分析的方法获得每个F2﹕3家系的果穗病斑百分比,进而定位玉米FER抗病QTL。【结果】3个群体共定位到18个FER抗病QTL,其中,分别位于2.02—2.03 bins、4.06—4.07 bins和8.06 bin上的3个QTL(qRf2、qRf3和qRf4)可解释的表型变异率分别高达21.80%、25.80%和27.40%。F2-J群体的qRf11与F2-C群体的qRf1和F2-D群体的qRf6在第1染色体均有重叠区间,可解释的表型变异率达到16.50%。来自F2-D群体的qRf9与F2-J群体的qRf16在第8染色体8.05 bin有重叠区间,且抗性基因均来源于抗性亲本。F2-C群体的qRf3与F2-J群体的qRf15在第4染色体4.06—4.07 bins有重叠区间。另外,与之前通过病害评级方法定位的结果相比,qRf1、qRf6和qRf11在1.06—1.07 bins与评级方法定位的抗病位点qRfer13重合,qRf3和qRf15在4.06—4.07 bins与评级方法定位的抗病位点qRfer3和qRfer17重叠,qRf7与qRfer6在2.04 bin的定位区间完全重合,qRf17与qRfer20在S2重复中定位到9.03—9.05 bins的重叠区间,且来源于相同的抗源。【结论】定位到18个FER抗性位点,其中,位于1.04—1.07 bins、4.06—4.07 bins和8.05 bin上的抗病位点在不同群体中均可以被检测到,位于2.04 bin和9.03—9.05 bins上的抗病位点用不同的检测方法可以被检测到,表明在这些区间可能存在FER的抗性位点。QTL的定位区间在不同群体中的重叠性在一定程度上验证了定位区间的真实性,不同方法之间定位到重叠区间,说明利用图像分析方法定位FER抗病QTL具有一定的准确性。
闻竞,沈彦岐,王梓钰,李世界,莫蓝月,雷宇豪,张艳,韩四平. 基于图像分析的玉米抗拟轮枝镰孢穗腐病的QTL定位[J]. 中国农业科学, 2021, 54(13): 2724-2736.
WEN Jing,SHEN YanQi,WANG ZiYu,LI ShiJie,MO LanYue,LEI YuHao,ZHANG Yan,HAN SiPing. QTL Mapping of Resistance to Fusarium Ear Rot in Maize Based on Image Analysis[J]. Scientia Agricultura Sinica, 2021, 54(13): 2724-2736.
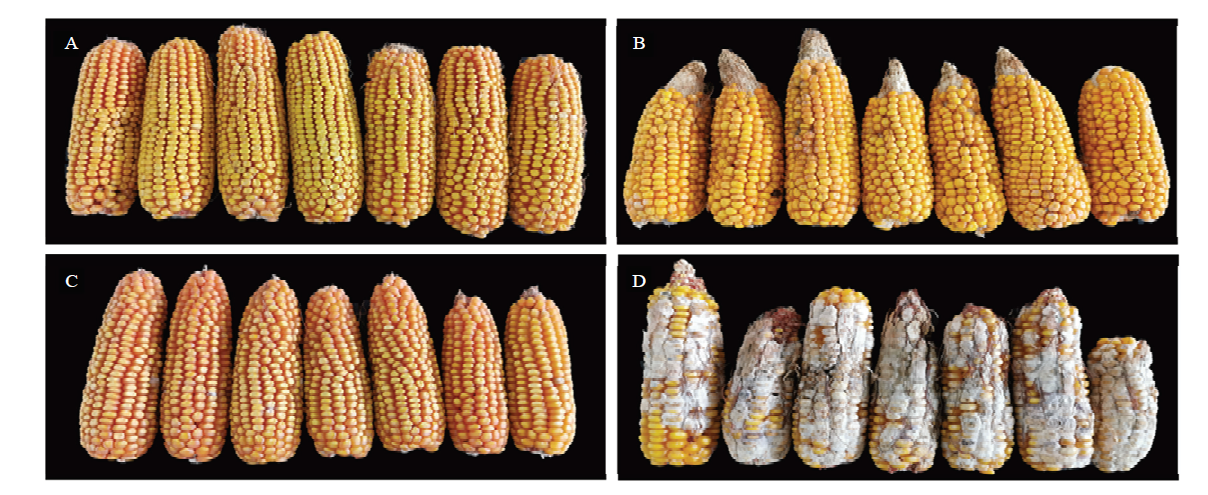
图1
不同亲本的田间发病情况 A:承351;B:丹598;C:吉V203;D:ZW18"

图2
图片处理的过程 A:原图;B:去除背景的玉米果穗图片;C:用不同颜色标注病斑和未发病部位的图片;D:数据分析"
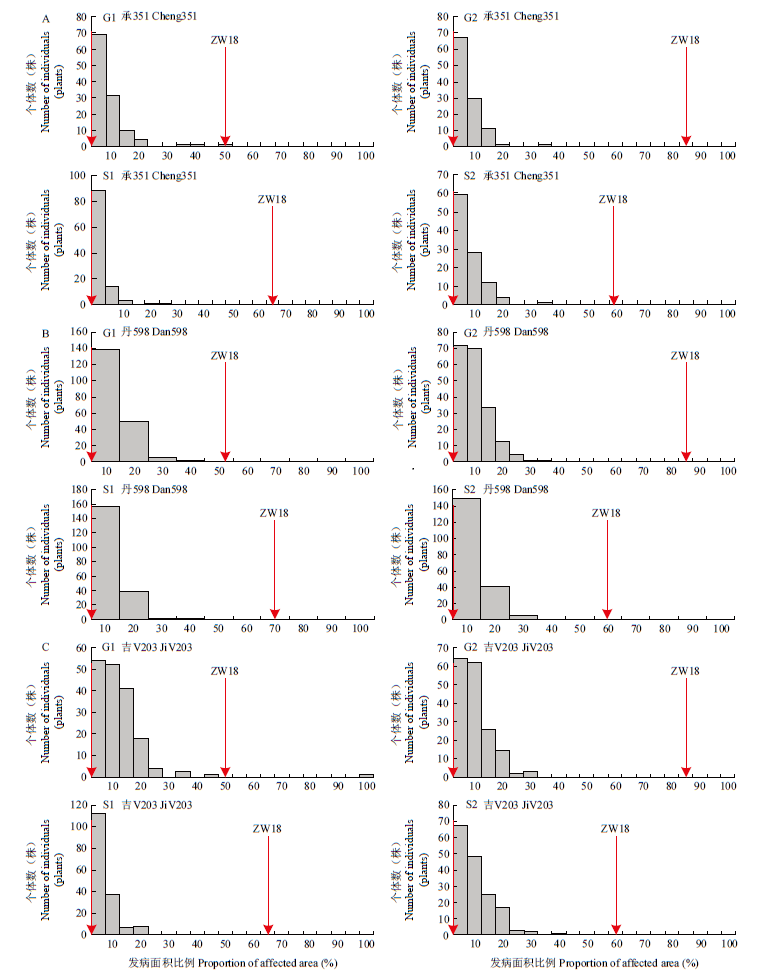
图3
不同群体不同重复的直方图 A:F2-C;B:F2-D;C:F2-J。G1:公主岭第1个重复;G2:公主岭第2个重复;S1:松原第1个重复;S2:松原第2个重复。下同 "
表1
亲本及F2群体的发病面积百分比分析结果 "
| 群体 Populations | 重复 Replication | 抗病亲本 Resistant parents | 感病亲本 Susceptible parents | F2群体 | |||||
|---|---|---|---|---|---|---|---|---|---|
| 平均值 Mean | 标准差 SD | 偏度 Skewness | 峰度 Kurtosis | 变异系数 CV (%) | 遗传力 H2 | ||||
| F2-C | G1 | 0.0 | 49.22 | 6.24 | 7.09 | 3.38 | 15.16 | 113.63 | 0.63 |
| G2 | 0.0 | 82.26 | 5.14 | 4.70 | 2.50 | 11.67 | 91.46 | ||
| S1 | 0.0 | 63.85 | 1.65 | 3.06 | 5.30 | 33.16 | 185.50 | ||
| S2 | 0.0 | 55.38 | 5.41 | 5.09 | 1.96 | 6.41 | 94.03 | ||
| F2-D | G1 | 0.0 | 49.22 | 8.30 | 8.80 | 5.60 | 51.70 | 106.03 | 0.29 |
| G2 | 0.0 | 82.26 | 7.75 | 5.54 | 1.16 | 2.04 | 71.50 | ||
| S1 | 0.0 | 63.85 | 6.11 | 8.62 | 6.61 | 67.02 | 141.03 | ||
| S2 | 2.4 | 55.38 | 7.03 | 8.52 | 6.53 | 66.75 | 121.22 | ||
| F2-J | G1 | 0.0 | 49.22 | 9.74 | 9.30 | 5.60 | 48.80 | 95.52 | 0.56 |
| G2 | 0.0 | 82.26 | 7.73 | 5.34 | 1.23 | 1.51 | 69.02 | ||
| S1 | 1.3 | 63.85 | 4.72 | 4.78 | 2.44 | 8.14 | 101.11 | ||
| S2 | 0.0 | 55.38 | 7.86 | 6.03 | 1.39 | 2.45 | 76.72 | ||
表2
人工接种拟轮枝镰孢菌后玉米穗腐病抗性的方差分析"
| 群体 Populations | 变异来源 Sources | 自由度 Df | 离均差平方和 SS | 均方 MS | F值 F value | P值 P value (>F0.001) | 显著性 Significance | 偏度分析 Pr |
|---|---|---|---|---|---|---|---|---|
| F2-C | G | 117 | 5803.8 | 49.60 | 2.1406 | 8.118e-07 | *** | |
| L | 1 | 553.7 | 553.67 | 23.8927 | 2.015e-06 | *** | ||
| R | 1 | 179.1 | 179.09 | 7.7283 | 0.005928 | ** | ||
| G:L | 107 | 1952.0 | 18.24 | 0.7873 | 0.916935 | |||
| Residuals | 211 | 4889.6 | 23.17 | 7.410274e-15 | ||||
| F2-D | G | 199 | 17047.6 | 85.67 | 1.5483 | 0.0001392 | *** | |
| L | 1 | 410.4 | 410.45 | 7.4184 | 0.0067446 | ** | ||
| R | 1 | 7.5 | 7.55 | 0.1364 | 0.7120661 | |||
| G:L | 196 | 11814.3 | 60.28 | 1.0894 | 0.2392358 | |||
| Residuals | 392 | 21688.7 | 55.33 | 1.390253e-14 | ||||
| F2-J | G | 173 | 12665.6 | 73.21 | 1.8950 | 3.547e-07 | *** | |
| L | 1 | 941.4 | 941.42 | 24.3679 | 1.261e-06 | *** | ||
| R | 1 | 41.6 | 41.61 | 1.0770 | 0.3001 | |||
| G:L | 165 | 5293.4 | 32.08 | 0.8304 | 0.9113 | |||
| Residuals | 333 | 12864.9 | 38.63 | -8.235978e-13 |
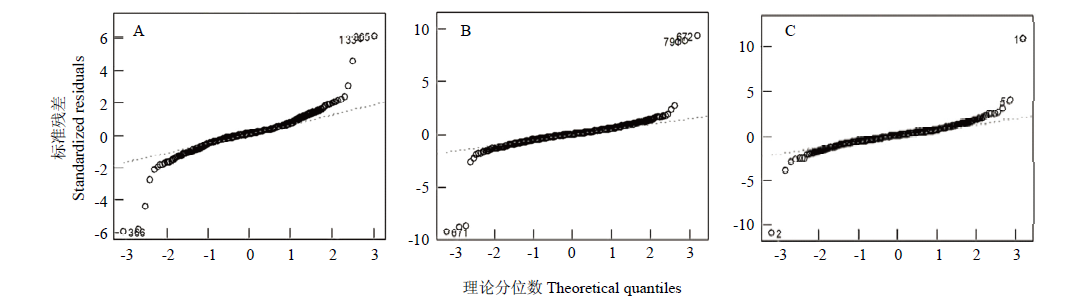
图4
人工接种拟轮枝镰孢菌后F2群体玉米FER抗性的QQ-Plot图 A:F2-C;B:F2-D;C:F2-J "

图5
利用不同群体进行玉米FER抗病的QTL定位 A:F2-C;B:F2-D;C:F2-J。G:G1和G2的平均值;S:S1和S2的平均值;BLUE:最佳线性无偏估计值 "
表3
玉米FER抗病QTLs及其参数"
| 位点 QTL | 染色体 Chr. | 位置Site (Bins) | 重复 Replication | 侧翼标记 Flanking markers | LOD | 加性效应 Additive | 显性效应 Dominance | 抗性来源 SRA | 表型变异率 R2(%) |
|---|---|---|---|---|---|---|---|---|---|
| qRf1 | 1 | 1.04—1.06 | BLUE | e1583803—e1188929 | 4.78 | 1.6956 | -0.7136 | 承351 Cheng351 | 15.60 |
| qRf2 | 2 | 2.02—2.03 | S1 | e2102115—e2161221 | 3.84 | 1.6043 | -1.4111 | 承351 Cheng351 | 21.80 |
| 2 | 2.02 | S | e2102115—e2126291 | 3.78 | 1.5500 | -2.0277 | 承351 Cheng351 | 20.30 | |
| 2 | 2.02—2.03 | BLUE | e2102115—e2161221 | 4.49 | 1.9089 | 0.3621 | 承351 Cheng351 | 9.70 | |
| qRf3 | 4 | 4.06—4.07 | G1 | e4156956—e4175573 | 6.05 | 3.7277 | -2.9966 | 承351 Cheng351 | 25.80 |
| 4 | 4.06—4.07 | BLUE | e4167183—e4179848 | 5.41 | 2.0177 | -0.8886 | 承351 Cheng351 | 19.60 | |
| qRf4 | 8 | 8.06 | G1 | e8161042—e8165169 | 5.61 | 3.9752 | -3.3116 | 承351 Cheng351 | 27.40 |
| 8 | 8.06 | BLUE | e8153595—e8165169 | 6.38 | 2.3975 | -1.2185 | 承351 Cheng351 | 26.00 | |
| qRf5 | 8 | 8.07—8.08 | BLUE | e8167666—e8171604 | 4.19 | -2.0687 | -0.6555 | ZW18 | 7.10 |
| qRf6 | 1 | 1.07 | BLUE | e1197737—e1212331 | 4.16 | -1.3688 | 1.6416 | ZW18 | 10.82 |
| qRf7 | 2 | 2.04 | BLUE | e2365995—e2639635 | 5.93 | 2.1626 | 0.9592 | 丹598 Dan598 | 7.94 |
| qRf8 | 3 | 3.03—3.04 | S | e3106087—e3335621 | 4.09 | 2.1894 | -1.1950 | 丹598 Dan598 | 10.04 |
| qRf9 | 8 | 8.05—8.06 | BLUE | e8130926—e8150778 | 4.48 | 1.8506 | -0.6254 | 丹598 Dan598 | 10.85 |
| qRf10 | 10 | 10.06 | S | e1013859—e1014290 | 4.17 | 2.4951 | -1.4593 | 丹598 Dan598 | 12.32 |
| qRf11 | 1 | 1.06—1.07 | S2 | e1178476—e1200620 | 5.69 | 2.8361 | -1.3421 | 吉V203 JiV203 | 16.50 |
| qRf12 | 3 | 3.04—3.05 | S1 | e3170341—e3154562 | 4.08 | -2.9888 | 0.8469 | ZW18 | 13.46 |
| qRf13 | 3 | 3.06—3.07 | G1 | e3180570—e3195935 | 3.91 | -4.3654 | -0.5613 | ZW18 | 7.38 |
| qRf14 | 4 | 4.01—4.02 | G1 | e4359518—e4107296 | 3.69 | 3.4943 | -2.2933 | 吉V203 JiV203 | 11.93 |
| 4 | 4.01—4.03 | BLUE | e4359518—e4120869 | 4.56 | 1.8443 | -0.5136 | 吉V203 JiV203 | 11.65 | |
| qRf15 | 4 | 4.05—4.07 | G2 | e4689700—e4171651 | 5.91 | 30.334 | -0.8452 | 吉V203 JiV203 | 17.96 |
| 4 | 4.06—4.07 | S2 | e4168742—e4178823 | 5.25 | 3.4990 | 0.6582 | 吉V203 JiV203 | 8.16 | |
| qRf16 | 8 | 8.03—8.05 | S | e8842299—e8144487 | 4.59 | 3.5113 | -2.2912 | 吉V203 JiV203 | 8.15 |
| qRf17 | 9 | 9.03—9.05 | S2 | e9432770—e9128660 | 5.55 | -2.5901 | -2.3177 | ZW18 | 3.61 |
| qRf18 | 9 | 9.06—9.07 | G | e9143806—e9149382 | 3.93 | -2.2164 | -1.6562 | ZW18 | 2.85 |
表4
利用评级法分析的玉米FER抗病QTL及其参数"
| 位点 Name | 染色体 Chr. | 位置 Site (Bins) | 重复 Replication | 侧翼标记 Flanking markers | LOD | 加性效应 Additive | 显性效应 Dominant | 抗性来源 SRA | 表型变异率 R2(%) |
|---|---|---|---|---|---|---|---|---|---|
| qRfer3 | 4 | 4.06—4.07 | G | e4163306—e4177040 | 4.22 | 0.5365 | -0.2592 | 承351 Cheng351 | 18.34 |
| 4.06—4.08 | BLUE | e4167183—e4179848 | 4.78 | 0.4623 | -0.1894 | 承351 Cheng351 | 17.76 | ||
| qRfer6 | 2 | 2.04 | BLUE | e2365995—e2639635 | 5.12 | 0.3268 | 0.0293 | 丹598 Dan598 | 7.02 |
| qRfer13 | 1 | 1.05—1.06 | S1 | e1100903—e1182999 | 5.13 | 0.3924 | 0.2506 | 吉V203 JiV203 | 5.45 |
| 1.06—1.07 | S2 | e1178476—e1202995 | 7.40 | 0.6921 | -0.1173 | 吉V203 JiV203 | 16.73 | ||
| qRfer17 | 4 | 4.05—4.06 | G1 | e4327859—e4163646 | 5.97 | 0.6190 | -0.0758 | 吉V203 JiV203 | 12.02 |
| 4.05—4.07 | G2 | e4978482—e4172059 | 7.83 | 0.7965 | -0.3242 | 吉V203 JiV203 | 21.81 | ||
| 4.05—4.06 | G | e4327859—e4163646 | 8.42 | 0.6540 | -0.1231 | 吉V203 JiV203 | 17.96 | ||
| 4.05—4.06 | BLUE | e4327859—e4163646 | 6.65 | 0.5549 | -0.0784 | 吉V203 JiV203 | 17.37 | ||
| qRfer20 | 9 | 9.03—9.05 | S2 | e9432770—e9130925 | 6.81 | -0.3540 | -0.4352 | ZW18 | 4.10 |
| [1] | ULLSTRUP A J. An undescribed ear rot of corn caused byPhysalospora zeae. Phytopathology, 1946, 36:201-212. |
| [2] | BEZUIDENHOUT H, MAXASAS W F O. Botryosphaeria zeae: The cause of grey ear rot of maize (Zea mays) in South Africa. Phytophylaetica, 1978, 10(1):21-24. |
| [3] | KUMAR V, SHETTY H S. A new ear and kernel rot of maize caused by Trichoderma viride pers. ex Fries. Current Science, 1982, 5(12):620-621. |
| [4] | 张艳, 谭静. 玉米穗粒腐病的研究进展. 现代农业科技, 2014, 21(1):121-125. |
| ZHANG Y, TAN J. Research progress on ear rot in maize. Modern Agricultural Science and Technology, 2014, 21(1):121-122. (in Chinese) | |
| [5] | 任金平. 玉米穗腐病研究进展. 吉林农业科学, 1993(3):39-43. |
| REN J P. Progress in researching of ear rot of maize. Jilin Agricultural Sciences, 1993(3):39-43. (in Chinese) | |
| [6] | 胡南, 章红. 吉林省玉米穗腐病病原真菌中镰刀菌毒素的研究. 玉米科学, 1997, 5(2):66-68. |
| HU N, ZHANG H. A study on production of three Fusarium mycotoxinsof corn ear rot pathogenic fungi in Jilin province . Journal of Maize Sciences, 1997, 5(2):66-68. (in Chinese) | |
| [7] |
WANG J H, NDOYE M, ZHANG J B, LI H P, LIAO Y C. Population structure and genetic diversity of the Fusarium graminearum species complex. Toxins, 2011, 3(8):1020-1037.
doi: 10.3390/toxins3081020 |
| [8] | 王晓鸣, 石洁, 晋齐鸣, 李晓, 孙世贤. 玉米病虫害田间手册. 北京:中国农业科学技术出版社, 2010: 55-61. |
| WANG X M, SHI J, JIN Q M, LI X, SUN S X. Field Manual of Corn Pests and Diseases. Beijing:China Agricultural Science and Technology Press, 2010:55-61. (in Chinese) | |
| [9] | 徐书法, 陈捷, 高增贵, 邹庆道, 纪明山, 刘海南. 中国玉米茎基腐病和穗腐病研究进展. 植物病理学报, 2006, 36(3):193-203. |
| XU S F, CHEN J, GAO Z G, ZOU Q D, JI M S, LIU H N. Maize stalk rot and ear rot in China. Acta Phytopathologica Sinica, 2006, 36(3):193-203. (in Chinese) | |
| [10] | 秦子惠, 任旭, 江凯, 武小菲, 杨知还, 王晓鸣. 我国玉米穗腐病致病镰孢种群及禾谷镰孢复合种的鉴定. 植物保护学报, 2014, 41(5):589-596. |
| QIN Z H, REN X, JIANG K, WU X F, YANG Z H, WANG X M. Identification of Fusarium species and F. graminearum species complex causing maize ear rot in China . Journal of Plant Protection, 2014, 41(5):589-596. (in Chinese) | |
| [11] | 孙华, 张海剑, 郭宁, 石洁, 陈丹, 马红霞. 黄淮海夏玉米主产区穗腐病病原菌的分离鉴定. 植物保护学报, 2017, 44(5):796-802. |
| SUN H, ZHANG H J, GUO N, SHI J, CHEN D, MA H X. Isolation and identification of pathogens causing maize ear rot in Huang-Huai- Hai summer corn region. Journal of Plant Protection, 2017, 44(5):796-802. (in Chinese) | |
| [12] | HAAFSMA A W, LIMAY-RIOS V, TAMBURIC-ILINCIC L. Mycotoxins and Fusarium species associated with maize ear rot in Ontario, Canada. Cereal Research Communications, 2008, 36:525-527. |
| [13] | 孙华, 张海剑, 马红霞, 石洁, 郭宁, 陈丹, 李坡. 春玉米区穗腐病病原菌组成、分布及禾谷镰孢复合种的鉴定. 物病理学报, 2018, 48(1):8-15. |
| SUN H, ZHANG H J, MA H X, SHI J, GUO N, CHEN D, LI P. Composition and distribution of pathogens causing ear rot in spring maize region and identification of Fusarium graminearum species complex . Acta Phytopathologica Sinica, 2018, 48(1):8-15. (in Chinese) | |
| [14] | ATANASOVA V, PONS S, PINSON L, PICOT A, RICHARD F. Chlorogenic acid and maize ear rot resistance: A dynamic study investigating Fusarium graminearum development, deoxynivalenol production and phenolic acid accumulation. Molecular Plant-microbe Interactions, 2012, 25(12):1605-1616. |
| [15] | 张婷, 孙晓东, 吕国忠. 我国东北地区玉米穗腐镰孢菌的种类及其分离频率. 菌物研究, 2011, 9(1):9-14. |
| ZHANG T, SUN X D, LÜ G Z. Fusariumspecies and its isolation frequency from rot ears of maize in northeast China . Journal of Fungal Research, 2011, 9(1):9-14. (in Chinese) | |
| [16] | 潘惠康, 张兰新. 玉米对穗粒腐病菌的抗病性. 华北农学报, 1987, 2(3):86-89. |
| PAN H K, ZHANG L X. Disease resistance of corn to ear and kernel rot. Acta Agriculturae Boreali-Sinica, 1987, 2(3):86-89. (in Chinese) | |
| [17] | 刘春元, 李洪连, 吴建宇, 刘建华. 穗粒腐病菌对玉米幼苗的致病性研究. 河南农业科学, 2005, 11:58-62. |
| LIU C Y, LI H L, WU J Y, LIU J H. Studies on pathogenicity of pathogen of ear and seed rot in maize hybrids to maize seedling blight. Journal of Henan Agricultural Sciences, 2005, 11:58-62. (in Chinese) | |
| [18] | 陈广泉. 河西走廊玉米穗粒腐病侵染规律及发病因子研究. 玉米科学, 2006, 14(1):158-160. |
| CHEN G Q. Study on infection law and disease factor of corn spike kernel rotten in Hexi corridor. Journal of Maize Sciences, 2006, 14(1):158-160. (in Chinese) | |
| [19] | 刘振库, 贾娇, 苏前富, 孟玲敏, 晋齐鸣. 齐齐哈尔玉米穗腐病病原菌的鉴定和致病性测定. 吉林农业科学, 2014, 39(6):28-30. |
| LIU Z K, JIA J, SU Q F, MENG L M, JIN Q M. Identification of pathogen and pathogenicity of maize ear rot in Qiqihaer. Journal of Northeast Agricultural Sciences, 2014, 39(6):28-30. (in Chinese) | |
| [20] |
ZHOU D N, WANG X M, CHEN G K, SUN S L, YANG Y, ZHU Z D, DUAN C X. The major Fusarium species causing maize ear and kernel rot and their toxigenicity in Chongqing, China. Toxins, 2018, 10(2):90-103.
doi: 10.3390/toxins10020090 |
| [21] | 席靖豪, 赵清爽, 林焕洁, 袁虹霞, 丁胜利, 李洪连. 河南省及周边地区玉米穗腐病病原菌的分离及鉴定. 河南科学, 2018, 36(5):688-692. |
| XI J H, ZHAO Q S, LIN H J, YUAN H X, DING S L, LI H L. Isolation and characterization of fungal pathogenic species causing maize ear rot in Henan and beyond provinces. Henan Science, 2018, 36(5):688-692. (in Chinese) | |
| [22] | CHEN J F, SHRESTHA R, DING J Q, ZHENG H J, MU C H, WU J Y, GEORGE M. Genome-wide association study and QTL mapping reveal genomic loci associated with Fusariumear rot resistance in tropical maize germplasm. Genes Genomes Genetics, 2016, 6(12):3803-3815. |
| [23] |
COAN M M D, SENHORINHO H J C, PINTO R J B, SCAPIM C A, TESSMANN D J, WILLIAMS W P, WARBURTON M L. Genome-wide association study of resistance to ear rot byFusariumverticillioides in a tropical field maize and popcorn core collection. Crop Science, 2018, 58(2):564-578.
doi: 10.2135/cropsci2017.05.0322 |
| [24] |
YAO L S, LI Y M, MA C Y, TONG L X, DU F L, XU M L. Combined genome-wide association study and transcriptome analysis reveal candidate genes for resistance to Fusarium ear rot in maize. Journal of Integrative Plant Biology, 2020, 62(10):1535-1551.
doi: 10.1111/jipb.v62.10 |
| [25] |
GUO Z F, ZOU C, LIU X G, WANG S H, LI W X, JEFFERS D, FAN X M, XU M L, XU Y B. Complex genetic system involved inFusarium ear rot resistance in maize as revealed by GWAS, bulked sample analysis, and genomic prediction. Plant Disease, 2020, 104(6):1725-1735.
doi: 10.1094/PDIS-07-19-1552-RE |
| [26] | ZILA C T, SAMAYOA L F, SANTIAGO R, BUTRON A, HOLLAND J B. A genome-wide association study reveals genes associated with Fusarium ear rot resistance in a maize core diversity panel. G3:Genes Genomes Genetics, 2013, 3:2095-2104. |
| [27] |
JU M, ZHOU Z J, MU C, ZHANG X C, GAO J Y, LIANG Y K, CHEN J F, WU Y B, LI X P, WANG S W, WEN J J, YANG L M, WU J Y. Dissecting the genetic architecture ofFusarium verticillioides seed rot resistance in maize by combining QTL mapping and genome-wide association analysis. Scientific Reports, 2017, 7(1):1109-1115.
doi: 10.1038/s41598-017-01187-4 |
| [28] | PEREA B D, HEFFERS D, GONZALEZ D, KHAIRALLAH M, CORTES M, VELAZQUEZ G, AZPIROZ S, SRINIVASAN G, QTL mapping of Fusarium moniliforme ear rot resistance in highland maize, Mexico. Agrociencia, 2001, 35:181-196. |
| [29] |
BUTRON A, SANTIAGO R, CAO A, SAMAYOA L F, MALVAR R A, QTLs for resistance to Fusarium ear rot in a multiparent advanced generation intercross (MAGIC) maize population. Plant Disease, 2019, 103:897-904.
doi: 10.1094/PDIS-09-18-1669-RE |
| [30] | ROBERTSON L A, JINES M, BALINT P J, KLEINSCHMIDT C E, WHITE D G, PAYNE G A, MARAGOS C M, MOLNAR T L, HOLLAND J B, QTL mapping for Fusarium ear rot and fumonisin contamination resistance in two maize populations. Crop Science, 2006, 46(4):17434-1743. |
| [31] |
LI Z M, DING J Q, WANG R X, CHEN J F, SUN X D, CHEN W, SONG W B, DONG H F, DAI X D, XIA Z L, WU J Y,2011. A new QTL for resistance to Fusarium ear rot in maize. Journal of Applied Genetics, 2011, 52(4):403-406.
doi: 10.1007/s13353-011-0054-0 |
| [32] |
DING J Q, WANG X M, CHANDER S, YAN J B, LI J S, QTL mapping of resistance to Fusarium ear rot using a RIL population in maize. Molecular Breeding, 2008, 22(3):395-403.
doi: 10.1007/s11032-008-9184-4 |
| [33] |
CHEN J F, DING J Q, LI H M, LI H, LI Z M, SUN X D, LI J J, WANG R X, DAI X D, DONG H F, SONG W B, CHEN W, XIA Z L, WU J Y. Detection and verification of quantitative trait loci for resistance to Fusarium ear rot in maize. Molecular Breeding, 2012, 30(4):1649-1656.
doi: 10.1007/s11032-012-9748-1 |
| [34] | LIU Y B, HU G H, ZHANG A, LOLADZE A, HU Y X, WANG H, QU J T, ZHANG X C, OLSEN M, VICENTE F S, CROSSA J, LIN F, PRASANNA B M. Genome-wide association study and genomic prediction of Fusarium ear rot resistance in tropical maize germplasm. The Crop Journal, 2020, doi: 10.1016/j.cj.2020.08.008. |
| [35] | 贾玉芳. 玉米穗腐病的发病原因及防治措施. 中国农业信息, 2015(7):51. |
| JIA Y F. Causes of corn ear rot and its control measures. China Agricultural Informatics, 2015(7):51. (in Chinese) | |
| [36] |
ZENG Z B. Precision mapping of quantitative trait loci. Genetics, 1994, 136(4):1457-1468.
doi: 10.1093/genetics/136.4.1457 |
| [37] |
GARCIA S A, THORNSBERRY J M, TH B E. Structure of linkage disequilibrium in plants. Annual Review of Plant Biology, 2003, 54(1):357-374.
doi: 10.1146/annurev.arplant.54.031902.134907 |
| [38] | WEN J, SHEN Y Q, XING Y X, WANG Z Y, HAN S P, LI S J, YANG C M, HAO D Y, ZHANG Y. QTL mapping of Fusarium ear rot resistance in maize. Plant Disease, 2020, doi: 10.1094/PDIS-02-20-0411-RE. |
| [39] | 张艳, 张叶, 王梓钰, 闻竞, 韩四平, 郭嘉, 邢跃先. 44份玉米自交系对镰孢穗腐病的抗性鉴定. 植物遗传资源学报, 2019, 20(2):276-283. |
| ZHANG Y, ZHANG Y, WANG Z Y, WEN J, HAN S P, GUO J, XING Y X. Evaluation of resistance to Fusariumear rot in 44 maize inbred lines . Journal of Plant Genetic Resources, 2019, 20(2):276-283. (in Chinese) | |
| [40] | 邹成佳, 崔丽娜, 章振羽, 张小飞, 李荣进, 陈耕, 李晓. 玉米自交系对轮枝镰孢菌穗腐病的抗性评价, 西南农学报, 2017, 30:1346-1349. |
| ZOU C J, CUI L N, ZHANG Z Y, ZHANG X F, LI R J, CHEN G, LI X. Evaluation of maize inbred lines for resistance to Fusarium verticillioides ear rot . Southwest China Journal of Agricultural Sciences, 2017, 30:1346-1349. (in Chinese) | |
| [41] |
MASCHIETTO V, COLOMBI C, PIRONA R, PEA G, STROZZI F, MAROCCO A, ROSSINI L, LANUBILE A. QTL mapping and candidate genes for resistance to Fusarium ear rot and fumonisin contamination in maize. BMC Plant Biology, 2017, 17(20):20.
doi: 10.1186/s12870-017-0970-1 |
| [42] |
ALESSANDRA L, VALENTINA M, BORRELLI V M, LORENZO S, LOGRIECO A F, ADRIANO M. Molecular basis of resistance to Fusarium ear rot in maize. Frontiers in Plant Science, 2017, 8:1774.
doi: 10.3389/fpls.2017.01774 |
| [43] |
JONG G D, PAMPLONA A K A, PINHO R G, BALESTRE M. Genome-wide association analysis of ear rot resistance caused by Fusarium verticillioides in maize. Genomics, 2018, 110(5):291-303.
doi: 10.1016/j.ygeno.2017.12.001 |
| [44] | KING S B, SCOTT G E. Genotypic differences in maize to kernel infection byFusariummoniliforme. Phytopathology, 1981, 71:1245-1247. |
| [1] | 彭廷燊, 陆久焱, 吴美林, 严雨欣, 刘宏周, 南文斌, 秦小健, 李明, 龚俊义, 梁永书. 多年生水稻黄糯2号和长白7号产量相关性状的QTL分析[J]. 中国农业科学, 2026, 59(7): 1361-1379. |
| [2] | 王亚菲, 闫鹏, 薛金涛, 董学瑞, 孟凡琦, 郭丽娜, 罗艺, 张娟, 董志强, 卢霖. 乙烯利-甜菜碱-水杨酸合剂对高温胁迫下玉米根系建构、生理功能和产量的影响[J]. 中国农业科学, 2026, 59(7): 1439-1455. |
| [3] | 王佳诺, 陈桂平, 李盼, 王丽萍, 南运有, 何蔚, 樊志龙, 胡发龙, 柴强, 殷文, 赵连豪. 免耕地膜两年覆盖提高绿洲灌区玉米产量的灌浆期光合生理机制[J]. 中国农业科学, 2026, 59(6): 1189-1202. |
| [4] | 周新杰, 任昊, 陈应龙, 张吉旺, 赵斌, 任佰朝, 刘鹏, 王洪章. 过氧化钙对渍涝农田夏玉米根系形态及产量形成的影响[J]. 中国农业科学, 2026, 59(6): 1203-1216. |
| [5] | 何继航, 张擎, 吕相月, 薛吉全, 徐淑兔, 刘建超. 不同保绿型玉米杂交种氮效率评价[J]. 中国农业科学, 2026, 59(6): 1217-1230. |
| [6] | 李永娟, 张悦彤, 王艺博, 赵长江, 宋洁, 陈雪丽, 姚钦. 生物炭施用对大豆轮连作系统土壤固氮微生物nifH基因丰度及群落组成的影响[J]. 中国农业科学, 2026, 59(6): 1272-1285. |
| [7] | 李思源, 李鸿萍, 常洪庆, 张森焱, 栗思佳, 崔欣飞, 乔泼, 曾波, 刘桂珍, 刘天学, 汤继华, 李潮海. 增密对不同株高玉米品种产量和农艺性状动态变化的影响[J]. 中国农业科学, 2026, 59(5): 967-984. |
| [8] | 董金龙, 赵莹, 余海兵, 吕建晔, 秦佳琦, 梁晨, 明博, 李少昆. 多模型解析玉米籽粒容重的营养品质贡献度与区域异质性[J]. 中国农业科学, 2026, 59(5): 985-995. |
| [9] | 崔士友, 陈澎军, 缪源卿, 韩继军, 沈俊明. EMS诱变抗草甘膦小麦新种质的创制与大田评价[J]. 中国农业科学, 2026, 59(4): 723-733. |
| [10] | 陈桂平, 韦金贵, 郭瑶, 李盼, 王菲儿, 仇海龙, 冯福学, 殷文. 宽窄行与增密对绿洲灌区玉米光合特性及资源利用的协同效应[J]. 中国农业科学, 2026, 59(2): 278-291. |
| [11] | 张志勇, 谭世超, 熊淑萍, 马新明, 韦一昊, 王小纯. 水氮周年优化对豫北灌区小麦玉米轮作系统产量和氮迁移的影响[J]. 中国农业科学, 2026, 59(2): 336-353. |
| [12] | 叶美金, 陈家婷, 周界光, 尹丽, 胡欣荣, 兰雨昕, 陈斌, 苏龙兴, 刘家君, 刘天超, 李小雨, 马建. 小麦穗密度主效QTL的鉴定、验证及其遗传效应分析[J]. 中国农业科学, 2026, 59(1): 17-28. |
| [13] | 陈冰嬬, 唐玉劼, 张丽霞, 周宇飞, 于淼, 石贵山, 王新鼎, 李扬, 高士杰, 陆晓春, 王鼐, 刁现民. 中国粒用杂交高粱的绿色革命[J]. 中国农业科学, 2025, 58(8): 1494-1507. |
| [14] | 韦文华, 李盼, 邵冠贵, 樊志龙, 胡发龙, 范虹, 何蔚, 柴强, 殷文, 赵连豪. 西北灌区青贮玉米产量及品质对减量灌水与有机无机肥配施的响应[J]. 中国农业科学, 2025, 58(8): 1521-1534. |
| [15] | 薛钰琦, 赵继玉, 孙旺胜, 任佰朝, 赵斌, 刘鹏, 张吉旺. 不同氮素形态对夏玉米产量和品质的影响[J]. 中国农业科学, 2025, 58(8): 1535-1549. |
|
||