


中国农业科学 ›› 2018, Vol. 51 ›› Issue (10): 1878-1889.doi: 10.3864/j.issn.0578-1752.2018.10.007
所属专题: 机械粒收推动玉米生产方式转型
李璐璐( ), 明博(), 高尚, 谢瑞芝, 侯鹏, 王克如(), 李少昆()
收稿日期:2017-06-15
接受日期:2017-12-05
出版日期:2018-05-16
发布日期:2018-05-16
联系方式:
联系方式:李璐璐,Tel:18611748642;E-mail:lilulu19910818@163.com。明博,Tel:13581680514;E-mail:mingbo@caas.cn。李璐璐和明博为同等贡献作者。
基金资助:
LuLu LI(), Bo MING(), Shang GAO, RuiZhi XIE, Peng HOU, KeRu WANG(), ShaoKun LI()
Received:2017-06-15
Accepted:2017-12-05
Published:2018-05-16
Online:2018-05-16
摘要:
目的 当前,玉米收获期籽粒含水率普遍偏高,限制了中国机械粒收技术的推广应用。玉米籽粒授粉后,灌浆与脱水过程相伴,但二者之间的关系并不明确,本研究通过对不同玉米品种籽粒脱水和灌浆过程的系统观测,明确其籽粒脱水和灌浆特征,探讨二者间的关系,为适宜机械粒收品种的选育和推广提供支持。方法 试验于2015—2016年在河南新乡进行,累计选用22个供试玉米品种,统一授粉。2015年自授粉后26 d开始至11月14日止、2016年自授粉后11 d开始至10月17日止,连续测定籽粒含水率(MC)、含水量(M)、干重(DW)与鲜重(FW)的动态变化,建立这些指标与授粉后积温(T)之间的回归方程,以此明确籽粒脱水和灌浆特征,并结合籽粒脱水、灌浆参数的相关分析结果,探讨这两个过程的关系。结果 玉米籽粒含水率、含水量、干重及鲜重的动态变化与授粉后积温均有极显著的非线性关系。22个参试玉米品种籽粒含水率与授粉后积温的关系符合Logistic Power模型。授粉后,参试品种含水率降至28%需要积温1 126—1 646℃·d,平均1 357℃·d;含水率降至25%需要积温1 218—1 810℃·d,平均1 480℃·d。综合分析籽粒干物质和含水量的变化动态,籽粒含水率变化可分为两个阶段。第一个阶段从籽粒建成至线性灌浆期结束为止,干物质的快速积累是含水率快速下降的主导因素;第二阶段自线性灌浆期结束至籽粒收获,含水率下降的主导因素转化为籽粒水分的持续散失。相关分析显示,玉米灌浆期天数、积温与生理成熟期籽粒含水率在2015年达到极显著负相关,2016年相关性不显著;不同品种生理成熟前、后及总脱水速率与灌浆速率之间相关性不显著。结论 籽粒含水率与授粉后积温建立的Logistic Power回归模型具有良好的预测稳定性。籽粒含水率的变化由籽粒灌浆和籽粒脱水两个关键因素分阶段主导,评价适宜机械粒收的品种,不仅要注意籽粒灌浆特性和熟期,还要关注籽粒脱水特性的选择。
李璐璐, 明博, 高尚, 谢瑞芝, 侯鹏, 王克如, 李少昆. 夏玉米籽粒脱水特性及与灌浆特性的关系[J]. 中国农业科学, 2018, 51(10): 1878-1889.
LuLu LI, Bo MING, Shang GAO, RuiZhi XIE, Peng HOU, KeRu WANG, ShaoKun LI. Study on Grain Dehydration Characters of Summer Maize and Its Relationship with Grain Filling[J]. Scientia Agricultura Sinica, 2018, 51(10): 1878-1889.
表1
试验处理"
| 年份 Year | 试验处理 Experimental treatment | 玉米品种名称 Maize Cultivar |
|---|---|---|
| 2015 | 6月16日播种,随机区组设计,每品种3次重复,小区长8 m,宽5.4 m,面积43.2 m2 Sowing on 16 June; Randomized block design with three replications; The plots were 8 m long and 5.4 m wide and had an area of 43.2 m2 | 郑单958、先玉335、农华101、农华816、京农科728、中单909、宁玉721、联创808、裕丰303、中科玉505、禾田1号 ZD958, XY335, NH101, NH816, JNK728, ZD909, NY721, LC808, YF303, ZKY505, HT1 |
| 2016 | 6月4日播种,大区种植,每区长18 m,宽7.8 m,面积140.4 m2 Sowing on 4 June; Big plots; The plots were 18 m long and 7.8 m wide and had an area of 140.4 m2 | 郑单958、先玉335、农华101、农华816、京农科728、中单909、华美1号、真金323、新单58、新单65、辽单575、锦华318、锦华207、金通152、迪卡517、陕单636、丰垦139 ZD958, XY335, NH101, NH816, JNK728, ZD909, HM1, ZJ323, XD58, XD65, LD575, JH318, JH207, JT152, DK517, SD636, FK139 |
表2
不同品种玉米生育进程与积温"
| 年份 Year | 品种 Cultivar | 出苗 Emergence (M-D) | 吐丝 Silking (M-D) | 授粉 Pollination (M-D) | 生理成熟 Physiological maturity | 授粉-生理成熟天数 Days from pollination to physiological maturity (d) | 授粉-生理成熟积温 Accumulated temperature from pollination to physiological maturity (℃·d) |
|---|---|---|---|---|---|---|---|
| 2015 | JNK728 | 6-23 | 8-7 | 8-9 | 9-28 | 50 | 1200 |
| NH816 | 6-23 | 8-10 | 8-12 | 10-8 | 57 | 1316 | |
| NH101 | 6-23 | 8-9 | 8-12 | 10-11 | 60 | 1365 | |
| ZD909 | 6-23 | 8-9 | 8-12 | 10-15 | 64 | 1439 | |
| ZD958 | 6-23 | 8-9 | 8-10 | 10-14 | 65 | 1475 | |
| XY335 | 6-23 | 8-9 | 8-10 | 10-14 | 65 | 1475 | |
| YF303 | 6-23 | 8-9 | 8-10 | 10-18 | 69 | 1553 | |
| NY721 | 6-23 | 8-10 | 8-13 | 10-19 | 67 | 1485 | |
| LC808 | 6-23 | 8-10 | 8-12 | 10-15 | 64 | 1439 | |
| ZKY505 | 6-23 | 8-10 | 8-13 | 10-15 | 63 | 1410 | |
| HT1 | 6-23 | 8-3 | 8-6 | 9-23 | 48 | 1166 | |
| 2016 | JNK728 | 6-9 | 7-26 | 7-26 | 9-12 | 48 | 1291 |
| NH816 | 6-9 | 7-29 | 7-29 | 9-20 | 53 | 1389 | |
| NH101 | 6-9 | 7-28 | 7-28 | 9-20 | 54 | 1421 | |
| ZD909 | 6-9 | 7-30 | 7-31 | 9-28 | 59 | 1501 | |
| ZD958 | 6-9 | 7-31 | 7-31 | 9-28 | 59 | 1501 | |
| XY335 | 6-9 | 7-30 | 7-30 | 9-26 | 58 | 1490 | |
| DK517 | 6-9 | 7-28 | 7-28 | 9-21 | 55 | 1443 | |
| ZJ323 | 6-9 | 7-29 | 7-29 | 9-20 | 53 | 1389 | |
| SD636 | 6-9 | 7-26 | 7-26 | 9-19 | 55 | 1459 | |
| LD575 | 6-9 | 7-29 | 7-29 | 9-20 | 53 | 1389 | |
| HM1 | 6-9 | 7-25 | 7-25 | 9-13 | 50 | 1344 | |
| FK139 | 6-9 | 7-23 | 7-24 | 9-5 | 43 | 1179 | |
| JT152 | 6-9 | 7-29 | 7-29 | 9-23 | 56 | 1457 | |
| JH207 | 6-9 | 7-29 | 7-29 | 9-23 | 56 | 1457 | |
| JH318 | 6-9 | 7-28 | 7-28 | 9-26 | 60 | 1553 | |
| XD65 | 6-9 | 7-28 | 7-28 | 9-19 | 53 | 1400 | |
| XD58 | 6-9 | 7-25 | 7-25 | 9-15 | 52 | 1394 |
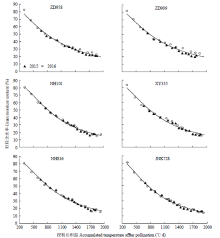
图1
不同品种籽粒含水率预测模型"
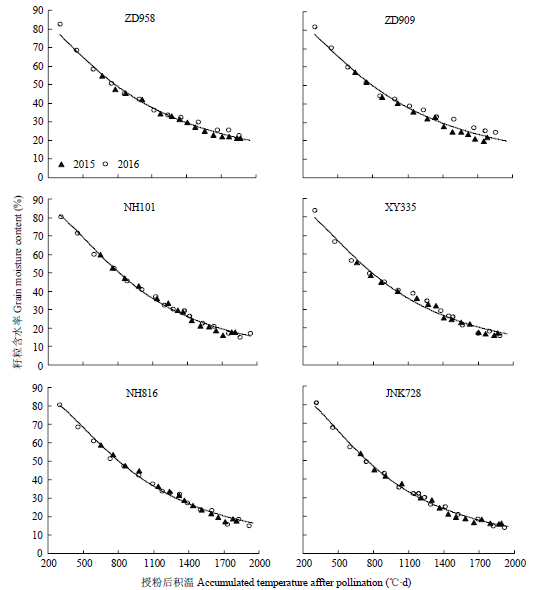
表3
不同玉米品种Logistic Power模型拟合结果"
| 年份 Year | 品种 Cultivar | b | c | R2 | 授粉—28%含水率积温 Accumulated temperature from pollination to 28% MC (℃·d) | 授粉—25%含水率积温 Accumulated temperature from pollination to 25% MC (℃·d) |
|---|---|---|---|---|---|---|
| 2015 | HT1 | 811.189 | 2.337 | 0.962** | 1140 | 1221 |
| ZKY505 | 877.380 | 1.993 | 0.984** | 1307 | 1417 | |
| LC808 | 895.960 | 1.943 | 0.986** | 1349 | 1465 | |
| NY721 | 892.299 | 1.682 | 0.968** | 1431 | 1575 | |
| YF303 | 950.148 | 1.769 | 0.985** | 1489 | 1630 | |
| 2016 | FK139 | 836.987 | 1.829 | 0.994** | 1293 | 1411 |
| DK517 | 838.297 | 1.833 | 0.989** | 1293 | 1412 | |
| JH207 | 851.805 | 1.834 | 0.986** | 1314 | 1434 | |
| HM1 | 915.269 | 2.121 | 0.992** | 1331 | 1436 | |
| XD65 | 843.911 | 1.742 | 0.995** | 1332 | 1461 | |
| JT152 | 908.628 | 1.961 | 0.986** | 1363 | 1479 | |
| XD58 | 881.079 | 1.750 | 0.994** | 1388 | 1521 | |
| LD575 | 884.834 | 1.750 | 0.986** | 1394 | 1528 | |
| ZJ323 | 899.704 | 1.770 | 0.988** | 1410 | 1544 | |
| SD636 | 936.666 | 1.921 | 0.984** | 1417 | 1540 | |
| JH318 | 920.968 | 1.770 | 0.994** | 1443 | 1580 | |
| 2015-2016 | JNK728 | 834.19 | 1.952 | 0.993** | 1253 | 1361 |
| NH101 | 904.387 | 2.029 | 0.993** | 1338 | 1448 | |
| XY335 | 886.981 | 1.879 | 0.982** | 1354 | 1475 | |
| NH816 | 903.747 | 1.944 | 0.989** | 1360 | 1477 | |
| ZD958 | 896.136 | 1.612 | 0.988** | 1467 | 1621 | |
| ZD909 | 925.174 | 1.687 | 0.986** | 1482 | 1630 |
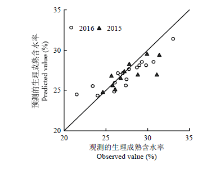
图2
生理成熟期籽粒含水率模型预测值与测定值的关系"
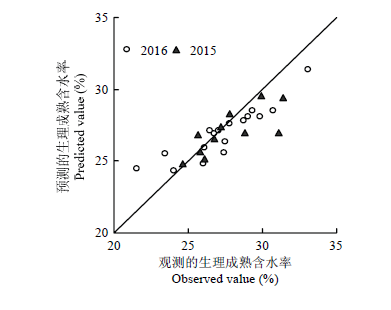
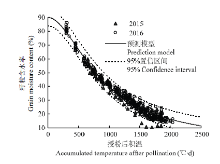
图3
参试品种籽粒含水率预测模型"
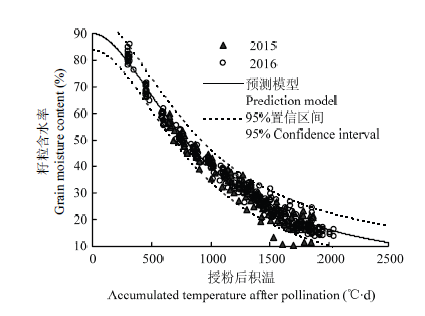
表4
玉米籽粒含水率与需要的授粉后积温"
| 数值范围 Value range | 28%含水率 28%MC | 25%含水率 25%MC | 20%含水率 20%MC | 15%含水率 15%MC |
|---|---|---|---|---|
| 预测值 Predicted value | 1357 | 1480 | 1738 | 2107 |
| 95%置信区间上限Upper bound of 95% confidence interval | 1646 | 1810 | 2159 | 2672 |
| 95%置信区间下限 Lower bound of 95% confidence interval | 1126 | 1218 | 1405 | 1665 |
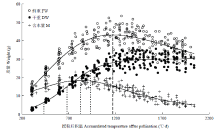
图4
玉米籽粒含水量、鲜重和干重随授粉后积温的变化"
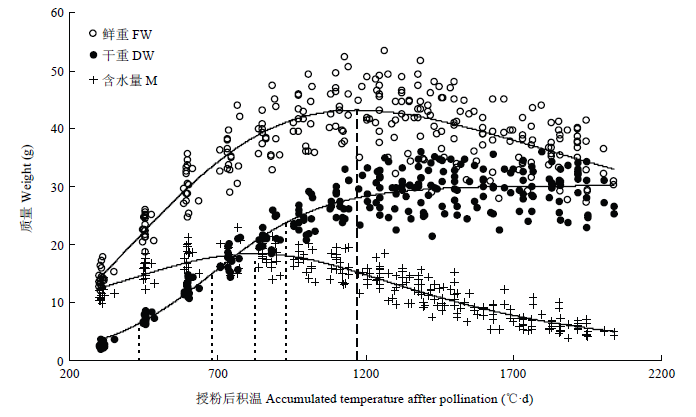
表5
玉米籽粒脱水与灌浆参数相关分析"
| 年份 | 授粉-生理 | 授粉-生理 | 生理成熟期含水率 | 收获期含水率 | 生理成熟期 | 平均灌浆速率 | 生理成熟前平均 | 生理成熟后平均 | 总脱水 | |
|---|---|---|---|---|---|---|---|---|---|---|
| Year | 成熟天数 | 成熟积温 | MC at physiological maturity | MC at | 百粒干重 | Average | 脱水速率 | 脱水速率 | 速率 | |
| Days from pollination to physiological maturity | Accumulated temperature from pollination to physiological maturity | harvest | 100-kernel dry weight at physiological maturity | filling rate | Average dehydration rate before physiological maturity | Average dehydration rate after physiological maturity | Total dehydration rate | |||
| 授粉-生理成熟天数 | 2015 | 1 | 0.995** | -0.815** | 0.192 | 0.785** | -0.273 | -0.940** | -0.800** | -0.942** |
| Days from pollination to physiological maturity | 2016 | 1 | 0.991** | -0.309 | -0.248 | 0.642** | 0.176 | -0.794** | 0.06 | -0.696** |
| 授粉-生理成熟积温 | 2015 | 1 | -0.810** | 0.194 | 0.791** | -0.269 | -0.943** | -0.806** | -0.950** | |
| Accumulated temperature | 2016 | 1 | -0.356 | -0.299 | 0.589* | 0.107 | -0.773** | 0.067 | -0.677** | |
| from pollination to physiological maturity | ||||||||||
| 生理成熟期含水率 | 2015 | 1 | 0.317 | -0.906** | -0.193 | 0.577 | 0.620* | 0.627* | ||
| MC at physiological | 2016 | 1 | 0.843** | -0.418 | -0.304 | -0.316 | 0.055 | -0.274 | ||
| maturity | ||||||||||
| 收获期含水率 | 2015 | 1 | -0.23 | -0.610* | -0.433 | -0.477 | -0.432 | |||
| MC at harvest | 2016 | 1 | -0.283 | -0.163 | -0.271 | -0.411 | -0.407 | |||
| 生理成熟期百粒干重 | 2015 | 1 | 0.374 | -0.595 | -0.53 | -0.617* | ||||
| 100-kernel dry weight at physiological maturity | 2016 | 1 | 0.866** | -0.301 | 0.046 | -0.212 | ||||
| 平均灌浆速率 | 2015 | 1 | 0.492 | 0.345 | 0.455 | |||||
| Average filling rate | 2016 | 1 | 0.114 | 0.004 | 0.161 | |||||
| 生理成熟前平均脱水 | 2015 | 1 | 0.768** | 0.979** | ||||||
| 速率 | 2016 | 1 | -0.092 | 0.879** | ||||||
| Average dehydration | ||||||||||
| rate before physiological maturity | ||||||||||
| 生理成熟后平均脱水 | 2015 | 1 | 0.866** | |||||||
| 速率 | 2016 | 1 | 0.368 | |||||||
| Average dehydration rate after physiological maturity | ||||||||||
| 总脱水速率 | 2015 | 1 | ||||||||
| Total dehydration rate | 2016 | 1 |
| [1] | 柳枫贺, 王克如, 李健, 王喜梅, 孙亚玲, 陈永生, 王玉华, 韩冬生, 李少昆. 影响玉米机械收粒质量因素的分析. 作物杂志, 2013(4):116-119. |
| LIU F H, WANG K R, LI J, WANG X M, SUN Y L, CHEN Y S, WANG Y H, HAN D S, LI S K.Factors affecting corn mechanically harvesting grain quality. Crops, 2013(4): 116-119. (in Chinese) | |
| [2] | 谢瑞芝, 雷晓鹏, 王克如, 郭银巧, 柴宗文, 侯鹏, 李少昆.黄淮海夏玉米籽粒机械收获研究初报. 作物杂志, 2014(2): 76-79. |
| XIE R Z, LEI X P, WANG K R, GUO Y Q, CHAI Z W, HOU P, LI S K.Research on corn mechanically harvesting grain quality in Huanghuaihai Plain. Crops, 2014(2): 76-79. (in Chinese) | |
| [3] | FILIPENCO A, MANDACHE V, VALSAN G, IVAN F, CIOCAZANU I.Inheritance of grain dry-down in corn (Zea mays L.). Bulletin of University of Agricultural Sciences and Veterinary Medicine Cluj-Napoca, 2013, 70(1): 223-226. |
| [4] |
王克如, 李少昆. 玉米机械粒收破碎率研究进展. 中国农业科学, 2017, 50(11): 2018-2026.
doi: 10.3864/j.issn.0578-1752.2017.11.007 |
|
WANG K R, LI S K.Progresses in research on grain broken rate by mechanical grain harvesting.Scientia Agricultura Sinica, 2017, 50(11): 2018-2026. (in Chinese)
doi: 10.3864/j.issn.0578-1752.2017.11.007 |
|
| [5] | 柴宗文, 王克如, 郭银巧, 谢瑞芝, 李璐璐, 明博, 侯鹏, 刘朝巍, 初振东, 张万旭, 张国强, 刘广周, 李少昆. 玉米机械粒收质量现状及其与含水率的关系. 中国农业科学, 2017, 50(11): 2036-2043. |
| CHAI Z W, WANG K R, GUO Y Q, XIE R Z, LI L L, MING B, HOU P, LIU C W, CHU Z D, ZHANG W X, ZHANG G Q, LIU G Z, LI S K.Current status of maize mechanical grain harvesting and its relationship with grain moisture content.Scientia Agricultura Sinica, 2017, 50(11): 2036-2043. (in Chinese) | |
| [6] |
李璐璐, 雷晓鹏, 谢瑞芝, 王克如, 侯鹏, 张凤路, 李少昆. 夏玉米机械粒收质量影响因素分析. 中国农业科学, 2017, 50(11): 2044-2051.
doi: 10.3864/j.issn.0578-1752.2017.11.010 |
|
LI L L, LEI X P, XIE R Z, WANG K R, HOU P, ZHANG F L, LI S K.Analysis of influential factors on mechanical grain harvest quality of summer maize.Scientia Agricultura Sinica, 2017, 50(11): 2044-2051. (in Chinese)
doi: 10.3864/j.issn.0578-1752.2017.11.010 |
|
| [7] | 宋松泉, 程红焱, 姜孝成. 种子生物学. 第一版.北京: 科学出版社, 2008. |
| SONG S Q, CHENG H Y, JIANG X C. Seed Biology.1st edition. Beijing: Science Press, 2008. (in Chinese) | |
| [8] |
伍贤进, 宋松泉, 张素平, 傅家瑞. 玉米种子萌发能力和耐脱水能力的形成. 热带亚热带植物学报, 2002, 10(2): 177-182.
doi: 10.3969/j.issn.1005-3395.2002.2.012 |
|
WU X J, SONG S Q, ZHANG S P, FU J R.Formation of desiccation tolerance and germinability during development of Zea mays L. seeds. Journal of Tropical and Subtropical Botany, 2002, 10(2): 177-182. (in Chinese)
doi: 10.3969/j.issn.1005-3395.2002.2.012 |
|
| [9] | MAIORANO A, FANCHINI D, DONATELLI M.MIMYCS. Moisture, a process-based model of moisture content in developing maize kernels.European Journal of Agronomy, 2014, 59: 86-95. |
| [10] |
BROOKING I R.Maize ear moisture during grain-filling, and its relation to physiological maturity and grain-drying.Field Crops Research, 1990, 23(1): 55-68.
doi: 10.1016/0378-4290(90)90097-U |
| [11] | 申琳. 夏玉米籽粒灌浆与籽粒含水率的关系及籽粒发育过程的分期. 北京农业科学, 1998, 16(5): 6-9. |
| SHEN L.Relationship between grain filling and grain moisture content and staging of grain development in summer maize.Beijing Agricultural Sciences, 1998, 16(5): 6-9. (in Chinese) | |
| [12] |
CRANE P L.Factors associated with varietal differences in rate of field drying in corn.Agronomy Journal, 1959, 51(6): 318-320.
doi: 10.2134/agronj1959.00021962005100060003x |
| [13] | MA B L, DWYER L M.Maize kernel moisture, carbon and nitrogen concentrations from silking to physiological maturity.Canadian Journal of Plant Science, 2001, 81(2): 225-232. |
| [14] | 李德新. 玉米籽粒灌浆、脱水速率品种差异和相关分析[D]. 北京: 中国农业科学院, 2009. |
| LI D X.Varieties and correlation analysis of grain filling and dehydration rate in maize[D]. Beijing: Chinese Academy of Agricultural Sciences, 2009. (in Chinese) | |
| [15] | 孙月轩, 姜先梅, 张作木, 单玉清, 鲍继友, 孙顶太. 夏玉米灌浆与温度、籽粒含水率关系的初步探讨. 玉米科学, 1994, 2(1): 54-58. |
| SUN Y X, JIANG X M, ZHANG Z M, SHAN Y Q, BAO J Y, SUN D T.Preliminary study on relationship between grain filling and temperature and grain moisture content of summer maize.Maize Sciences, 1994, 2(1): 54-58. (in Chinese) | |
| [16] | 乔江方, 李川, 刘京宝, 谷利敏, 夏来坤, 朱卫红, 黄璐, 薛华政. 不同自然脱水类型玉米品种子粒含水率变化与灌浆动态的关系. 玉米科学, 2015, 23(5): 96-101. |
| QIAO J F, LI C, LIU J B, GU L M, XIA L K, ZHU W H, HUANG L, XUE H Z.Relationship between grain water content and seed filling dynamic of different types of natural dehydration maize varieties.Journal of Maize Sciences, 2015, 23(5): 96-101. (in Chinese) | |
| [17] | 武维华. 植物生理学. 第二版. 北京: 科学出版社, 2008. |
| WU W H. Plant Physiology.2nd edition. Beijing: Science Press, 2008. (in Chinese) | |
| [18] | 荆彦平. 小麦和玉米颖果的生长及胚乳细胞的发育[D]. 扬州: 扬州大学, 2014. |
| JING Y P.The caryopsis growth and the endosperm cell development in wheat and maize[D]. Yangzhou: Yangzhou University, 2014. (in Chinese) | |
| [19] |
DAYNARD T B.Relationships among black layer formation, grain moisture percentage, and heat unit accumulation in corn.Agronomy Journal, 1972, 64(6): 716-719.
doi: 10.2134/agronj1972.00021962006400060003x |
| [20] |
RUSSELLE M P, WILHELM W W, OLSON R A, POWER J F.Growth analysis based on degree days.Crop Science, 1984, 24(1): 28-32.
doi: 10.2135/cropsci1984.0011183X002400010007x |
| [21] |
CROSS H Z, ZUBER M S.Prediction of flowering dates in maize based on different methods of estimating thermal units.Agronomy Journal, 1972, 64(3): 351-355.
doi: 10.2134/agronj1972.00021962006400030029x |
| [22] | |
| [23] |
郭庆辰, 康浩冉, 王丽娥, 刘洪泉, 陈艳花, 白光红, 窦秉德. 黄淮区籽粒机收玉米标准及育种模式探讨. 农业科技通讯, 2016(1): 159-162.
doi: 10.3969/j.issn.1000-6400.2016.01.053 |
|
GUO Q C, KANG H R, WANG L E, LIU H Q, CHEN Y H, BAI G H, DOU B D.The standard of corn grain mechanical harvest and breeding mode in Huang-Huai Region. Bulletin of Agricultural Science and Technology, 2016(1): 159-162. (in Chinese)
doi: 10.3969/j.issn.1000-6400.2016.01.053 |
|
| [24] |
CROSS H Z.Leaf expansion rate effects on yield and yield components in early maturing maize.Crop Science, 1991, 31(3): 579-583.
doi: 10.2135/cropsci1991.0011183X003100030006x |
| [25] |
SCHMIDT J L, HALLAUER A R.Estimating harvest date of corn in the field.Crop Science, 1966, 6(3): 227-231.
doi: 10.2135/cropsci1966.0011183X000600030003x |
| [26] | 向葵. 玉米籽粒脱水速率测定方法优化及遗传研究[D]. 雅安: 四川农业大学, 2011. |
| XIANG K.Genetic analysis and measuring method development of kernel fast dry down rate in maize[D]. Ya’an: Sichuan Agricultural University, 2011. (in Chinese) | |
| [27] |
CUTFORTH H W, SHAYKEWICH C F.A temperature response function for corn development.Agricultural and Forest Meteorology, 1990, 50(3): 159-171.
doi: 10.1016/0168-1923(90)90051-7 |
| [28] |
DWYER L M, STEWART D W, CARRIGAN L, MA B L, NEAVE P, BALCHIN D.A general thermal index for maize.Agronomy Journal, 1999, 91(6): 940-946.
doi: 10.2134/agronj1999.916940x |
| [29] | 李璐璐, 王克如, 谢瑞芝, 明博, 赵磊, 李姗姗, 侯鹏, 李少昆. 玉米生理成熟后田间脱水期间的籽粒重量与含水率变化. 中国农业科学, 2017, 50(11): 2052-2060. |
| LI L L, WANG K R, XIE R Z, MING B, ZHAO L, LI S S, HOU P, LI S K.Corn kernel weight and moisture content after physiological maturity in field.Scientia Agricultural Sinica, 2017, 50(11): 2052-2060. (in Chinese) | |
| [30] |
GAMBIN B L, BORRAS L, OTEGUI M E.Kernel water relations and duration of grain filling in maize temperate hybrids.Field Crops Research, 2007, 101(1): 1-9.
doi: 10.1016/j.fcr.2006.09.001 |
| [31] |
MISEVIC D, ALEXANDER D E, DUMANOVIC J, KERECKI B, RATKOVIC S.Grain moisture loss rate of high-oil and standard-oil maize hybrids.Agronomy Journal, 1988, 80(5): 841-845.
doi: 10.2134/agronj1988.00021962008000050032x |
| [32] | 张立国, 张林, 管春云, 金益, 王振华, 任晓亮, 宫纪娟. 玉米生理成熟后籽粒脱水速率与品质性状的相关分析. 东北农业大学学报, 2007, 38(5): 582-585. |
| ZHANG L G, ZHANG L, GUAN C Y, JIN Y, WANG Z H, REN X L, GONG J J.Correlation analysis on dry-down rate and quality traits in corn after physiological maturity.Journal of Northeast Agricultural University, 2007, 38(5): 582-585. (in Chinese) | |
| [33] | MATHRE D E, JOHNSTON R H, MARTIN J M.Sources of resistance to Cephalosporium gramineum in Triticum and Agropyron species. Euphytica, 1985, 34(2): 419-424. |
| [34] |
张立国, 范骐骥, 陈喜昌, 李波, 张宇, 修丽丽. 玉米生理成熟后籽粒脱水速率与主要农艺性状的相关分析 . 黑龙江农业科学, 2012(3): 1-5.
doi: 10.3969/j.issn.1002-2767.2012.03.001 |
|
ZHANG L G, FAN Q J, CHEN X C, LI B, ZHANG Y, XIU L L.Correlation analysis on dry-down rate and main agricultural traits in maize after physiological maturity.Heilongjiang Agricultural Sciences, 2012(3): 1-5. (in Chinese)
doi: 10.3969/j.issn.1002-2767.2012.03.001 |
|
| [35] |
李璐璐, 谢瑞芝, 王克如, 明博, 侯鹏, 李少昆. 黄淮海夏玉米生理成熟期籽粒含水率研究. 作物杂志, 2017(2): 88-92.
doi: 10.16035/j.issn.1001-7283.2017.02.015 |
|
LI L L, XIE R Z, WANG K R, MING B, HOU P, LI S K.Study on kernel moisture content of summer maize at physiological maturity in Huanghuaihai Region.Crops, 2017(2): 88-92. (in Chinese)
doi: 10.16035/j.issn.1001-7283.2017.02.015 |
|
| [36] |
魏亚萍, 王璞, 陈才良. 关于玉米粒重的研究. 植物学通报, 2004, 21(1): 37-43.
doi: 10.3969/j.issn.1674-3466.2004.01.005 |
|
WEI Y P, WANG P, CHEN C L.Studies on the grain weight in maize.Chinese Bulletin of Botany, 2004, 21(1): 37-43. (in Chinese)
doi: 10.3969/j.issn.1674-3466.2004.01.005 |
|
| [37] |
黄振喜, 王永军, 王空军, 李登海, 赵明, 柳京国, 董树亭, 王洪军, 王军海, 杨今胜. 产量15 000 kg·ha-1以上夏玉米灌浆期间的光合特性. 中国农业科学, 2007, 40(9): 1898-1906.
doi: 10.3321/j.issn:0578-1752.2007.09.008 |
|
HUANG Z X, WANG Y J, WANG K J, LI D H, ZHAO M, LIU J G, DONG S T, WANG H J, WANG J H, YANG J S.Photosynthetic characteristics during grain filling stage of summer maize hybrids with high yield potential of 15 000 kg·ha-1.Scientia Agricultural Sinica, 2007, 40(9): 1898-1906. (in Chinese)
doi: 10.3321/j.issn:0578-1752.2007.09.008 |
| [1] | 马红霞, 孙华, 郭宁, 刘树森, 张海剑, 石洁. 基于PCR和巢式PCR技术的玉米南方锈病早期检测[J]. 中国农业科学, 2023, 56(9): 1686-1695. |
| [2] | 尉亚囡, 薄其飞, 唐安, 高嘉瑞, 马田, 尉熊熊, 张方方, 周祥利, 岳善超, 李世清. 长期覆膜和施用有机肥对黄土高原春玉米产量和品质的效应[J]. 中国农业科学, 2023, 56(9): 1708-1717. |
| [3] | 温媛媛, 李妍, 李建国, 王美美, 于长辉, 沈宜钊, 高艳霞, 李秋凤, 曹玉凤. 马铃薯条加工副产品与稻草混贮对奶公牛育肥性能和血液生化指标的影响[J]. 中国农业科学, 2023, 56(9): 1800-1812. |
| [4] | 路梦莉, 张雅婷, 任红, 王土金, 韩一鸣, 李文阳, 李从锋. 增密对春玉米籽粒胚乳淀粉粒度分布与黏度参数的影响[J]. 中国农业科学, 2023, 56(9): 1646-1657. |
| [5] | 李俊, 单露英, 肖芳, 李允静, 高鸿飞, 翟杉杉, 吴刚, 张秀杰, 武玉花. 转基因玉米MON87427梯度含量基体标准物质的研制[J]. 中国农业科学, 2023, 56(8): 1444-1455. |
| [6] | 刘梦洁, 梁飞, 李全胜, 田宇欣, 王国栋, 贾宏涛. 膜下滴灌与细流沟灌对玉米生长及产量的影响[J]. 中国农业科学, 2023, 56(8): 1515-1530. |
| [7] | 范鑫, 李宇鑫, 邝吉卫, 杨婷, 刘苗苗, 曹云刚, 黄峻榕. 超声辅助玉米醇溶蛋白基乙烯吸附膜的制备及其香蕉保鲜性能[J]. 中国农业科学, 2023, 56(8): 1574-1584. |
| [8] | 马胜兰, 况福虹, 林洪羽, 崔俊芳, 唐家良, 朱波, 蒲全波. 秸秆还田量对川中丘陵冬小麦-夏玉米轮作体系土壤物理特性的影响[J]. 中国农业科学, 2023, 56(7): 1344-1358. |
| [9] | 李懿璞, 童丽秀, 蔺雅楠, 苏治军, 包海柱, 王富贵, 刘剑, 屈佳伟, 胡树平, 孙继颖, 王志刚, 于晓芳, 徐明良, 高聚林. 玉米ZmCCT10耐低氮功能研究[J]. 中国农业科学, 2023, 56(6): 1035-1044. |
| [10] | 渠清, 刘宁, 邹金鹏, 张雅璇, 贾慧, 孙蔓莉, 曹志艳, 董金皋. 拟轮枝镰孢与玉米籽粒互作的差异基因筛选及代谢通路分析[J]. 中国农业科学, 2023, 56(6): 1086-1101. |
| [11] | 崔红杰, 卢春亭, 潘丽琴, 胡会, 钟佩云, 朱洁莹, 张凯照, 黄小红. 姜黄素通过SIRT1/FOXO1通路缓解玉米赤霉烯酮诱导的猪肾上皮细胞氧化损伤[J]. 中国农业科学, 2023, 56(5): 1007-1018. |
| [12] | 周文期, 张贺通, 何海军, 龚佃明, 杨彦忠, 刘忠祥, 李永生, 王晓娟, 连晓荣, 周玉乾, 邱法展. 调控玉米株高和穗位高候选基因Zmdle1的定位[J]. 中国农业科学, 2023, 56(5): 821-837. |
| [13] | 马南, 安婷婷, 张久明, 汪景宽. 添加玉米秸秆和根茬对不同肥力黑土微生物残体碳氮的影响[J]. 中国农业科学, 2023, 56(4): 686-696. |
| [14] | 刘丹, 安雨丽, 陶笑笑, 王孝忠, 吕典秋, 郭彦军, 陈新平, 张务帅. 西北地区制种玉米产量及氮素吸收对供氮水平的响应[J]. 中国农业科学, 2023, 56(3): 441-452. |
| [15] | 李燕, 陶柯宇, 胡悦, 李永祥, 张登峰, 李春辉, 何冠华, 宋燕春, 石云素, 黎裕, 王天宇, 邹华文, 刘旭洋. 玉米ZCN7在调控花期抗旱性中的作用[J]. 中国农业科学, 2023, 56(16): 3051-3061. |
|
||