


中国农业科学 ›› 2023, Vol. 56 ›› Issue (16): 3140-3155.doi: 10.3864/j.issn.0578-1752.2023.16.008
刘淑军1,2( ), 李冬初1,2, 黄晶1,2, 曲潇林3, 马常宝3, 王慧颖3, 于子坤3, 张璐1,2, 韩天富1, 柳开楼4, 申哲1, 张会民1,2()
收稿日期:2022-09-07
接受日期:2022-11-03
出版日期:2023-08-16
发布日期:2023-08-18
通信作者:
联系方式:
刘淑军,E-mail:liushujun@caas.cn。
基金资助:
LIU ShuJun1,2(), LI DongChu1,2, HUANG Jing1,2, QU XiaoLin3, MA ChangBao3, WANG HuiYing3, YU ZiKun3, ZHANG Lu1,2, HAN TianFu1, LIU KaiLou4, SHEN Zhe1, ZHANG HuiMin1,2()
Received:2022-09-07
Accepted:2022-11-03
Published:2023-08-16
Online:2023-08-18
摘要:
【目的】我国拥有丰富的小麦和玉米秸秆资源,明晰我国小麦、玉米秸秆产量和养分资源量及还田减肥潜力的时空变化特征,可为推进秸秆资源利用和化肥减施提供决策依据。【方法】以农业农村部1988-2019年在全国小麦玉米区的土壤长期监测数据为基础,分析我国各地区不同年份的小麦玉米秸秆和养分资源量及还田减肥潜力。【结果】2010s全国小麦和玉米秸秆年均量分别达到1.62×10⁸和4.23×10⁸ t,比1990s增加0.16×10⁸和2.04×10⁸ t;秸秆NPK总养分资源年均量分别达到278.19×10⁴和901.08×10⁴ t,比1990s增加27.97×10⁴和434.82×10⁴ t,均以华北增量最高。30年来全国小麦秸秆及养分资源呈先降后增的趋势,玉米呈增长趋势。第一阶段(1990s—2000s)和第二阶段(2000s—2010s)小麦秸秆资源年变化速率分别为-42.47×10⁴和205.10×10⁴ t·a-1,N、P和K的养分资源年变化速率分别为-0.26×10⁴、-0.03×10⁴、-0.44×10⁴ t·a-1和1.27×10⁴、0.14×10⁴、2.11×10⁴ t·a-1;第一阶段和第二阶段玉米秸秆资源年变化速率分别为397.82×10⁴和1643.60×104 t·a-1,N、P和K的养分资源年变化速率分别为3.46×10⁴、0.56×10⁴、4.46×10⁴ t·a-1和14.30×10⁴、2.30×10⁴、18.41×10⁴ t·a-1。80%以上的小麦秸秆及其养分资源分布在华北和长江中下游,以华北最高(0.93×10⁸ t,NPK 160.31×10⁴ t),西南最低(0.09×10⁸ t,NPK 16.05×10⁴ t);70%左右的玉米秸秆及其养分资源分布在东北和华北,以东北最高(1.39×10⁸ t,NPK 296.96×10⁴ t),长江中下游最低(0.21×10⁸ t,NPK 44.40×10⁴ t)。全国小麦秸秆还田的N、P和K养分单位面积年均当季释放量分别为21.1、3.0和62.3 kg·hm-2,以华北最高,西南最低;玉米秸秆还田的N、P和K养分单位面积年均当季释放量分别为48.6、10.6和97.7 kg·hm-2,以西北最高,西南最低。近30年来,全国单位面积小麦和玉米秸秆还田的养分年均当季释放量持续稳定增加,小麦秸秆还田的N、P、K养分相当于化肥年均施用量的比例分别为9.13%—10.82%、4.26%—6.43%、88.02%—111.86%,玉米秸秆分别为22.99%—24.37%、16.04%—28.67%、150.29%—181.42%。【结论】我国小麦和玉米秸秆还田可满足作物生长的钾素需求,可减少约10%—20%氮肥、5%—20%磷肥的施用,充分利用秸秆资源,是实现化肥减施增效的重要保障。
刘淑军, 李冬初, 黄晶, 曲潇林, 马常宝, 王慧颖, 于子坤, 张璐, 韩天富, 柳开楼, 申哲, 张会民. 近30年来我国小麦和玉米秸秆资源时空变化特征及还田减肥潜力[J]. 中国农业科学, 2023, 56(16): 3140-3155.
LIU ShuJun, LI DongChu, HUANG Jing, QU XiaoLin, MA ChangBao, WANG HuiYing, YU ZiKun, ZHANG Lu, HAN TianFu, LIU KaiLou, SHEN Zhe, ZHANG HuiMin. Spatial-Temporal Variation Characteristics of Wheat and Maize Stalk Resources and Chemical Fertilizer Reduction Potential of Returning to Farmland in Recent 30 Years in China[J]. Scientia Agricultura Sinica, 2023, 56(16): 3140-3155.
表1
本研究区域划分"
| 小麦 Wheat | 玉米 Maize | ||||
|---|---|---|---|---|---|
| 区域 Region | 监测点个数 Number of monitoring points | 省、市、自治区 Provinces, cities and autonomous regions | 区域 Region | 监测点个数 Number of monitoring points | 省、市、自治区 Provinces, cities and autonomous regions |
| 长江中下游 MLRYR | 120 | 安徽、湖北、江苏、上海 Anhui, Hubei, Jiangsu, Shanghai | 长江中下游 MLRYR | 45 | 安徽、湖北、江苏、湖南 Anhui, Hubei, Jiangsu, Hunan |
| 西南 SW | 30 | 贵州、四川、重庆、云南 Guizhou, Sichuan, Chongqing, Yunnan | 西南 SW | 56 | 贵州、四川、重庆、云南 Guizhou, Sichuan, Chongqing, Yunnan |
| 西北 NW | 67 | 甘肃、宁夏、新疆、青海 Gansu, Ningxia, Xinjiang, Qinghai | 西北 NW | 100 | 甘肃、宁夏、新疆、内蒙古 Gansu Ningxia, Xinjiang, Inner Mengulia |
| 华北 NC | 215 | 北京、河北、河南、山东、山西、天津 Beijing, Hebei, Henan, Shandong, Shanxi, Tianjin | 华北 NC | 260 | 北京、河北、河南、山东、山西、天津 Beijing, Hebei, Henan, Shandong, Shanxi, Tianjin |
| 东北 NE | 204 | 黑龙江、吉林、辽宁 Heilongjiang, Jilin, Liaoning | |||
表2
各区域小麦和玉米的单产、播种面积以及施肥量"
| 区域 Region | 年代 Years | 小麦单产 Wheat yield per unit (kg·hm-2) | 小麦播种面积 Wheat cultivation area (×107 hm2) | 小麦施肥量 Fertilizer application rate of wheat (kg·hm-2) | 玉米单产 Maize yield per unit (kg·hm-2) | 玉米播种面积 Maize cultivation area (×107 hm2) | 玉米施肥量 Fertilizer application rate of maize (kg·hm-2) | ||||
|---|---|---|---|---|---|---|---|---|---|---|---|
| N | P | K | N | P | K | ||||||
| 长江中 下游 MLRYR | 1990s | 5097.2 | 0.56 | 193.93 | 35.47 | 45.19 | 5846.5 | 0.16 | 284.20 | 88.08 | 89.79 |
| 2000s | 5863.0 | 0.51 | 184.00 | 38.96 | 53.74 | 6506.1 | 0.18 | 238.00 | 28.48 | 55.55 | |
| 2010s | 6524.6 | 0.63 | 228.44 | 33.82 | 62.39 | 9029.9 | 0.27 | 249.27 | 32.48 | 71.13 | |
| 西南 SW | 1990s | 4063.3 | 0.38 | 184.21 | 45.25 | 65.86 | 5455.4 | 0.38 | 162.05 | 28.43 | 41.76 |
| 2000s | 3491.0 | 0.23 | 140.02 | 39.92 | 64.54 | 7318.2 | 0.37 | 177.66 | 34.57 | 53.51 | |
| 2010s | 4179.1 | 0.14 | 120.83 | 21.87 | 35.06 | 7593.9 | 0.48 | 223.88 | 31.94 | 62.86 | |
| 西北 NW | 1990s | 6687.5 | 0.28 | 181.31 | 72.58 | 68.13 | 8087.9 | 0.26 | 169.89 | 67.67 | 30.63 |
| 2000s | 7006.8 | 0.22 | 215.19 | 79.69 | 37.60 | 14329.0 | 0.31 | 230.36 | 88.23 | 41.20 | |
| 2010s | 7174.1 | 0.21 | 212.55 | 61.13 | 39.41 | 13073.8 | 0.60 | 259.04 | 58.71 | 47.21 | |
| 华北 NC | 1990s | 6075.8 | 1.28 | 189.83 | 66.61 | 67.66 | 8335.4 | 0.83 | 142.17 | 74.36 | 70.86 |
| 2000s | 7165.9 | 1.18 | 187.51 | 55.92 | 59.61 | 9009.4 | 0.97 | 188.10 | 40.28 | 51.60 | |
| 2010s | 7794.9 | 1.27 | 228.77 | 56.87 | 59.68 | 10391.0 | 1.32 | 219.92 | 35.30 | 52.93 | |
| 东北 NE | 1990s | - | - | - | - | - | 13666.0 | 0.64 | 159.58 | 39.28 | 31.11 |
| 2000s | - | - | - | - | - | 11780.5 | 0.77 | 149.17 | 38.93 | 46.99 | |
| 2010s | - | - | - | - | 12295.3 | 1.29 | 196.08 | 39.35 | 68.44 | ||
| 全国 CH | 1990s | 5536.7 | 2.50 | 188.38 | 56.48 | 57.70 | 8276.5 | 2.27 | 163.77 | 52.74 | 52.08 |
| 2000s | 6439.4 | 2.15 | 184.83 | 52.83 | 57.28 | 9682.2 | 2.60 | 186.77 | 43.68 | 50.47 | |
| 2010s | 7195.0 | 2.25 | 222.66 | 48.56 | 59.00 | 10808.8 | 3.97 | 220.99 | 38.55 | 59.44 | |
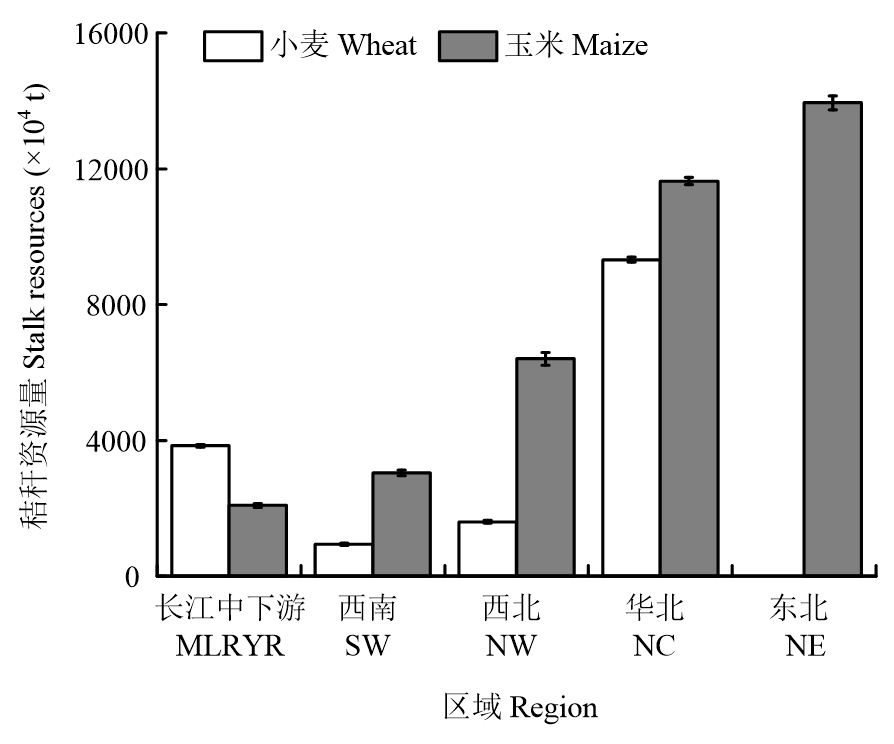
图1
不同区域小麦和玉米秸秆资源量"
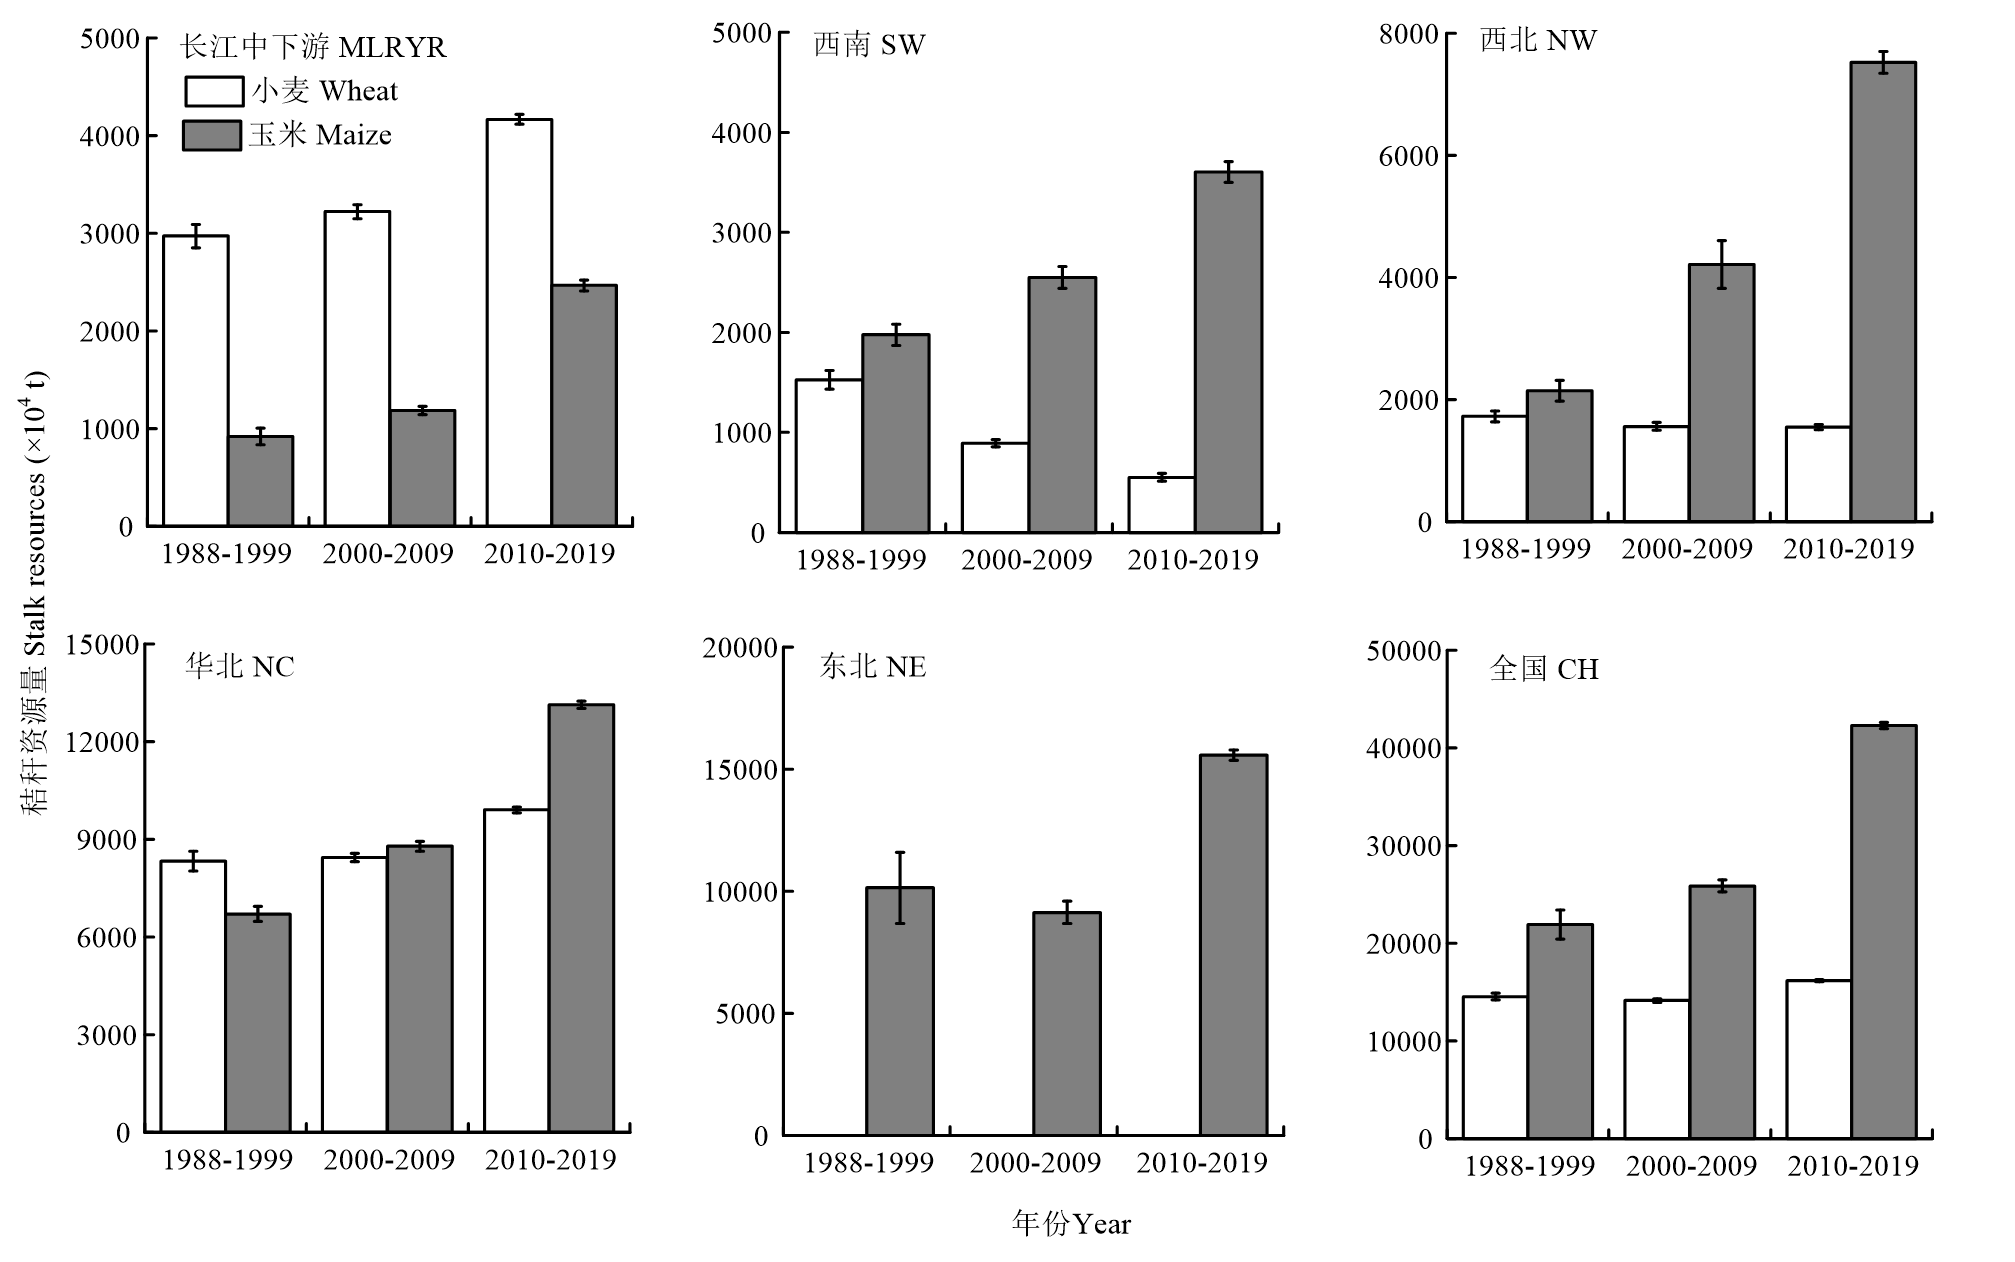
图2
不同区域小麦和玉米秸秆资源量时序变化"
表3
各区域小麦和玉米秸秆资源量的年变化速率"
| 区域 Region | 小麦 Wheat | 玉米 Maize | ||
|---|---|---|---|---|
| 1990s—2000s的年变化速率 Annual variation rate in 1990s-2000s(×104 t·a-1) | 2000s—2010s的年变化速率 Annual variation rate in 2000s-2010s(×104 t·a-1) | 1990s—2000s的年变化速率 Annual variation rate in 1990s-2000s(×104 t·a-1) | 2000s—2010s的年变化速率 Annual variation rate in 2000s-2010s(×104 t·a-1) | |
| 长江中下游 MLRYR | 24.95 | 94.56 | 26.78 | 128.10 |
| 西南 SW | -63.22 | -34.19 | 57.41 | 105.46 |
| 西北 NW | -16.29 | -1.02 | 206.72 | 331.41 |
| 华北 NC | 12.09 | 145.75 | 207.91 | 434.66 |
| 东北 NE | - | - | -101.00 | 643.97 |
| 全国 CH | -42.47 | 205.10 | 397.82 | 1643.60 |
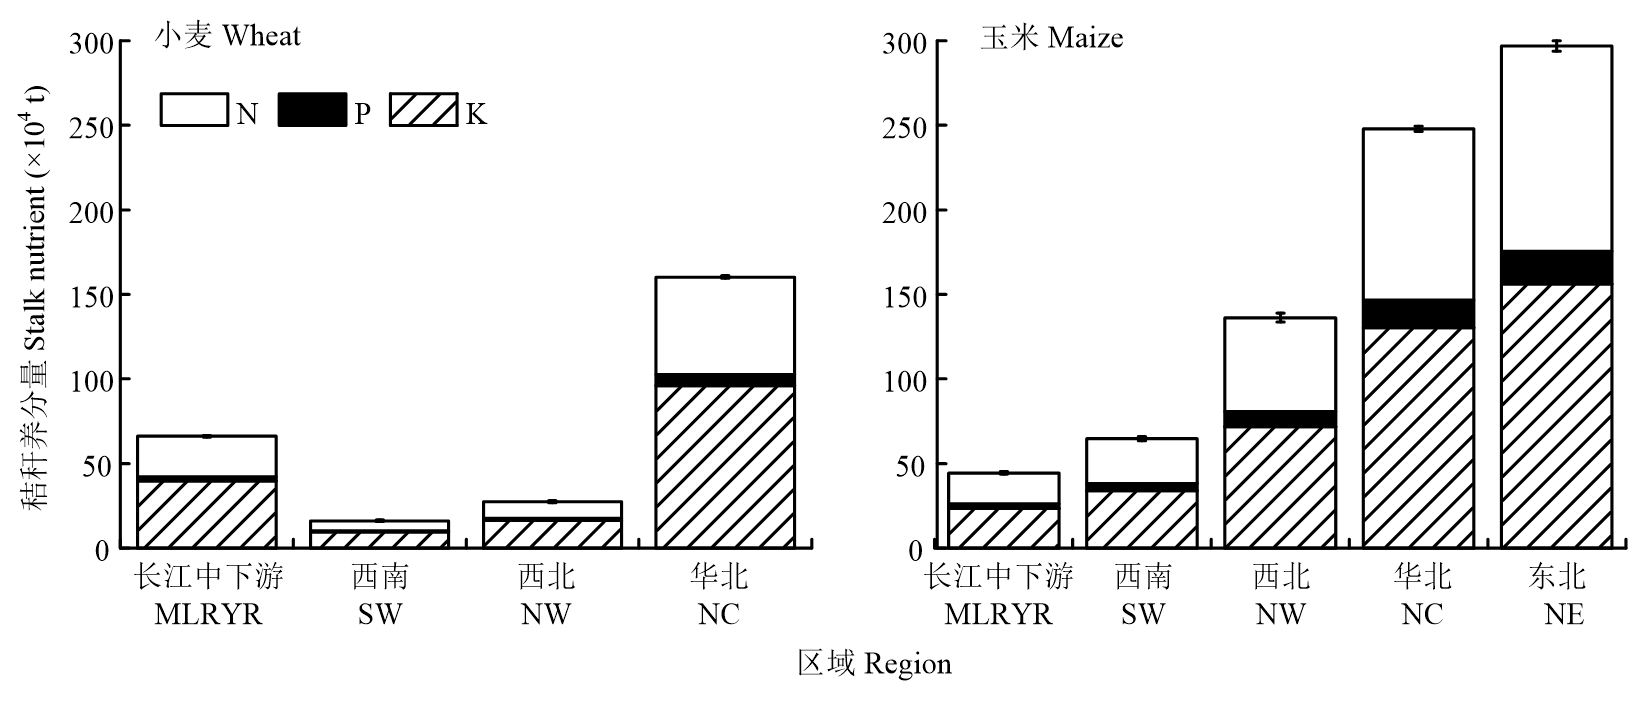
图3
不同区域小麦和玉米秸秆养分量"
表4
不同区域小麦和玉米秸秆养分资源年均量时序变化"
| 区域 Region | 年代 Years | 小麦秸秆养分量 Nutrients in wheat stalk (×104 t) | 玉米秸秆养分量 Nutrients in maize stalk (×104 t) | ||||||
|---|---|---|---|---|---|---|---|---|---|
| N | P | K | 合计Total | N | P | K | 合计Total | ||
| 长江中下游 MLRYR | 1990s | 18.42±0.74 | 2.08±0.09 | 30.61±1.23 | 51.11±1.44 | 7.99±0.74 | 1.29±0.12 | 10.28±0.95 | 19.55±1.21 |
| 2000s | 19.97±0.45 | 2.25±0.06 | 33.18±0.75 | 55.40±0.88 | 10.32±0.37 | 1.66±0.06 | 13.28±0.47 | 25.26±0.60 | |
| 2010s | 25.83±0.31 | 2.92±0.04 | 42.92±0.52 | 71.67±0.61 | 21.46±0.49 | 3.45±0.08 | 27.63±0.63 | 52.54±0.80 | |
| 西南 SW | 1990s | 9.47±0.57 | 1.07±0.06 | 15.73±0.95 | 26.26±1.11 | 17.19±0.91 | 2.77±0.15 | 22.13±1.17 | 42.09±1.49 |
| 2000s | 5.55±0.23 | 0.63±0.03 | 9.21±0.39 | 15.39±0.45 | 22.19±0.95 | 3.57±0.15 | 28.56±1.22 | 54.32±1.55 | |
| 2010s | 3.43±0.24 | 0.39±0.03 | 5.69±0.41 | 9.50±0.48 | 31.36±0.91 | 5.05±0.15 | 40.38±1.17 | 76.79±1.49 | |
| 西北 NW | 1990s | 10.69±0.56 | 1.21±0.06 | 17.75±0.93 | 29.64±1.09 | 18.66±1.49 | 3.00±0.24 | 24.02±1.92 | 45.69±2.45 |
| 2000s | 9.68±0.39 | 1.09±0.04 | 16.07±0.65 | 26.84±0.77 | 36.65±3.38 | 5.90±0.54 | 47.18±4.36 | 89.72±5.54 | |
| 2010s | 9.61±0.25 | 1.09±0.03 | 15.97±0.42 | 26.67±0.49 | 65.48±1.54 | 10.54±0.25 | 84.29±1.99 | 160.31±2.53 | |
| 华北 NC | 1990s | 51.62±1.90 | 5.83±0.21 | 85.75±3.16 | 143.20±3.69 | 58.36±2.05 | 9.39±0.33 | 75.13±2.63 | 142.88±3.35 |
| 2000s | 52.37±0.81 | 5.91±0.09 | 87.00±1.34 | 145.28±1.57 | 76.45±1.33 | 12.30±0.21 | 98.41±1.71 | 187.16±2.17 | |
| 2010s | 61.40±0.54 | 6.93±0.06 | 102.01±0.90 | 170.35±1.06 | 114.26±0.98 | 18.39±0.16 | 147.10±1.26 | 279.74±1.60 | |
| 东北 NE | 1990s | - | - | - | - | 88.24±12.66 | 14.20±2.04 | 113.60±16.30 | 216.05±20.74 |
| 2000s | - | - | - | - | 79.46±3.94 | 12.79±0.63 | 102.29±5.07 | 194.54±6.45 | |
| 2010s | - | - | - | - | 135.48±1.85 | 21.80±0.30 | 174.42±2.38 | 331.70±3.02 | |
| 全国 CH | 1990s | 90.19±2.19 | 10.18±0.25 | 149.84±3.64 | 250.22±4.25 | 190.44±12.97 | 30.65±2.09 | 245.17±16.69 | 466.26±21.24 |
| 2000s | 87.56±1.03 | 9.89±0.12 | 145.46±1.72 | 242.91±2.01 | 225.05±5.45 | 36.22±0.88 | 289.72±7.02 | 550.99±8.93 | |
| 2010s | 100.28±0.72 | 11.32±0.08 | 166.59±1.20 | 278.19±1.40 | 368.05±2.79 | 59.23±0.45 | 473.81±3.60 | 901.08±4.58 | |
表5
各区域小麦和玉米秸秆N、P、K养分总量的年变化速率"
| 养分 Nutrient | 区域 Region | 小麦 Wheat | 玉米 Maize | ||
|---|---|---|---|---|---|
| 1990s—2000s的年变化速率 Annual variation rate in 1990s-2000s(×104 t·a-1) | 2000s—2010s的年变化速率 Annual variation rate in 2000s-2010s(×104 t·a-1) | 1990s—2000s的年变化速率 Annual variation rate in 1990s-2000s(×104 t·a-1) | 2000s—2010s的年变化速率 Annual variation rate in 2000s-2010s(×104 t·a-1) | ||
| N | 长江中下游 MLRYR | 0.15 | 0.59 | 0.23 | 1.11 |
| 西南 SW | -0.39 | -0.21 | 0.50 | 0.92 | |
| 西北 NW | -0.10 | -0.01 | 1.80 | 2.88 | |
| 华北 NC | 0.07 | 0.90 | 1.81 | 3.78 | |
| 东北 NE | - | - | -0.88 | 5.60 | |
| 全国 CH | -0.26 | 1.27 | 3.46 | 14.30 | |
| P | 长江中下游 MLRYR | 0.02 | 0.07 | 0.04 | 0.18 |
| 西南 SW | -0.04 | -0.02 | 0.08 | 0.15 | |
| 西北 NW | -0.01 | -0.0007 | 0.29 | 0.46 | |
| 华北 NC | 0.01 | 0.10 | 0.29 | 0.61 | |
| 东北 NE | - | - | -0.14 | 0.90 | |
| 全国 CH | -0.03 | 0.14 | 0.56 | 2.30 | |
| K | 长江中下游 MLRYR | 0.26 | 0.97 | 0.30 | 1.43 |
| 西南 SW | -0.65 | -0.35 | 0.64 | 1.18 | |
| 西北 NW | -0.17 | -0.01 | 2.32 | 3.71 | |
| 华北 NC | 0.12 | 1.50 | 2.33 | 4.87 | |
| 东北 NE | - | - | -1.13 | 7.21 | |
| 全国 CH | -0.44 | 2.11 | 4.46 | 18.41 | |
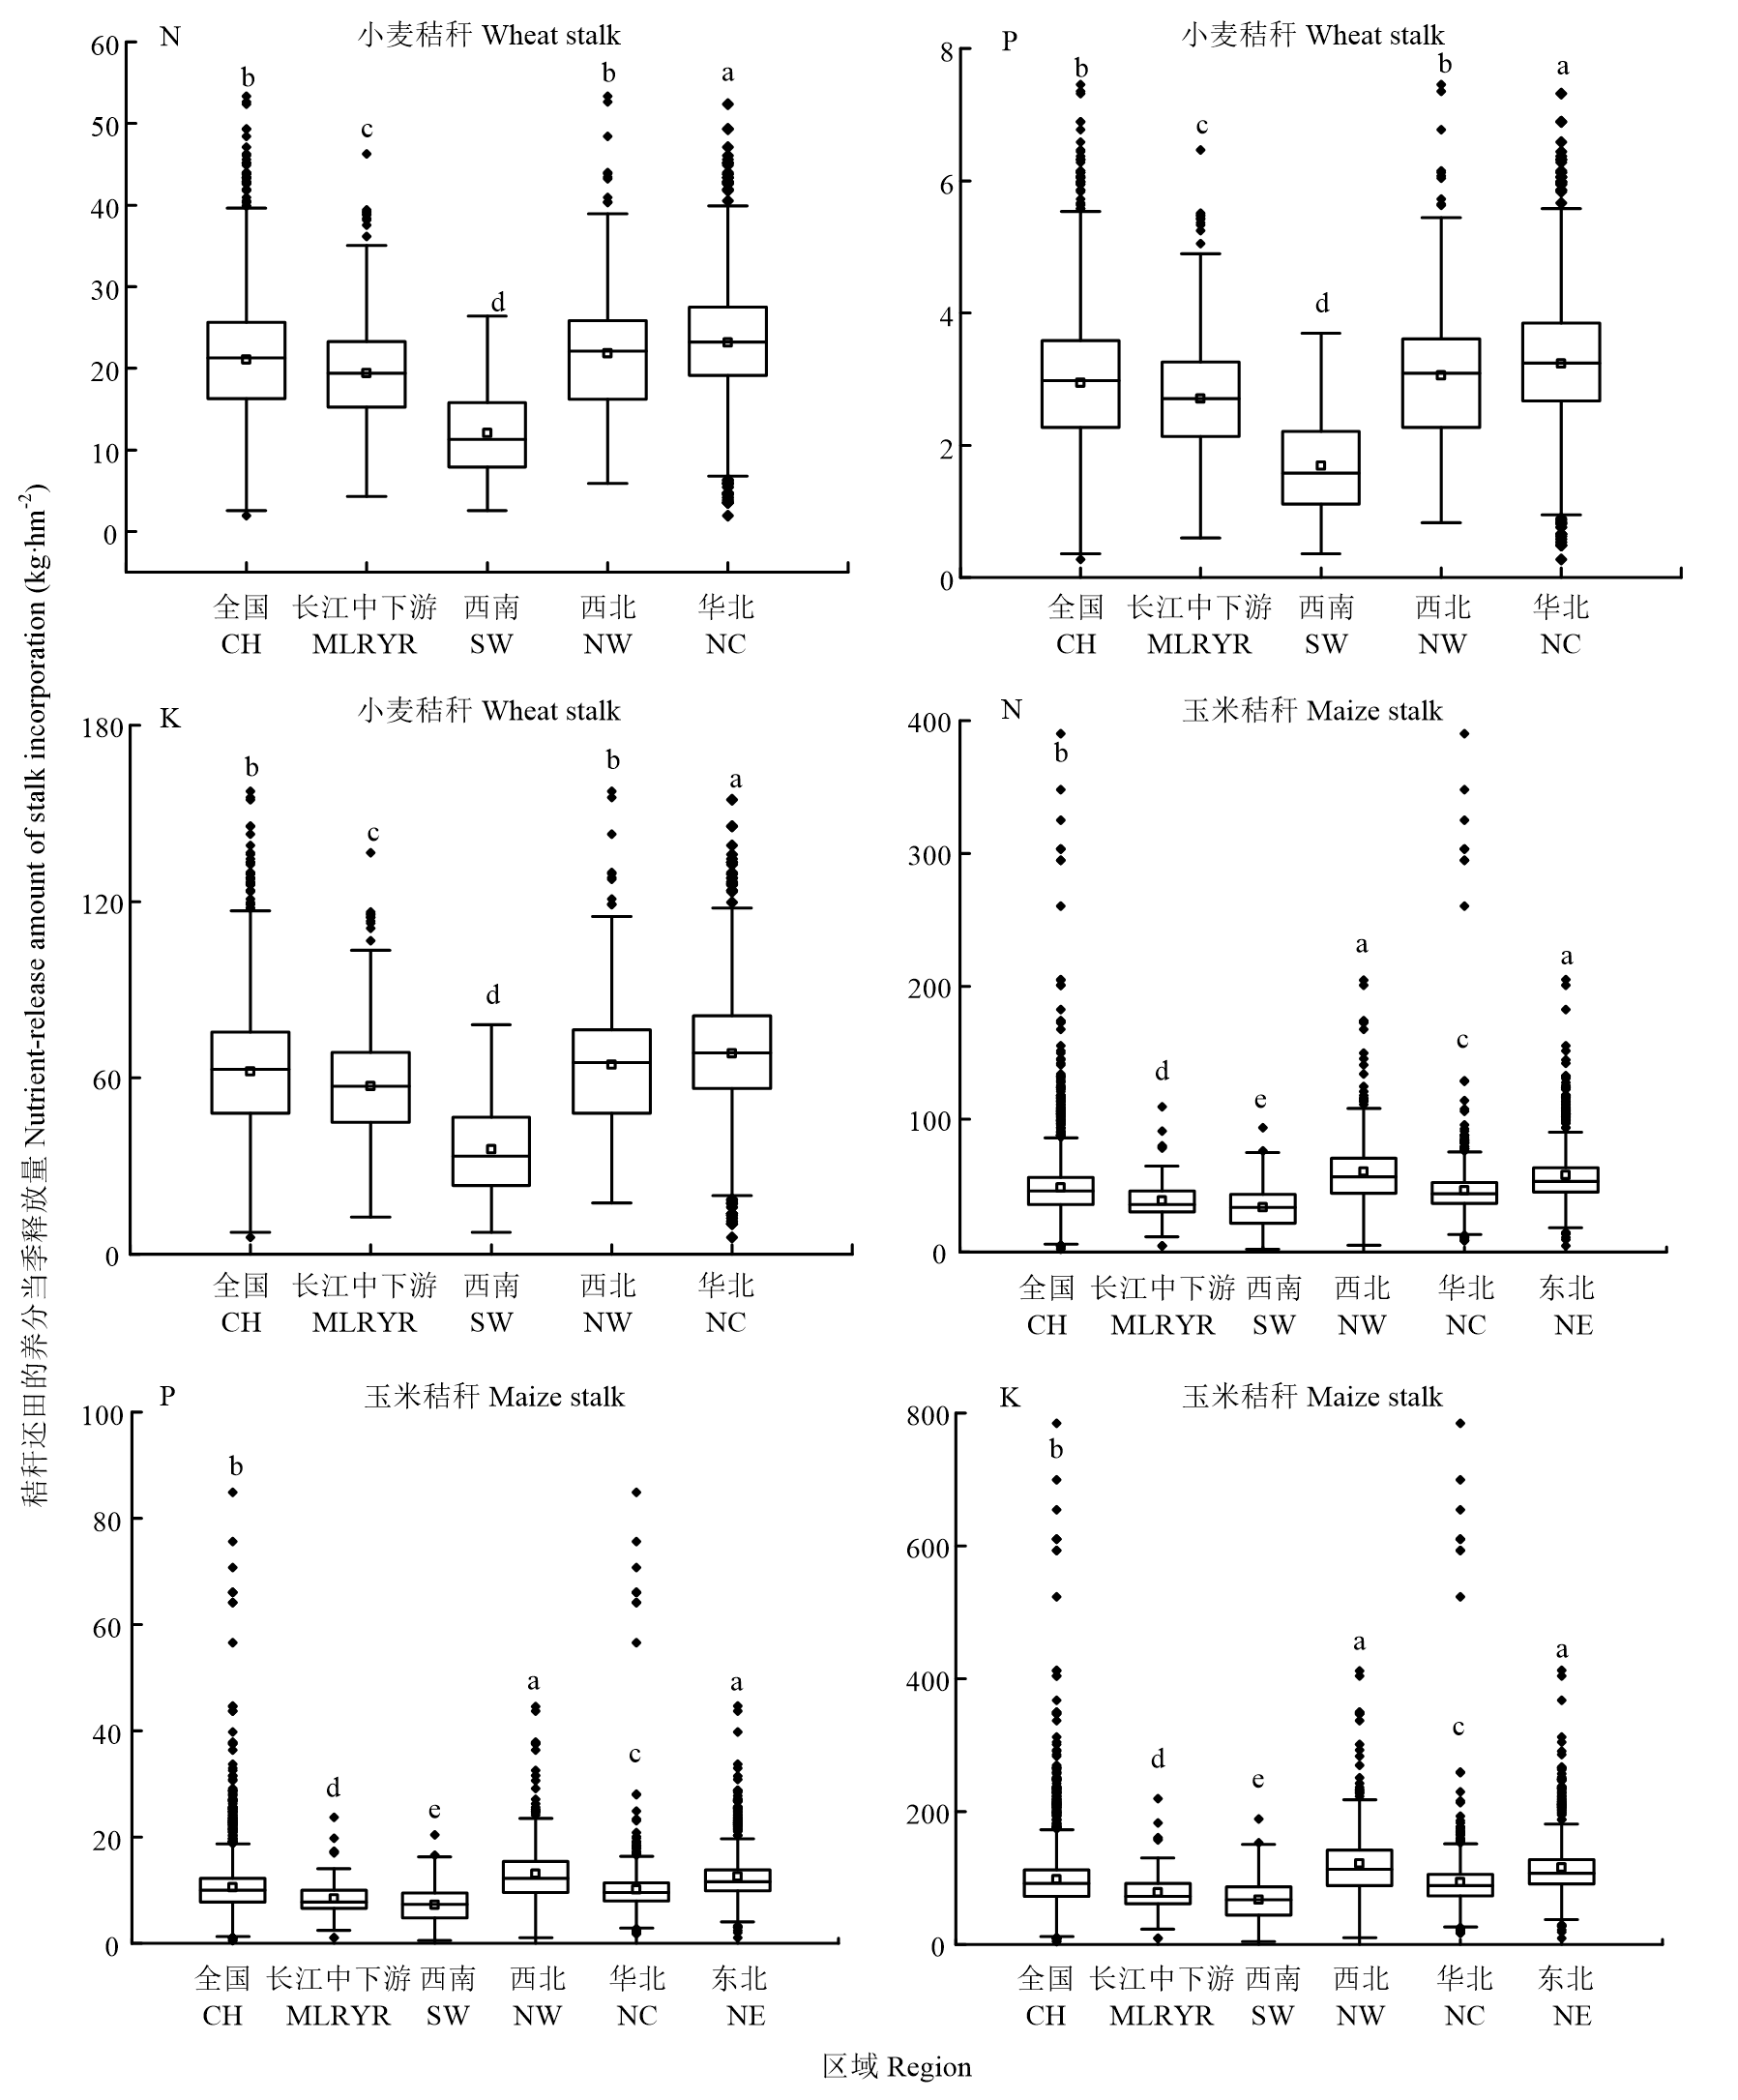
图4
不同区域小麦和玉米秸秆还田的养分当季释放量 图中不同的小写字母表示差异显著(P<0.05)。方框中的实线代表中位数,□代表平均值。·代表异常值。方框上下两条线分别代表75%和25%的置信区间。方框外上下两条短线分别代表95%和5%的置信区间"
表6
不同区域小麦和玉米秸秆还田的养分当季释放量时序变化"
| 区域 Region | 年代 Years | 小麦秸秆还田的养分当季释放量 Nutrient-release amount of wheat stalk incorporation (kg·hm-2) | 养分当季释放量占化肥施用量的比例 Ratio of nutrient-release amount to fertilizer application (%) | 玉米秸秆还田的养分当季释放量 Nutrient-release amount of maize stalk incorporation (kg·hm-2) | 养分当季释放量占化肥施用量的比例 Ratio of nutrient-release amount to fertilizer application (%) | ||||||||
|---|---|---|---|---|---|---|---|---|---|---|---|---|---|
| N | P | K | N | P | K | N | P | K | N | P | K | ||
| 长江中下游 MLRYR | 1990s | 15.84±0.51c | 2.21±0.07c | 46.75±1.50c | 8.17 | 6.24 | 103.45 | 27.49±1.59b | 5.98±0.35b | 55.29±3.21b | 9.67 | 6.79 | 61.57 |
| 2000s | 18.22±0.39b | 2.54±0.05b | 53.78±1.15b | 9.90 | 6.53 | 100.06 | 30.59±0.97b | 6.65±0.21b | 61.52±1.96b | 12.85 | 23.35 | 110.75 | |
| 2010s | 20.27±0.23a | 2.83±0.03a | 59.84±0.68a | 8.87 | 8.37 | 95.92 | 42.45±0.94a | 9.23±0.20a | 85.39±1.89a | 17.03 | 28.43 | 120.05 | |
| 西南 SW | 1990s | 12.62±0.50a | 1.76±0.07a | 37.27±1.48 | 6.85 | 3.90 | 56.59 | 25.65±1.53b | 5.58±0.33b | 51.59±3.09b | 15.83 | 19.62 | 123.55 |
| 2000s | 10.85±0.52b | 1.52±0.07b | 32.02±1.54b | 7.75 | 3.80 | 49.61 | 34.41±1.54a | 7.48±0.33a | 69.20±3.09a | 19.37 | 21.64 | 129.32 | |
| 2010s | 12.98±0.64a | 1.81±0.09a | 38.33±1.89a | 10.75 | 8.30 | 109.34 | 35.70±0.96a | 7.76±0.21a | 71.81±1.93a | 15.95 | 24.31 | 114.23 | |
| 西北 NW | 1990s | 20.78±1.24a | 2.90±0.17a | 61.34±3.67a | 11.46 | 4.00 | 90.04 | 38.03±2.30b | 8.27±0.50b | 76.48±4.62b | 22.38 | 12.22 | 249.71 |
| 2000s | 21.77±0.88a | 3.04±0.12a | 64.27±2.61a | 10.12 | 3.82 | 170.93 | 67.37±4.86a | 14.65±1.06a | 135.50±9.77a | 29.25 | 16.61 | 328.85 | |
| 2010s | 22.29±0.61a | 3.11±0.09a | 65.80±1.81a | 10.49 | 5.09 | 166.97 | 61.47±1.30a | 13.37±0.28a | 123.63±2.61a | 23.73 | 22.77 | 261.84 | |
| 华北 NC | 1990s | 18.88±0.65c | 2.64±0.09c | 55.73±1.92c | 9.94 | 3.96 | 82.36 | 39.19±1.61b | 8.52±0.35b | 78.82±3.24b | 27.57 | 11.46 | 111.23 |
| 2000s | 22.26±0.34b | 3.11±0.05b | 65.73±1.01b | 11.87 | 5.56 | 110.27 | 42.36±0.72b | 9.21±0.16b | 85.19±1.45b | 22.52 | 22.87 | 165.09 | |
| 2010s | 24.22±0.19a | 3.38±0.03a | 71.50±0.56a | 10.59 | 5.95 | 119.81 | 48.85±0.85a | 10.62±0.19a | 98.26±1.72a | 22.21 | 30.09 | 185.65 | |
| 东北 NE | 1990s | - | - | - | - | - | - | 64.25±5.89a | 13.97±1.28a | 129.23±11.84a | 40.26 | 35.57 | 415.43 |
| 2000s | - | - | - | - | - | - | 55.39±2.06b | 12.04±0.45b | 111.40±4.14b | 37.13 | 30.94 | 237.06 | |
| 2010s | - | - | - | - | - | - | 57.81±0.83ab | 12.57±0.18ab | 116.27± 1.67ab | 29.48 | 31.95 | 169.89 | |
| 全国 CH | 1990s | 17.20±0.40c | 2.40±0.06c | 50.78±1.19c | 9.13 | 4.26 | 88.02 | 38.91±1.45c | 8.46±0.32c | 78.26±2.92c | 23.76 | 16.04 | 150.29 |
| 2000s | 20.01±0.26b | 2.80±0.04b | 59.06±0.77b | 10.82 | 5.29 | 103.11 | 45.52±0.85b | 9.90±0.18b | 91.56±1.70b | 24.37 | 22.66 | 181.42 | |
| 2010s | 22.35±0.15a | 3.12±0.02a | 65.99±0.45a | 10.04 | 6.43 | 111.86 | 50.82±0.50a | 11.05±0.11a | 102.21±1.01a | 22.99 | 28.67 | 171.95 | |
| [1] |
石祖梁, 杨四军, 常志州, 张斯梅. 秸秆产生利用现状调查与禁烧面临难点分析: 以江苏省某乡镇为例. 农业资源与环境学报, 2014, 31(2): 103-109.
|
|
|
|
| [2] |
薛颖昊, 冯浩杰, 孙仁华, 胡潇方, 李晓阳, 徐志宇. 农作物秸秆肥料化利用研究文献计量分析. 中国农业资源与区划, 2023, 44(1): 108-118.
|
|
|
|
| [3] |
郝小雨, 陈苗苗. 农作物秸秆肥料化利用现状与发展建议: 以黑龙江省为例. 河北农业大学学报(社会科学版), 2021, 23(6): 108-114.
|
|
|
|
| [4] |
劳秀荣, 孙伟红, 王真, 郝艳如, 张昌爱. 秸秆还田与化肥配合施用对土壤肥力的影响. 土壤学报, 2003, 40(4): 618-623.
|
|
|
|
| [5] |
闫翠萍, 裴雪霞, 王姣爱, 杨峰, 曹勇, 张晶, 党建友. 秸秆还田与施氮对冬小麦生长发育及水肥利用率的影响. 中国生态农业学报, 2011, 19(2): 271-275.
|
|
doi: 10.3724/SP.J.1011.2011.00271 |
|
| [6] |
余坤, 李国建, 李百凤, 褚晓升, 冯浩. 不同秸秆还田方式对土壤质量改良效应的综合评价. 干旱地区农业研究, 2020, 38(3): 213-221.
|
|
|
|
| [7] |
杨帆, 董燕, 徐明岗, 包耀贤. 南方地区秸秆还田对土壤综合肥力和作物产量的影响. 应用生态学报, 2012, 23(11): 3040-3044.
|
|
|
|
| [8] |
doi: 10.1016/j.rser.2017.06.076 |
| [9] |
霍丽丽, 赵立欣, 孟海波, 姚宗路. 中国农作物秸秆综合利用潜力研究. 农业工程学报, 2019, 35(13): 218-224.
|
|
|
|
| [10] |
王金武, 唐汉, 王金峰. 东北地区作物秸秆资源综合利用现状与发展分析. 农业机械学报, 2017, 48(5): 1-21.
|
|
|
|
| [11] |
刘晓永, 李书田. 中国秸秆养分资源及还田的时空分布特征. 农业工程学报, 2017, 33(21): 1-19.
|
|
|
|
| [12] |
李飞跃, 汪建飞. 中国粮食作物秸秆焚烧排碳量及转化生物炭固碳量的估算. 农业工程学报, 2013, 29(14): 1-7.
|
|
|
|
| [13] |
doi: 10.1088/1748-9326/11/1/014014 |
| [14] |
doi: 10.1016/j.jclepro.2015.09.112 |
| [15] |
doi: 10.1016/j.rser.2011.12.012 |
| [16] |
doi: 10.1016/j.biortech.2003.12.001 |
| [17] |
doi: 10.1016/j.biombioe.2015.12.023 |
| [18] |
doi: 10.1016/j.agsy.2014.01.002 |
| [19] |
李晖, 戴明威, 戴顺利, 刘婧, 吴瑾, 施六林. 2010—2015年安徽省粮食作物秸秆的时空分布特征和资源评价. 安徽农业大学学报, 2018, 45(2): 282-287.
|
|
|
|
| [20] |
车莉. 农作物秸秆资源量估算、分布与利用潜力研究[D]. 大连: 大连理工大学, 2014.
|
|
|
|
| [21] |
谢光辉, 王晓玉, 任兰天. 中国作物秸秆资源评估研究现状. 生物工程学报, 2010, 26(7): 855-863.
|
|
|
|
| [22] |
霍丽丽, 赵立欣, 姚宗路, 贾吉秀, 赵亚男, 傅国浩, 丛宏斌. 中国玉米秸秆草谷比及其资源时空分布特征. 农业工程学报, 2020, 36(21): 227-234.
|
|
|
|
| [23] |
宋大利, 侯胜鹏, 王秀斌, 梁国庆, 周卫. 中国秸秆养分资源数量及替代化肥潜力. 植物营养与肥料学报, 2018, 24(1): 1-21.
|
|
|
|
| [24] |
柴如山, 徐悦, 程启鹏, 王擎运, 马超, 叶新新, 章力干, 郜红建. 安徽省主要作物秸秆养分资源量及还田利用潜力. 中国农业科学, 2021, 54(1): 95-109. doi: 10.3864/j.issn.0578-1752.2021.01.008.
doi: 10.3864/j.issn.0578-1752.2021.01.008 |
|
doi: 10.3864/j.issn.0578-1752.2021.01.008 |
|
| [25] |
中华人民共和国农业农村部. 中国农业年鉴. 北京: 中国农业出版社, 1989-2020.
|
|
Ministry of Agriculture and Rural Affairs of the People's Republic of China. China Agriculture Yearbook. Beijing: China Agriculture Press, 1989-2020. (in Chinese)
|
|
| [26] |
全国农业技术推广服务中心. 中国有机肥料资源. 北京: 中国农业出版社, 1999.
|
|
China National Agricultural Technology Extension Service. Data Collection for Organic Fertilizer Nutrients in China. Beijing: Chinese Agriculture Press, 1999. (in Chinese)
|
|
| [27] |
刘淑军, 李冬初, 黄晶, 马常宝, 王慧颖, 于子坤, 曲潇林, 张璐, 韩天富, 都江雪, 柳开楼, 张会民. 1988—2018年中国水稻秸秆资源时空分布特征及还田替代化肥潜力. 农业工程学报, 2021, 37(11): 151-161.
|
|
|
|
| [28] |
毕于运. 秸秆资源评价与利用研究[D]. 北京: 中国农业科学院, 2010.
|
|
|
|
| [29] |
徐志宇, 宋振伟, 邓艾兴, 陈武梅, 陈阜, 张卫建. 近30年我国主要粮食作物生产的驱动因素及空间格局变化研究. 南京农业大学学报, 2013, 36(1): 79-86.
|
|
|
|
| [30] |
贾正雷, 程家昌, 李艳梅, 刘玉. 1978—2014年中国玉米生产的时空特征变化研究. 中国农业资源与区划, 2018, 39(2): 50-57.
|
|
|
|
| [31] |
刘彦随, 王介勇, 郭丽英. 中国粮食生产与耕地变化的时空动态. 中国农业科学, 2009, 42(12): 4269-4274. doi: 10.3864/j.issn.0578-1752.2009.12.018.
doi: 10.3864/j.issn.0578-1752.2009.12.018 |
|
doi: 10.3864/j.issn.0578-1752.2009.12.018 |
|
| [32] |
范玲玲. 过去65年中国小麦种植时空格局变化及其驱动因素分析[D]. 北京: 中国农业科学院, 2018.
|
|
|
|
| [33] |
杨笛. 中国玉米产量增长的驱动因素分析[D]. 北京: 中国农业科学院, 2017.
|
|
|
|
| [34] |
赵鹏, 陈阜, 马新明, 熊淑萍. 麦玉两熟秸秆还田对作物产量和农田氮素平衡的影响. 干旱地区农业研究, 2010, 28(2): 162-166.
|
|
|
|
| [35] |
房静静, 丁维婷, 武雪萍, 李晓秀, 姜宇, 张继宗, 刘晓彤, 奚雅静, 郑凤君, 张孟妮, 米刚, 马献发. 长期秸秆配施化肥对土壤养分及小麦产量、品质的影响. 中国土壤与肥料, 2020(5): 141-146.
|
|
|
|
| [36] |
李红莉, 张卫峰, 张福锁, 杜芬, 李亮科. 中国主要粮食作物化肥施用量与效率变化分析. 植物营养与肥料学报, 2010, 16(5): 1136-1143.
|
|
|
|
| [37] |
柴如山, 安之冬, 马超, 王擎运, 章力干, 郜红建. 我国主要粮食作物秸秆钾养分资源量及还田替代钾肥潜力. 植物营养与肥料学报, 2020, 26(2): 201-211.
|
|
|
|
| [38] |
周延辉, 朱新开, 郭文善, 封超年. 中国地区小麦产量及产量要素对秸秆还田响应的整合分析. 核农学报, 2019, 33(1): 129-137.
doi: 10.11869/j.issn.100-8551.2019.01.0129 |
|
doi: 10.11869/j.issn.100-8551.2019.01.0129 |
|
| [39] |
王良, 刘元元, 钱欣, 张慧, 代红翠, 刘开昌, 高英波, 方志军, 刘树堂, 李宗新. 单季麦秸还田促进小麦-玉米周年碳效率和经济效益协同提高. 中国农业科学, 2022, 55(2): 350-364. doi: 10.3864/j.issn.0578-1752.2022.02.010.
doi: 10.3864/j.issn.0578-1752.2022.02.010 |
|
doi: 10.3864/j.issn.0578-1752.2022.02.010 |
|
| [40] |
凌宁, 荀卫兵, 沈其荣. 根际沉积碳与秸秆碳共存下作物与微生物氮素竞争机制及其调控. 南京农业大学学报, 2018, 41(4): 589-597.
|
|
|
|
| [41] |
胡雅杰, 朱大伟, 邢志鹏, 龚金龙, 张洪程, 戴其根, 霍中洋, 许轲, 魏海燕, 郭保卫. 改进施氮运筹对水稻产量和氮素吸收利用的影响. 植物营养与肥料学报, 2015, 21(1): 12-22.
|
|
|
|
| [42] |
李涛, 何春娥, 葛晓颖, 欧阳竹. 秸秆还田施氮调节碳氮比对土壤无机氮、酶活性及作物产量的影响. 中国生态农业学报, 2016, 24(12): 1633-1642.
|
|
|
|
| [43] |
doi: 10.1081/CSS-120024778 |
| [44] |
杨志谦, 王维敏. 秸秆还田后碳、氮在土壤中的积累与释放. 土壤肥料, 1991(5): 43-46.
|
|
|
|
| [45] |
王如芳, 张吉旺, 董树亭, 刘鹏. 我国玉米主产区秸秆资源利用现状及其效果. 应用生态学报, 2011, 22(6): 1504-1510.
|
|
|
|
| [46] |
马书芳, 朱德慧, 曹辉辉, 关瑞陈. 秸秆全量还田对农作物病虫害的影响及防控对策. 中国植保导刊, 2016, 36(7): 75-77.
|
|
|
|
| [47] |
乔玉强, 曹承富, 赵竹, 杜世州, 张耀兰, 刘永华, 张四华. 秸秆还田与施氮量对小麦产量和品质及赤霉病发生的影响. 麦类作物学报, 2013, 33(4): 727-731.
|
|
|
|
| [48] |
高晓梅, 刘晓辉, 于淼, 李杨, 敖静, 孙玉禄, 桓明辉, 池景良. 秸秆还田量对半干旱褐土区氮素淋溶及春玉米产量的影响. 山东农业科学, 2021, 53(10): 64-71.
|
|
|
|
| [49] |
冷明珠, 金月, 童喻浩, 侯建军, 裴惠民. 秸秆还田量对土壤肥力和小麦产量的影响. 浙江农业科学, 2022, 63(4): 679-681.
|
|
|
|
| [50] |
赵亚慧, 王宁, 于建光, 豆利岭, 刘满强, 焦加国. 不同还田量及还田方式下稻秸淋洗对小麦苗期生长发育的影响. 山东农业科学, 2020, 52(1): 53-58.
|
|
|
|
| [51] |
李天娇, 卓富彦, 陈冉冉, 李荣德, 史爱民. 秸秆还田对玉米病虫草害影响的研究进展. 中国植保导刊, 2022, 42(1): 23-29.
|
|
|
|
| [52] |
李波, 魏亚凤, 季桦, 汪波, 熊飞, 张琛, 刘建. 水稻秸秆还田与不同耕作方式下影响小麦出苗的因素. 扬州大学学报(农业与生命科学版), 2013, 34(2): 60-63.
|
|
|
|
| [53] |
杨竣皓, 骆永丽, 陈金, 金敏, 王振林, 李勇. 秸秆还田对我国主要粮食作物产量效应的整合(Meta)分析. 中国农业科学, 2020, 53(21): 4415-4429. doi: 10.3864/j.issn.0578-1752.2020.21.010.
doi: 10.3864/j.issn.0578-1752.2020.21.010 |
|
doi: 10.3864/j.issn.0578-1752.2020.21.010 |
|
| [54] |
盖霞普, 刘宏斌, 杨波, 王洪媛, 翟丽梅, 雷秋良, 武淑霞, 任天志. 不同施肥年限下作物产量及土壤碳氮库容对增施有机物料的响应. 中国农业科学, 2019, 52(4): 676-689. doi: 10.3864/j.issn.0578-1752.2019.04.009.
doi: 10.3864/j.issn.0578-1752.2019.04.009 |
|
doi: 10.3864/j.issn.0578-1752.2019.04.009 |
| [1] | 王亚菲, 闫鹏, 薛金涛, 董学瑞, 孟凡琦, 郭丽娜, 罗艺, 张娟, 董志强, 卢霖. 乙烯利-甜菜碱-水杨酸合剂对高温胁迫下玉米根系建构、生理功能和产量的影响[J]. 中国农业科学, 2026, 59(7): 1439-1455. |
| [2] | 朱琦, 贾振鹏, Tahir SHAH, 徐晨晟, 李芷琦, 吕会帅, 朱鹏超, 韦小敏, 黄冬琳, 孙艳妮, 曹卫东, 高亚军, 王朝辉, 张达斌. 绿肥配施增效产品降低旱地麦田温室气体排放及碳足迹[J]. 中国农业科学, 2026, 59(7): 1507-1522. |
| [3] | 叶美金, 吴雷, Lohani Md Nahibuzzaman, 尹丽, 胡欣荣, 刘亚西, 蒋云峰, 陈国跃, 蒲至恩, 李阳, 李婷, 邹亚亚, 吴佳怡, 马建. 基于GWAS的中国地方小麦成熟胚大小位点的鉴定及其遗传效应解析[J]. 中国农业科学, 2026, 59(6): 1157-1171. |
| [4] | 王佳诺, 陈桂平, 李盼, 王丽萍, 南运有, 何蔚, 樊志龙, 胡发龙, 柴强, 殷文, 赵连豪. 免耕地膜两年覆盖提高绿洲灌区玉米产量的灌浆期光合生理机制[J]. 中国农业科学, 2026, 59(6): 1189-1202. |
| [5] | 周新杰, 任昊, 陈应龙, 张吉旺, 赵斌, 任佰朝, 刘鹏, 王洪章. 过氧化钙对渍涝农田夏玉米根系形态及产量形成的影响[J]. 中国农业科学, 2026, 59(6): 1203-1216. |
| [6] | 何继航, 张擎, 吕相月, 薛吉全, 徐淑兔, 刘建超. 不同保绿型玉米杂交种氮效率评价[J]. 中国农业科学, 2026, 59(6): 1217-1230. |
| [7] | 李永娟, 张悦彤, 王艺博, 赵长江, 宋洁, 陈雪丽, 姚钦. 生物炭施用对大豆轮连作系统土壤固氮微生物nifH基因丰度及群落组成的影响[J]. 中国农业科学, 2026, 59(6): 1272-1285. |
| [8] | 李文虎, 礼海风, 杜宇鹏, 丁玉兰, 罗一诺, 李宇珂, 佘文婷, 张丰, 滕宇, 张思琦, 黄翠, 李小涵, 刘金山, 王朝辉. 小麦锌吸收转移对土施锌肥响应的区域差异[J]. 中国农业科学, 2026, 59(5): 1034-1047. |
| [9] | 焦文娟, 何万龙, 耿洪伟, 白斌, 李剑峰, 程宇坤. 155份春小麦品种(系)条锈病抗性评价与抗病基因分子检测[J]. 中国农业科学, 2026, 59(5): 937-950. |
| [10] | 李思源, 李鸿萍, 常洪庆, 张森焱, 栗思佳, 崔欣飞, 乔泼, 曾波, 刘桂珍, 刘天学, 汤继华, 李潮海. 增密对不同株高玉米品种产量和农艺性状动态变化的影响[J]. 中国农业科学, 2026, 59(5): 967-984. |
| [11] | 董金龙, 赵莹, 余海兵, 吕建晔, 秦佳琦, 梁晨, 明博, 李少昆. 多模型解析玉米籽粒容重的营养品质贡献度与区域异质性[J]. 中国农业科学, 2026, 59(5): 985-995. |
| [12] | 张文瑄, 谢硕奇, 吴鑫, 王月强, 李阳光, 张震, 任小丽, 高腾云, 梁栋, 黄河天. 中国荷斯坦牛初生重和断奶重遗传参数及育种值估计[J]. 中国农业科学, 2026, 59(4): 900-911. |
| [13] | 崔士友, 陈澎军, 缪源卿, 韩继军, 沈俊明. EMS诱变抗草甘膦小麦新种质的创制与大田评价[J]. 中国农业科学, 2026, 59(4): 723-733. |
| [14] | 钱瑾, 李映雪, 吴芳, 邹晓晨. 集成光谱降维的冬小麦叶片磷含量估算[J]. 中国农业科学, 2026, 59(4): 781-792. |
| [15] | 孔媛, 崔沙沙, 李美, 李健, 杨思雨, 房锋, 刘帅帅, 刘明平, 曾艳, 高兴祥, 柏连阳. 黄淮海冬小麦田多花黑麦草等5种禾本科杂草时空分布变化规律[J]. 中国农业科学, 2026, 59(4): 807-823. |
|
||