


中国农业科学 ›› 2022, Vol. 55 ›› Issue (17): 3365-3379.doi: 10.3864/j.issn.0578-1752.2022.17.009
王巧娟1,2( ),何虹1,2,李亮1,2,张超3(),蔡焕杰1,2()
收稿日期:2021-07-29
接受日期:2021-09-15
出版日期:2022-09-01
发布日期:2022-09-07
联系方式:
王巧娟,Tel:13369594179;E-mail: wangqj-0407@nwafu.edu.cn。
基金资助:
WANG QiaoJuan1,2(),HE Hong1,2,LI Liang1,2,ZHANG Chao3(),CAI HuanJie1,2()
Received:2021-07-29
Accepted:2021-09-15
Published:2022-09-01
Online:2022-09-07
摘要:
【目的】 探究AquaCrop模型在关中地区的适用性,寻求大豆在不同降水年型下最适宜的灌溉制度。【方法】 用田间试验实测数据对该模型进行校正,并用校准后的模型模拟1961—2019年内所有3种不同降水年型14种灌溉制度下的大豆产量和水分利用效率。【结果】 AquaCrop模型模拟田间产量最高处理的冠层覆盖度的决定系数(R 2)、均方根误差(RMSE)、标准均方根误差(NRMSE)及Nash效率系数(EF)分别为0.96、7.15%、11.03%和0.94;模拟值与实测值生物量的决定系数(R 2)、均方根误差(RMSE)、标准均方根误差(NRMSE)及Nash效率系数(EF)分别为0.99、526.04 kg·hm-2、14.45%和0.97;最终产量模拟的决定系数(R 2)、均方根误差(RMSE)、标准均方根误差(NRMSE)及Nash效率系数(EF)分别为0.97、49.98 kg·hm-2、1.74%和0.82,各处理的冠层覆盖度和生物量实测值与模拟值的R 2均大于0.95,说明AquaCrop模型可以较好地模拟关中地区大豆的生长发育动态与产量。结合模型模拟结果可知,大豆作物需水量平均值为398.2 mm,各个生育时期的需水量差异较大,分枝期需水量为127.8 mm,开花-结荚期需水量为212.6 mm,鼓粒期的需水量为57.7 mm。结合对3种不同降水年型进行不同灌溉制度模拟后发现,大豆开花-结荚期为需水关键期,该生育时期水分供应情况影响大豆的最终产量。在湿润年可以不灌水;平水年和干旱年仅在开花-结荚期分别灌溉45和70 mm可实现最高产量(2 699、2 486 kg·hm-2)和最大水分利用效率(0.74、0.7 kg·m-3)。【结论】 该地区大豆灌溉制度,应以不同降水年型分布情况为基础对大豆灌溉制度进行选择,可保证大豆具有较高的产量和水分利用效率,可作为关中地区大豆灌溉制度的参考依据。
王巧娟,何虹,李亮,张超,蔡焕杰. 基于AquaCrop模型的大豆灌溉制度优化研究[J]. 中国农业科学, 2022, 55(17): 3365-3379.
WANG QiaoJuan,HE Hong,LI Liang,ZHANG Chao,CAI HuanJie. Research on Soybean Irrigation Schedule Based on AquaCrop Model[J]. Scientia Agricultura Sinica, 2022, 55(17): 3365-3379.
表1
土壤物理性质"
| 土壤深度 Soil depth (cm) | 黏粒 Clay (%) | 粉粒 Silt (%) | 砂粒 Sand (%) | 凋萎含水量 Wilting point (cm3·cm-3) | 饱和含水量 Saturation (cm3·cm-3) | 田间持水量 Field capacity (cm3·cm-3) | 土壤容重 Bulk density (g·cm-3) |
|---|---|---|---|---|---|---|---|
| 0-20 | 26.12 | 40.00 | 33.88 | 11.00 | 32.00 | 31.00 | 1.30 |
| 20-40 | 27.33 | 41.25 | 31.42 | 11.00 | 38.20 | 31.10 | 1.41 |
| 40-60 | 28.20 | 42.40 | 29.40 | 11.00 | 38.60 | 31.20 | 1.45 |
| 60-80 | 26.10 | 41.83 | 32.07 | 13.00 | 39.00 | 31.00 | 1.52 |
| 80-100 | 26.12 | 41.85 | 32.03 | 13.00 | 39.00 | 33.00 | 1.55 |
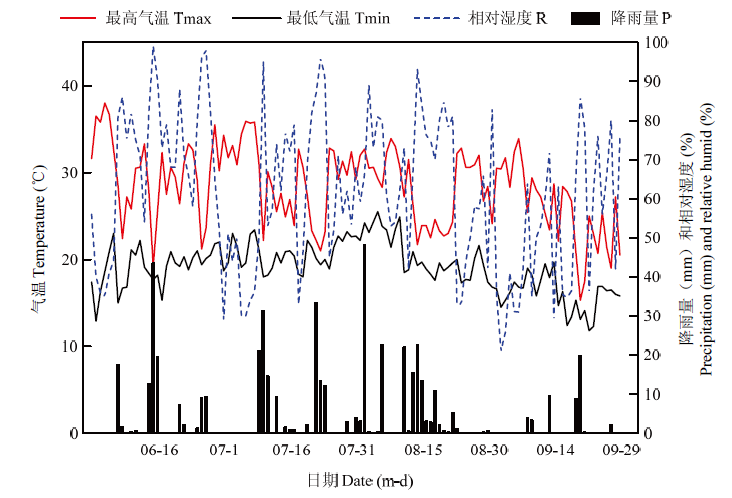
图1
大豆生育期内气象数据"
表2
AquaCrop 模型大豆校准参数"
| 符号Symbol | 定义 Definition | 取值 Value | 单位 Unit |
|---|---|---|---|
| Tbase | 基底温度 Base temperature | 5 | ℃ |
| Tupper | 上限温度 Upper temperature | 40 | ℃ |
| CGC | 冠层增长系数 Canopy growth coefficient | 0.11000 | ℃·d-1 |
| CCx | 最大冠层覆盖度 Maximum canopy cover | 96 | % |
| CDC | 冠层衰减系数 Canopy decline coefficient | 0.015 | ℃·d-1 |
| Zmin | 最小有效生根深度 Minimum effective rooting depth | 0.3 | m |
| Zx | 最大有效生根深度 Maxmum effective rooting depth | 1.2 | m |
| Rexshp | 根区膨胀的形状因子 Shape factor for root zone expansion | 1.5 | m |
| Kcb | 作物系数 Crop coefficient | ||
| KcTrx | 作物蒸腾系数 Crop coefficient for transpiration | 1.05 | - |
| WP* | 标准水分生产力 Water productivity normalized for ET0 and CO2 | 12 | g·m-2 |
| HI0 | 参考收获参数 Reference harvest index | 38 | % |
| Pexp,upper | 限制冠层伸展的土壤水分消耗上限阈值 Soil water depletion threshold for canopy expansion-Upper threshold | 0.15 | - |
| Pexp,lower | 限制冠层伸展的土壤水分消耗下限阈值 Soil water depletion threshold for canopy expansion-Lower threshold | 0.65 | - |
| Pexp,shp | 限制冠层伸展的水分胁迫系数曲线的形状因子 Shape factor for coefficient for canopy expansion | 2.5 | - |
| Psto,upper | 气孔控制土壤水分耗竭阈值上限阈值 Soil water depletion for stomata control-Upper threshold | 0.6 | - |
| Psen,upper | 冠层衰老的土壤水分耗竭因子上限阈值Soil water depletion factor for canopy senescence-Upper threshold | 0.7 | - |
| Ppol,upper | 授粉土壤水分耗竭因子上限阈值Soil water depletion factor for pollination-Upper threshold | 0.8 | - |
表3
灌溉制度情景方案"
| 灌溉方案 Irrigation schedule | 生育期阶段灌溉量Growth stage (mm) | 灌溉定额 Irrigation amount (mm) | ||
|---|---|---|---|---|
| 分枝期 (30 d) Branching stage | 开花-结荚期 (70 d) Flowering and podding stage | 鼓粒期 (90 d) Seed filling stage | ||
| P1 | 0 | 0 | 0 | 0 |
| P2 | 45 | 0 | 0 | 45 |
| P3 | 0 | 45 | 0 | 45 |
| P4 | 0 | 0 | 45 | 45 |
| P5 | 70 | 0 | 0 | 70 |
| P6 | 0 | 70 | 0 | 70 |
| P7 | 0 | 0 | 70 | 70 |
| P8 | 45 | 45 | 0 | 90 |
| P9 | 45 | 0 | 45 | 90 |
| P10 | 0 | 45 | 45 | 90 |
| P11 | 70 | 70 | 0 | 140 |
| P12 | 0 | 70 | 70 | 140 |
| P13 | 70 | 0 | 70 | 140 |
| P14 | 70 | 70 | 70 | 210 |
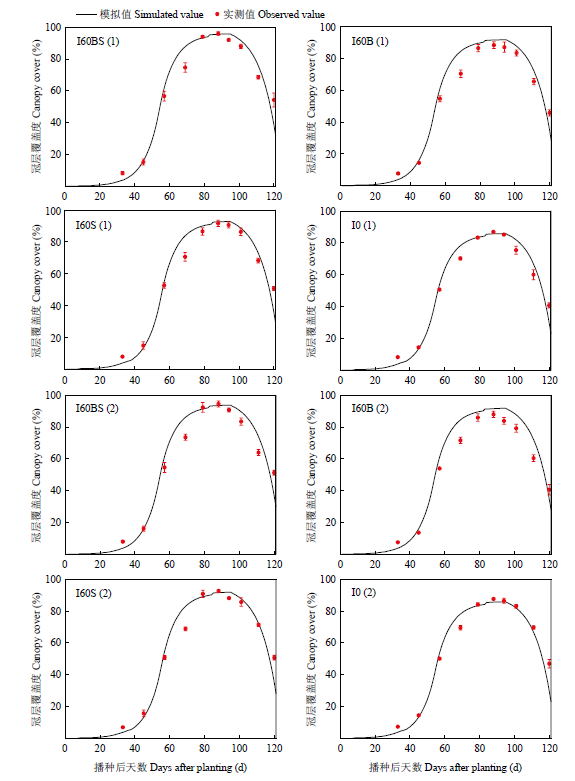
图2
大豆冠层覆盖度的模拟值与实测值比较 B为分枝期英文首字母,S为鼓粒期英文首字母。数据集(1)用于模型率定,数据集(2)用于模型验证。下同"
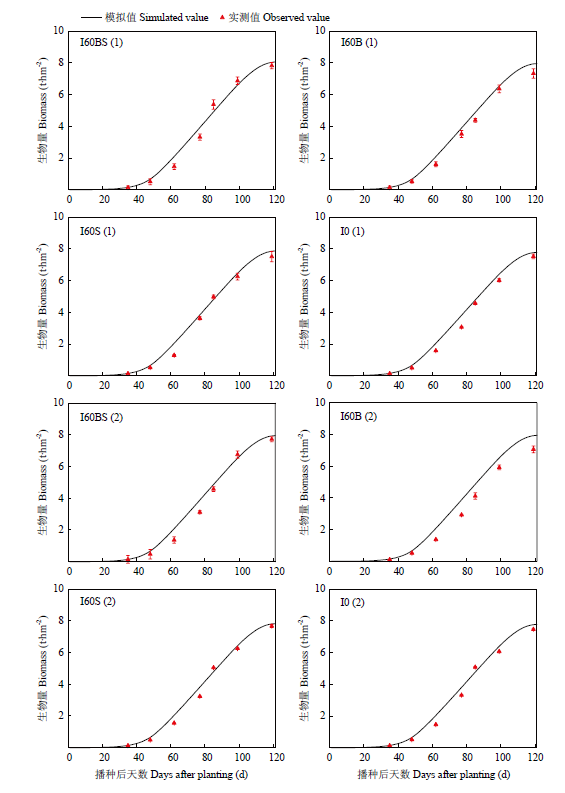
图3
大豆地上部生物量的模拟值与实测值的比较"
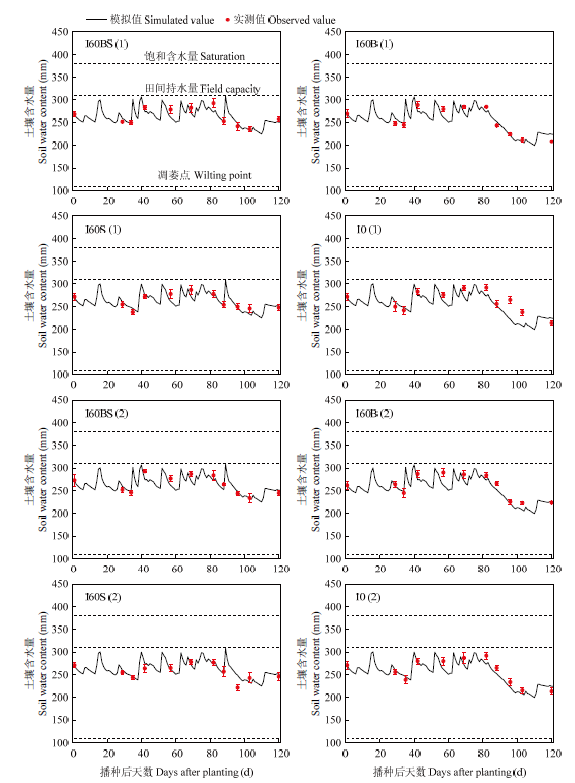
图4
大豆土壤含水量的模拟值与实测值的比较"
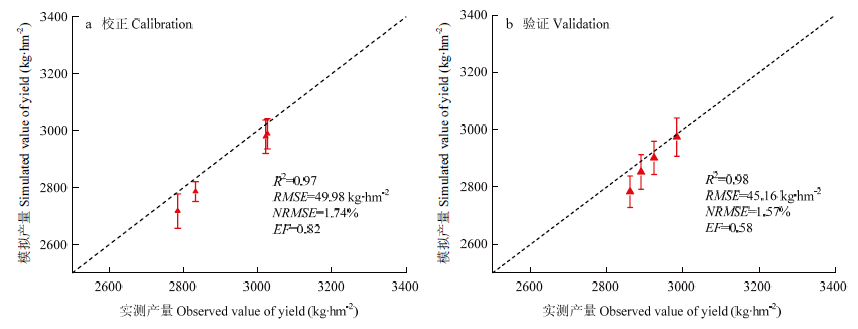
图5
大豆产量模拟值与实测值的比较"
表4
模拟值与实测值的验证结果"
| 产量 Yield (kg·hm-2) | |||||
|---|---|---|---|---|---|
| 处理 Treatment | 模拟值 Simulated value | 实测值 Measured value | 相对误差 Relative error (%) | ||
| 校正 Calibration | I60BS | 1 | 3026 | 2988 | 1.26 |
| 2 | 3021 | 2978 | 1.42 | ||
| I0 | 1 | 2832 | 2785 | 1.66 | |
| 2 | 2784 | 2717 | 2.41 | ||
| 验证 Validation | I60B | 1 | 2924 | 2901 | 0.79 |
| 2 | 2984 | 2974 | 0.34 | ||
| I60S | 1 | 2890 | 2852 | 1.31 | |
| 2 | 2861 | 2783 | 2.73 | ||
表5
不同降水年型不同灌溉方案模拟结果"
| 灌溉方案 Irrigation schedule | 灌溉定额 Irrigation amount (mm) | 产量Yield (kg·hm-2) | 水分利用效率WUE (kg·m-3) | ||||
|---|---|---|---|---|---|---|---|
| 干旱年 Dry year | 平水年 Normal year | 湿润年 Wet year | 干旱年 Dry year | 平水年 Normal year | 湿润年 Wet year | ||
| P1 | 0 | 1700 | 2455 | 2780 | 0.51 | 0.69 | 0.79 |
| P2 | 45 | 1874 | 2548 | 2857 | 0.52 | 0.69 | 0.78 |
| P3 | 45 | 2279 | 2699 | 2867 | 0.63 | 0.74 | 0.81 |
| P4 | 45 | 2117 | 2571 | 2791 | 0.61 | 0.71 | 0.79 |
| P5 | 70 | 1879 | 2554 | 2865 | 0.52 | 0.69 | 0.78 |
| P6 | 70 | 2486 | 2758 | 2873 | 0.70 | 0.75 | 0.81 |
| P7 | 70 | 2185 | 2581 | 2791 | 0.62 | 0.72 | 0.79 |
| P8 | 90 | 2470 | 2787 | 2941 | 0.64 | 0.73 | 0.79 |
| P9 | 90 | 2328 | 2667 | 2870 | 0.62 | 0.71 | 0.78 |
| P10 | 90 | 2505 | 2743 | 2869 | 0.68 | 0.74 | 0.81 |
| P11 | 140 | 2661 | 2843 | 2951 | 0.68 | 0.74 | 0.79 |
| P12 | 140 | 2644 | 2773 | 2871 | 0.69 | 0.75 | 0.81 |
| P13 | 140 | 2398 | 2679 | 2875 | 0.63 | 0.71 | 0.78 |
| P14 | 210 | 2827 | 2861 | 2950 | 0.70 | 0.74 | 0.79 |
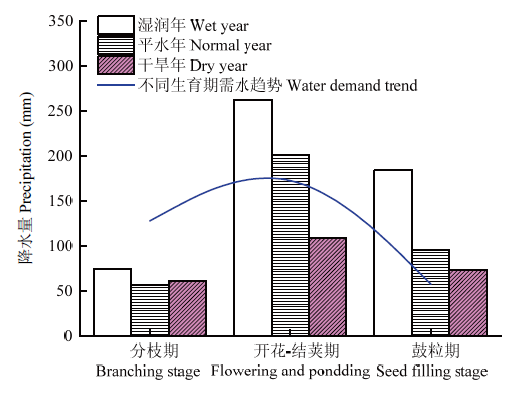
图6
不同年型下大豆生育期的平均降水量与需水趋势"
| [1] |
DI GIORGIO L, SALGADO P R, MAURI A N. Encapsulation of fish oil in soybean protein particles by emulsification and spray drying. Food Hydrocolloids, 2019, 87: 891-901.
doi: 10.1016/j.foodhyd.2018.09.024 |
| [2] |
NISHINARI K, FANG Y, GUO S, PHILLIPS G O. Soy proteins: A review on composition, aggregation and emulsification. Food Hydrocolloids, 2014, 39: 301-318.
doi: 10.1016/j.foodhyd.2014.01.013 |
| [3] |
YANG M H, JAHUFER M Z Z, HE J, DONG R, HOFMANN R, SIDDIQUE K H M, LI F M. Effect of traditional soybean breeding on water use strategy in arid and semi-arid areas. European Journal of Agronomy, 2020, 120: 126128.
doi: 10.1016/j.eja.2020.126128 |
| [4] |
ZHANG L X, ZHU L L, YU M Y, ZHONG M X. Warming decreases photosynthates and yield of soybean[Glycine max (L.) Merrill] in the North China Plain. The Crop Journal, 2016, 4(2): 139-146.
doi: 10.1016/j.cj.2015.12.003 |
| [5] |
HE L A, JIN N, YU Q A. Impacts of climate change and crop management practices on soybean phenology changes in China. Science of the Total Environment, 2020, 707: 135638.
doi: 10.1016/j.scitotenv.2019.135638 |
| [6] | 中华人民共和国国家统计局. 中国统计年鉴. 陕西: 中国统计出版社, 2020. |
| National Bureau of Statistics of the People’s Republic of China. China Statistical Yearbook. Shaanxi: China Statistics Press, 2020. (in Chinese) | |
| [7] |
FIGUEIREDO MOURA DA SILVA E H, SILVA ANTOLIN L A, ZANON A J, SOARES ANDRADE A Junior, ANTUNES DE SOUZA H Junior, DOS SANTOS CARVALHO K Junior, APARECIDO VIEIRA N Junior, MARIN F R Junior. Impact assessment of soybean yield and water productivity in Brazil due to climate change. European Journal of Agronomy, 2021, 129: 126329.
doi: 10.1016/j.eja.2021.126329 |
| [8] | 李斌, 王莉. 基于降水集中度和集中期的关中地区降水时空变化特征分析. 陕西水利, 2020(2): 36-41. |
| LI B, WANG L. Analysis on spatial and temporal variation characteristics of precipitation in Guanzhong area based on precipitation concentration ratio and precipitation concentration period. Shaanxi Water Resources, 2020(2): 36-41. (in Chinese) | |
| [9] |
PARENT B, TARDIEU F. Can current crop models be used in the phenotyping era for predicting the genetic variability of yield of plants subjected to drought or high temperature? Journal of Experimental Botany, 2014, 65(21): 6179-6189.
doi: 10.1093/jxb/eru223 |
| [10] | 闫泽宇, 史海滨, 杨树青, 王佐奎, 王美荣. 呼伦贝尔地区喷灌对大豆生长及水分利用效率的影响. 灌溉排水学报, 2019, 38(5): 19-24. |
| YAN Z Y, SHI H B, YANG S Q, WANG Z K, WANG M R. The use of sprinkler irrigation water by soybean and its consequence for plant growth in the regions of Hulunbeier. Journal of Irrigation and Drainage, 2019, 38(5): 19-24. (in Chinese) | |
| [11] | 由剑波, 陈志东, 高兴民. 基于干旱区的大豆高效节水灌溉制度制定. 黑龙江水利科技, 2012, 40(1): 82-83. |
| YOU J B, CHEN Z D, GAO X M. Formulation of high-efficiency water saving irrigation system for soya bean in dry area. Heilongjiang Science and Technology of Water Conservancy, 2012, 40(1): 82-83. (in Chinese) | |
| [12] | 毛洪霞. 滴灌大豆需水规律及灌溉制度研究. 干旱地区农业研究, 2009, 27(5): 112-117. |
| MAO H X. Research on soybean water requirement and schedule of drip irrigation. Agricultural Research in the Arid Areas, 2009, 27(5): 112-117. (in Chinese) | |
| [13] | 武向良, 高聚林, 王志刚, 李丽君, 张白鸽, 黄振刚, 黄复民, 王建明, 李树芳. 不同时期灌溉对大豆叶片生理特性及水分利用效率的影响. 大豆科学, 2007, 26(5): 695-699. |
| WU X L, GAO J L, WANG Z G, LI L J, ZHANG B G, HUANG Z G, HUANG F M, WANG J M, LI S F. Effect of irrigation at different growth stages on water use efficiency and leaf physiological characteristics of soybean. Soybean Science, 2007, 26(5): 695-699. (in Chinese) | |
| [14] |
PAREDES P, WEI Z, LIU Y, XU D, XIN Y, ZHANG B, PEREIRA L S. Performance assessment of the FAO AquaCrop model for soil water, soil evaporation, biomass and yield of soybeans in North China Plain. Agricultural Water Management, 2015, 152: 57-71.
doi: 10.1016/j.agwat.2014.12.007 |
| [15] | MORELL F J, YANG H S, CASSMAN K G, WART J V, ELMORE R W, LICHT M, COULTER J A, CIAMPITTI I A, PITTELKOW C M, BROUDER S M, THOMISON P, LAUER J, GRAHAM C, MASSEY R, GRASSINI P. Can crop simulation models be used to predict local to regional maize yields and total production in the US Corn Belt? Field Crops Research, 2016, 192: 1-12. |
| [16] | SACKS W J, KUCHARIK C J. Crop management and phenology trends in the US Corn Belt: Impacts on yields, evapotranspiration and energy balance. Agricultural and Forest Meteorology, 2011, 151(7): 882-894. |
| [17] | 朱秀芳, 李宜展, 潘耀忠, 史培军. AquaCrop作物模型研究和应用进展. 中国农学通报, 2014, 30(8): 270-278. |
| ZHU X F, LI Y Z, PAN Y Z, SHI P J. A review on the research and application of AquaCrop model. Chinese Agricultural Science Bulletin, 2014, 30(8): 270-278. (in Chinese) | |
| [18] | 李会, 刘钰, 蔡甲冰, 毛晓敏. AquaCrop模型的适用性及应用初探. 灌溉排水学报, 2011, 30(3): 28-33. |
| LI H, LIU Y, CAI J B, MAO X M. The applicability and application of AquaCrop model. Journal of Irrigation and Drainage, 2011, 30(3): 28-33. (in Chinese) | |
| [19] |
王连喜, 吴建生, 李琪, 顾嘉熠, 薛红喜. AquaCrop作物模型应用研究进展. 地球科学进展, 2015, 30(10): 1100-1106.
doi: 10.11867/j.issn.1001-8166.2015.10.1100 |
|
WANG L X, WU J S, LI Q, GU J Y, XUE H X. A review on the research and application of aqua crop model. Advances in Earth Science, 2015, 30(10): 1100-1106. (in Chinese)
doi: 10.11867/j.issn.1001-8166.2015.10.1100 |
|
| [20] |
TEDESCHI L O. Assessment of the adequacy of mathematical models. Agricultural Systems, 2006, 89(2/3): 225-247.
doi: 10.1016/j.agsy.2005.11.004 |
| [21] |
VERMEIREN P, REICHERT P, SCHUWIRTH N. Integrating uncertain prior knowledge regarding ecological preferences into multi-species distribution models: Effects of model complexity on predictive performance. Ecological Modelling, 2020, 420: 108956.
doi: 10.1016/j.ecolmodel.2020.108956 |
| [22] |
KELLY T D, FOSTER T. AquaCrop-OSPy: Bridging the gap between research and practice in crop-water modeling. Agricultural Water Management, 2021, 254: 106976.
doi: 10.1016/j.agwat.2021.106976 |
| [23] | 刘匣, 丁奠元, 张浩杰, 褚晓升, 余坤, 冯浩. 覆膜条件下对AquaCrop模型冬小麦生长动态和土壤水分模拟效果的评价分析. 中国农业科学, 2017, 50(10): 1841-1854. |
| LIU X, DING D Y, ZHANG H J, CHU X S, YU K, FENG H. Evaluation analysis of AquaCrop model in modeling winter wheat growing development and soil moisture under plastic mulching. Scientia Agricultura Sinica, 2017, 50(10): 1841-1854. (in Chinese) | |
| [24] | 倪玲, 冯浩, 任小川, 郝志鹏. AquaCrop作物模型在黄土塬区夏玉米生产中的适用性评价. 干旱地区农业研究, 2015, 33(6): 40-45. |
| NI L, FENG H, REN X C, HAO Z P. Applicable evaluation of crop model AquaCrop for summer maize production in Loess Plateau Region. Agricultural Research in the Arid Areas, 2015, 33(6): 40-45. (in Chinese) | |
| [25] | 张卫华. AquaCrop模型在黄土高原夏玉米生产中的应用和验证. 土地开发工程研究, 2018, 3(2): 49-53, 58. |
| ZHANG W H. Evaluation and application of the AquaCrop model for simulating yield for maize (Zea mays L.) on Loess Plateau. Land Development and Engineering Research, 2018, 3(2): 49-53, 58. (in Chinese) | |
| [26] | 程载恒. 基于AquaCrop模型的河套灌区向日葵灌溉制度研究[D]. 银川: 宁夏大学, 2017. |
| CHENG Z H. Based on AquaCrop model research on sunflower irrigation schedule in Hetao irrigation area[D]. Yinchuan: Ningxia University, 2017. (in Chinese) | |
| [27] |
ADEBOYE O B, SCHULTZ B, ADEBOYE A P, ADEKALU K O, OSUNBITAN J A. Application of the AquaCrop model in decision support for optimization of nitrogen fertilizer and water productivity of soybeans. Information Processing in Agriculture, 2020, 2(10): 2214-3173. DOI: 10.1016/j.inpa.2020.10.002.
doi: 10.1016/j.inpa.2020.10.002 |
| [28] |
TAN S, WANG Q J, ZHANG J H, CHEN Y, SHAN Y Y, XU D. Performance of AquaCrop model for cotton growth simulation under film-mulched drip irrigation in southern Xinjiang, China. Agricultural Water Management, 2018, 196: 99-113.
doi: 10.1016/j.agwat.2017.11.001 |
| [29] |
XU J Z, BAI W H, LI Y W, WANG H Y, YANG S H, WEI Z. Modeling rice development and field water balance using AquaCrop model under drying-wetting cycle condition in Eastern China. Agricultural Water Management, 2019, 213: 289-297.
doi: 10.1016/j.agwat.2018.10.028 |
| [30] |
MONTOYA F, GARCÍA C, PINTOS F, OTERO A. Effects of irrigation regime on the growth and yield of irrigated soybean in temperate humid climatic conditions. Agricultural Water Management, 2017, 193: 30-45.
doi: 10.1016/j.agwat.2017.08.001 |
| [31] | LIU S, ZHANG X Y, YANG J Y, DRURY C F. Effect of conservation and conventional tillage on soil water storage, water use efficiency and productivity of corn and soybean in Northeast China. Acta Agriculturae Scandinavica, Section B — Soil & Plant Science, 2013, 63(5): 383-394. |
| [32] |
VERGER A, MARTÍNEZ B, CAMACHO-DE COCA F, GARCÍA- HARO F J. Accuracy assessment of fraction of vegetation cover and leaf area index estimates from pragmatic methods in a cropland area. International Journal of Remote Sensing, 2009, 30(10): 2685-2704.
doi: 10.1080/01431160802555804 |
| [33] |
YAN Z X, GAO C, REN Y J, ZONG R, MA Y Z, LI Q Q. Effects of pre-sowing irrigation and straw mulching on the grain yield and water use efficiency of summer maize in the North China Plain. Agricultural Water Management, 2017, 186: 21-28.
doi: 10.1016/j.agwat.2017.02.017 |
| [34] | VANUYTRECHT E, RAES D, STEDUTO P, HSIAO T C, FERERES E, HENG L K, GARCIA VILA M, MEJIAS MORENO P. AquaCrop: FAO's crop water productivity and yield response model. Environmental Modelling & Software, 2014, 62: 351-360. |
| [35] |
SANDHU R, IRMAK S. Performance of AquaCrop model in simulating maize growth, yield, and evapotranspiration under rainfed, limited and full irrigation. Agricultural Water Management, 2019, 223: 105687.
doi: 10.1016/j.agwat.2019.105687 |
| [36] |
YANG J M, YANG J Y, LIU S, HOOGENBOOM G. An evaluation of the statistical methods for testing the performance of crop models with observed data. Agricultural Systems, 2014, 127: 81-89. DOI: 10.1016/j.agsy.2014.01.008.
doi: 10.1016/j.agsy.2014.01.008 |
| [37] |
ARAYA A, KEESSTRA S D, STROOSNIJDER L. Simulating yield response to water of Teff (Eragrostis tef) with FAO's AquaCrop model. Field Crops Research, 2010, 116(1/2): 196-204.
doi: 10.1016/j.fcr.2009.12.010 |
| [38] |
MABHAUDHI T, MODI A T, BELETSE Y G. Parameterisation and evaluation of the FAO-AquaCrop model for a South African taro (Colocasia esculenta L. Schott) Landrace. Agricultural and Forest Meteorology, 2014, 192/193: 132-139.
doi: 10.1016/j.agrformet.2014.03.013 |
| [39] |
DESPOTOVIC M, NEDIC V, DESPOTOVIC D, CVETANOVIC S. Evaluation of empirical models for predicting monthly mean horizontal diffuse solar radiation. Renewable and Sustainable Energy Reviews, 2016, 56: 246-260.
doi: 10.1016/j.rser.2015.11.058 |
| [40] |
GUO S L, ZHU H H, DANG T H, WU J S, LIU W Z, MIN D H, LI Y, SYERS J K. Winter wheat grain yield associated with precipitation distribution under long-term nitrogen fertilization in the semiarid Loess Plateau in China. Geoderma, 2012, 189/190: 442-450.
doi: 10.1016/j.geoderma.2012.06.012 |
| [41] | 姜浩, 聂堂哲, 陈鹏, 张忠学. 基于CROPWAT模型的大豆需水量及灌溉制度研究. 水利水电技术, 2018, 49(11): 211-217. |
| JIANG H, NIE T Z, CHEN P, ZHANG Z X. CROPWAT model-based study on water demand and irrigation system of soybean. Water Resources and Hydropower Engineering, 2018, 49(11): 211-217. (in Chinese) | |
| [42] | ADEBOYE O B, SCHULTZ B, ADEKALU K O, PRASAD K C. Performance evaluation of AquaCrop in simulating soil water storage, yield, and water productivity of rainfed soybeans (Glycine max L. merr) in Ile-Ife, Nigeria. Agricultural Water Management, 2019, 213: 1130-1146. |
| [43] |
CUI Y, JIANG S M, JIN J L, NING S W, FENG P. Quantitative assessment of soybean drought loss sensitivity at different growth stages based on S-shaped damage curve. Agricultural Water Management, 2019, 213: 821-832.
doi: 10.1016/j.agwat.2018.11.020 |
| [44] |
DOGAN E, KIRNAK H, COPUR O. Deficit irrigations during soybean reproductive stages and CROPGRO-soybean simulations under semi-arid climatic conditions. Field Crops Research, 2007, 103(2): 154-159.
doi: 10.1016/j.fcr.2007.05.009 |
| [45] |
SUYKER A E, VERMA S B. Evapotranspiration of irrigated and rainfed maize-soybean cropping systems. Agricultural and Forest Meteorology, 2009, 149(3/4): 443-452.
doi: 10.1016/j.agrformet.2008.09.010 |
| [46] | FOROUD N, MÜNDEL H H, SAINDON G, ENTZ T. Effect of level and timing of moisture stress on soybean plant development and yield components. Irrigation Science, 1993, 13(4): 149-155. |
| [47] |
SUYKER A E, VERMA S B. Coupling of carbon dioxide and water vapor exchanges of irrigated and rainfed maize-soybean cropping systems and water productivity. Agricultural and Forest Meteorology, 2010, 150(4): 553-563.
doi: 10.1016/j.agrformet.2010.01.020 |
| [48] | 王龙, 魏永霞, 吴限. 黑土区调亏灌溉条件下大豆耗水规律试验研究. 节水灌溉, 2014(11): 29-33. |
| WANG L, WEI Y X, WU X. Experimental study on water consumption law for soybean in black soil region under regulated deficit irrigation. Water Saving Irrigation, 2014(11): 29-33. (in Chinese) | |
| [49] |
DESCLAUX D, HUYNH T T, ROUMET P. Identification of soybean plant characteristics that indicate the timing of drought stress. Crop Science, 2000, 40(3): 716-722.
doi: 10.2135/cropsci2000.403716x |
| [1] | 彭廷燊, 陆久焱, 吴美林, 严雨欣, 刘宏周, 南文斌, 秦小健, 李明, 龚俊义, 梁永书. 多年生水稻黄糯2号和长白7号产量相关性状的QTL分析[J]. 中国农业科学, 2026, 59(7): 1361-1379. |
| [2] | 王玉萍, 符质, 孙佳莹, 穆晓萌, 刘慧淋, 郭进云, 宋文菁, 侯雷平, 赵海亮. 苗期施用褪黑素对番茄短期低温胁迫的缓解作用与应用效果评价[J]. 中国农业科学, 2026, 59(7): 1523-1535. |
| [3] | 王佳诺, 陈桂平, 李盼, 王丽萍, 南运有, 何蔚, 樊志龙, 胡发龙, 柴强, 殷文, 赵连豪. 免耕地膜两年覆盖提高绿洲灌区玉米产量的灌浆期光合生理机制[J]. 中国农业科学, 2026, 59(6): 1189-1202. |
| [4] | 周新杰, 任昊, 陈应龙, 张吉旺, 赵斌, 任佰朝, 刘鹏, 王洪章. 过氧化钙对渍涝农田夏玉米根系形态及产量形成的影响[J]. 中国农业科学, 2026, 59(6): 1203-1216. |
| [5] | 何继航, 张擎, 吕相月, 薛吉全, 徐淑兔, 刘建超. 不同保绿型玉米杂交种氮效率评价[J]. 中国农业科学, 2026, 59(6): 1217-1230. |
| [6] | 李永娟, 张悦彤, 王艺博, 赵长江, 宋洁, 陈雪丽, 姚钦. 生物炭施用对大豆轮连作系统土壤固氮微生物nifH基因丰度及群落组成的影响[J]. 中国农业科学, 2026, 59(6): 1272-1285. |
| [7] | 郭富城, 唐海江, 郝馨怡, 马国林, 杨九菊, 黄霖锋, 田蕾, 王彬, 罗成科. 不同灌溉方式对宁夏盐渍化土壤水盐运移、水稻产量及水分利用效率的影响[J]. 中国农业科学, 2026, 59(4): 750-764. |
| [8] | 郝琨, 陈洪德, 张威, 钟韵, 党美荣, 朱士江, 黄志坤, 金英. 基于柑橘产量、品质及水氮利用的涌泉根灌水氮综合评价[J]. 中国农业科学, 2026, 59(4): 862-873. |
| [9] | 刘方东, 孙磊, 王吴彬, 赵晋铭, 盖钧镒. 我国大豆种植制度的变更和生态栽培区划调整的建议[J]. 中国农业科学, 2026, 59(3): 486-498. |
| [10] | 延廷霖, 杜娅丹, 胡笑涛, 王贺, 李晓雁, 王玉明, 牛文全, 谷晓博. 加气滴灌下氮肥有机替代对亏缺灌溉棉花产量和水分利用效率的影响[J]. 中国农业科学, 2026, 59(3): 602-618. |
| [11] | 蔡廷阳, 朱玉鹏, 李瑞东, 吴宗声, 徐一帆, 宋雯雯, 徐彩龙, 吴存祥. 苗期叶损伤对黄淮海夏大豆光合特性、荚果分布及产量形成的影响[J]. 中国农业科学, 2026, 59(2): 292-304. |
| [12] | 张志勇, 谭世超, 熊淑萍, 马新明, 韦一昊, 王小纯. 水氮周年优化对豫北灌区小麦玉米轮作系统产量和氮迁移的影响[J]. 中国农业科学, 2026, 59(2): 336-353. |
| [13] | 吕旭东, 孙世媛, 李亚楠, 刘玉龙, 王艳群, 付鑫, 张佳英, 宁鹏, 彭正萍. 智能机械化分层施肥对麦田根-土养分分布和小麦产量的影响[J]. 中国农业科学, 2026, 59(1): 129-146. |
| [14] | 陆浩, 张明龙, 韩梅, 严清彪, 李正鹏, 殷文, 樊志龙, 胡发龙, 柴强. 绿肥过腹还田协同氮肥减施提高小麦产量和土壤质量[J]. 中国农业科学, 2026, 59(1): 147-160. |
| [15] | 叶美金, 陈家婷, 周界光, 尹丽, 胡欣荣, 兰雨昕, 陈斌, 苏龙兴, 刘家君, 刘天超, 李小雨, 马建. 小麦穗密度主效QTL的鉴定、验证及其遗传效应分析[J]. 中国农业科学, 2026, 59(1): 17-28. |
|
||