






中国农业科学 ›› 2026, Vol. 59 ›› Issue (10): 2138-2153.doi: 10.3864/j.issn.0578-1752.2026.10.006
王胜楠1( ), 高茂盛2, 韩婉瑞1, 冯浩伟1, 林祥1, 王东1()
收稿日期:2025-07-18
接受日期:2026-03-10
出版日期:2026-05-16
发布日期:2026-05-20
通信作者:
联系方式:
王胜楠,E-mail:wangsn@nwafu.edu.cn。
基金资助:
WANG ShengNan1(), GAO MaoSheng2, HAN WanRui1, FENG HaoWei1, LIN Xiang1, WANG Dong1()
Received:2025-07-18
Accepted:2026-03-10
Published:2026-05-16
Online:2026-05-20
摘要:
【目的】揭示气候变暖背景下农业气候分界线的时空演变规律及其对粮食产量的影响,为优化农业布局和制定气候变化适应策略提供科学依据。【方法】基于1961—2020年全国495个气象站点数据,利用Mann-Kendall突变检验和贡献率分析等方法探究气候突变前后主要农业气候分界线:1月0 ℃等温线、≥10 ℃积温4 500 ℃等积温线及200、400和800 mm等降水量线的时空变化,解析迁移特征并量化其对粮食单产的贡献率。【结果】(1)1月份全国平均温度于1987年发生突变,突变后升高了0.96 ℃;≥10 ℃积温于2002年发生突变,突变后升高了251.19 ℃;降水量于2015年发生突变,突变后增加了53.58 mm。(2)1月平均温度突变后,0 ℃等温线整体北移,东段(陕西、河南、安徽、江苏、山东)波动显著,北移幅度达1.5个纬距。(3)≥10 ℃积温突变后,4 500 ℃等积温线北扩,且东段(陕西、河北、山东)北移显著,最北界由突变前位于河北省中部(38.9 °N)到突变后贯穿京津冀地区(39.7 °N),西段(新疆、甘肃)变化平缓。(4)等降水量线在局部地区呈北移西迁的态势:200 mm等降水量线在内蒙古西迁了约3.0个经距,干旱区缩小;400 mm等降水量线在内蒙古地区北移了约5.5个纬距,半湿润区北扩;800 mm等降水量线在四川省北移了约2.5个纬距,湿润区北扩。(5)≥10 ℃积温和降水量在突变后对气象粮食单产贡献率增加,其中降水量贡献率最大,为27.10%,而1月份平均温度贡献率在突变后减少。【结论】气候变暖驱动我国1月0 ℃等温线和≥10 ℃积温4 500 ℃等积温线突变后整体北移,陕西省以东线段尤为明显,200和400 mm等降水量线突变后在内蒙古地区北移西迁,800 mm等降水量线突变后在河南南阳和安徽亳州向南移动,其余线段向北移动,其中位于四川省中部的线段北移明显(约2.5个纬距);在农业气候分界线波动区域,水热条件变化推动了粮食单产的提高。
王胜楠, 高茂盛, 韩婉瑞, 冯浩伟, 林祥, 王东. 气候变暖对农业气候分界线时空变化的影响[J]. 中国农业科学, 2026, 59(10): 2138-2153.
WANG ShengNan, GAO MaoSheng, HAN WanRui, FENG HaoWei, LIN Xiang, WANG Dong. Impacts of Climate Warming on the Spatiotemporal Dynamics of Agro-Climatic Boundaries[J]. Scientia Agricultura Sinica, 2026, 59(10): 2138-2153.
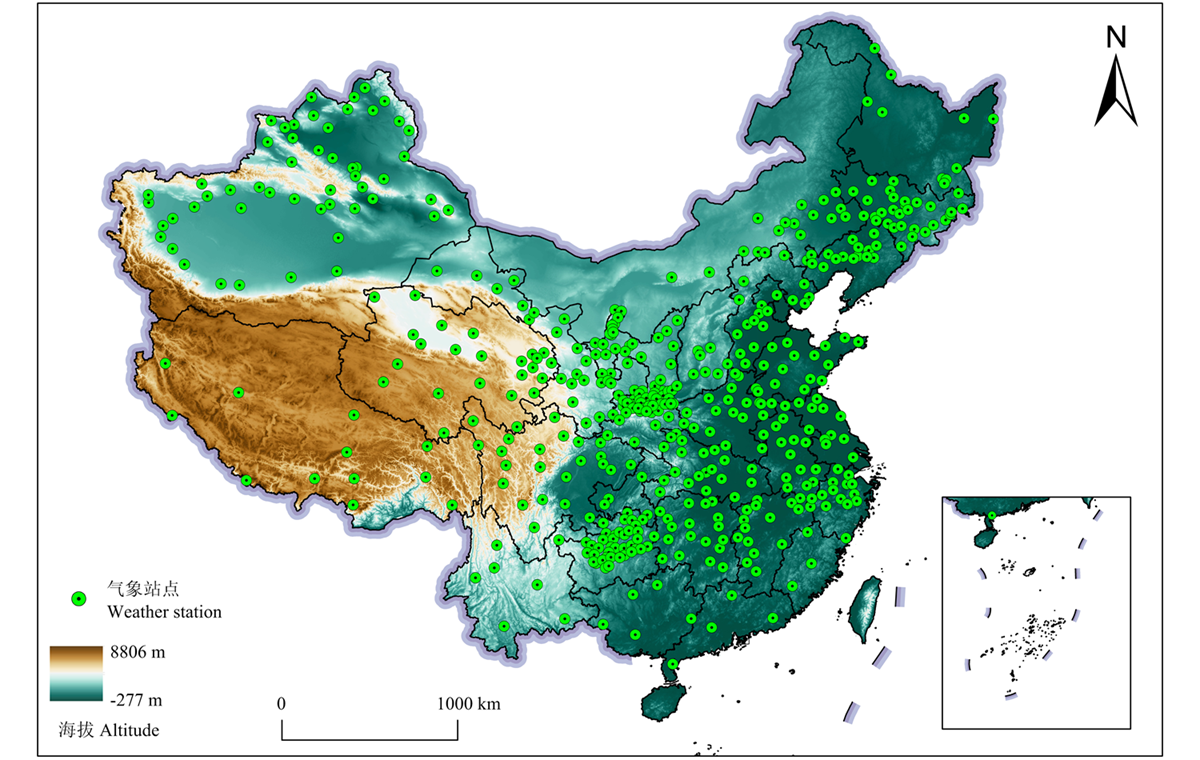
图1
气象站点分布图 审图号:GS京(2026)0943号"
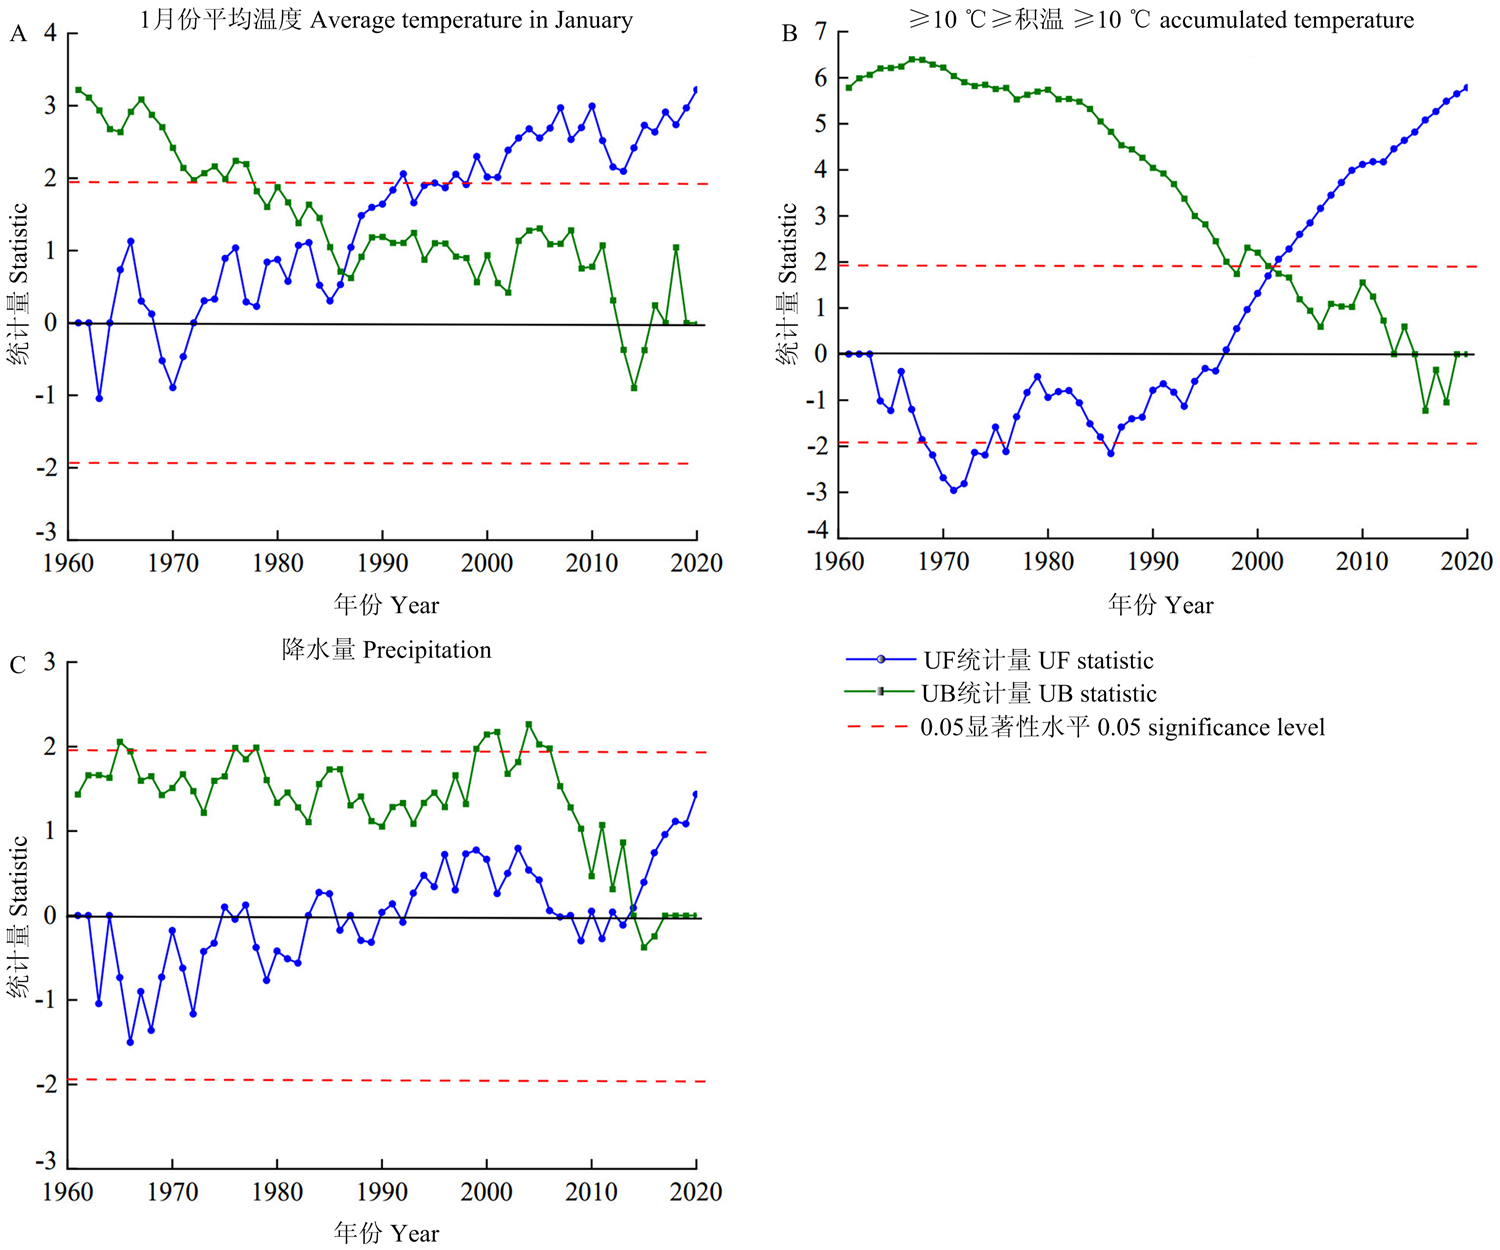
图2
1961—2020年1月份平均温度、≥10 ℃积温和降水量的Mann-Kendall突变检验"
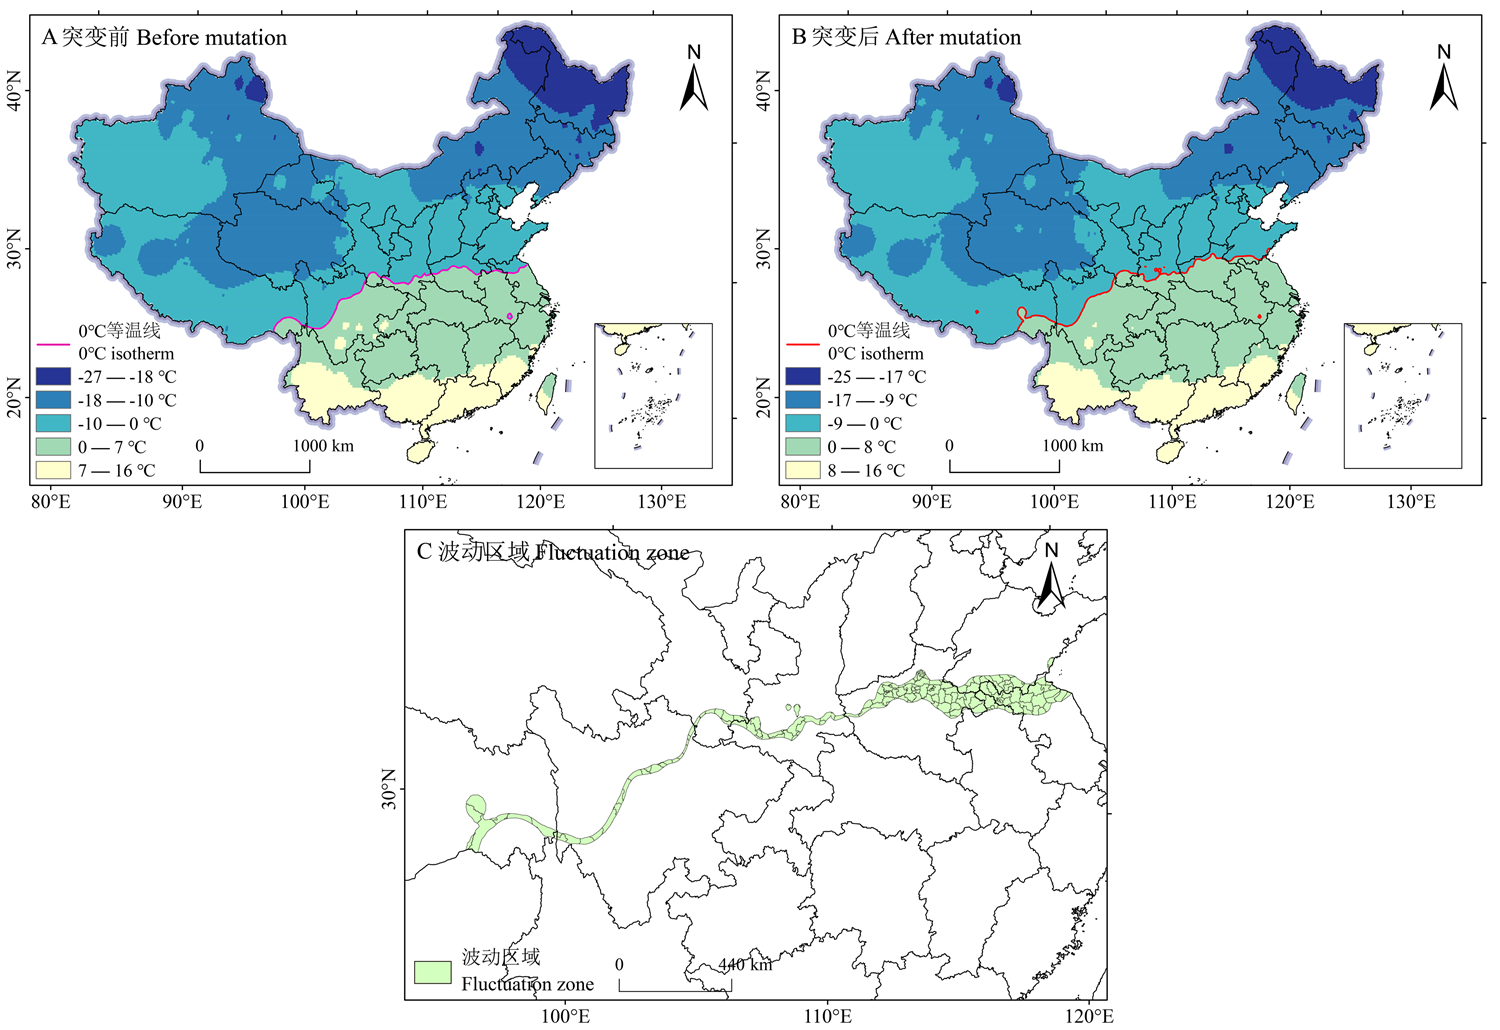
图3
1961—2020年1月份平均温度突变前后0 ℃等温线分布图及波动区域 审图号:GS京(2026)0943号 A:1月份0 ℃等温线突变前位置;B:1月份0 ℃等温线突变后位置;C:1月份0 ℃等温线突变前后波动区域位置"
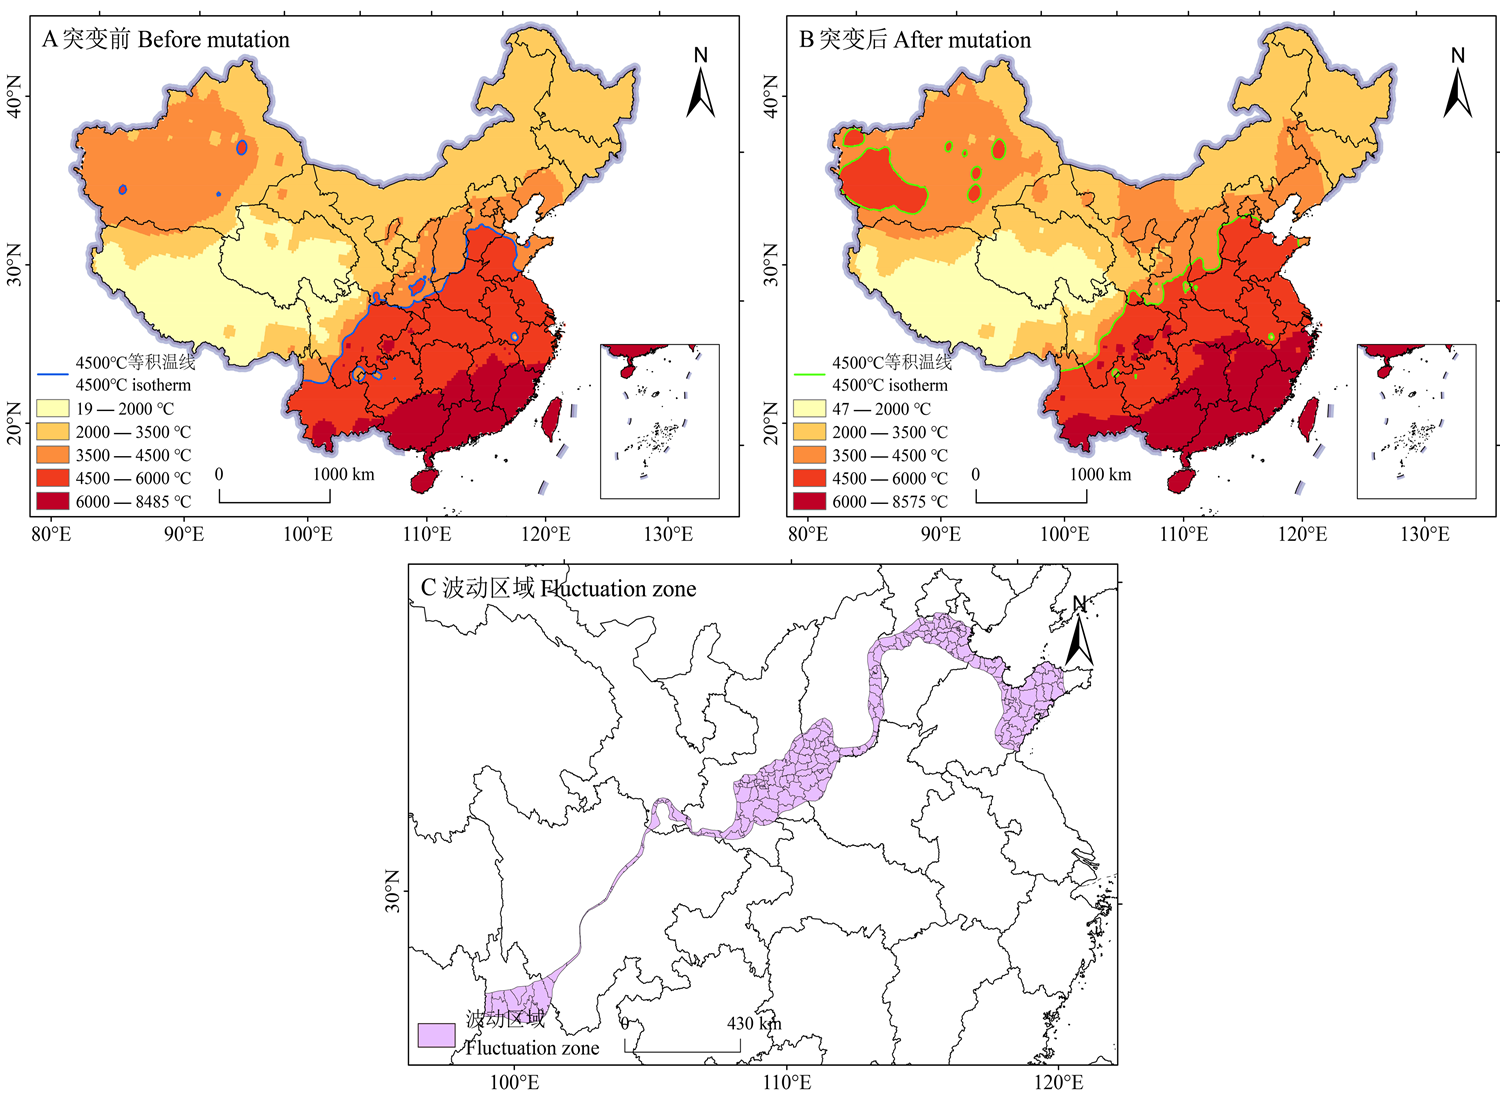
图4
1961—2020年≥10 ℃积温突变前后4 500 ℃等积温线分布图及波动区域 审图号:GS京(2026)0943号 A:4500 ℃等积温线突变前位置;B:4500 ℃等积温线突变后位置;C:4500 ℃等积温线突变前后波动区域位置"
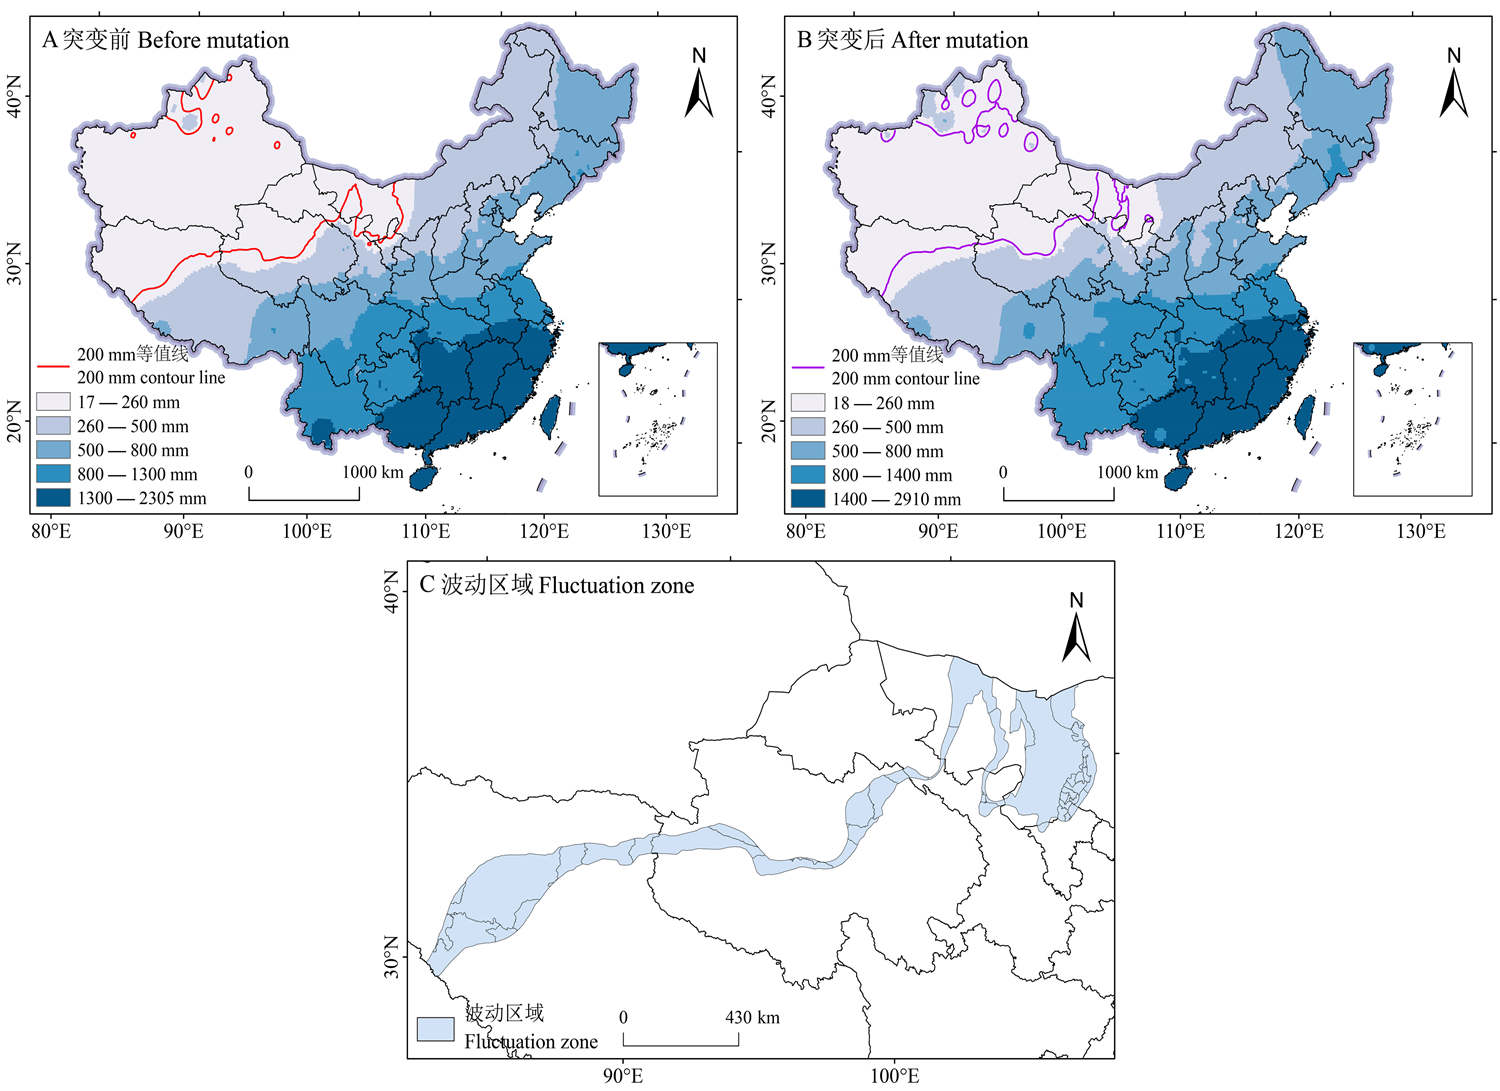
图5
1961—2020年降水量突变前后200 mm等降水量线分布图及波动区域 审图号:GS京(2026)0943号 A:200 mm等降水量线突变前位置;B:200 mm等降水量线突变后位置;C:200 mm等降水量线突变前后波动区域位置"
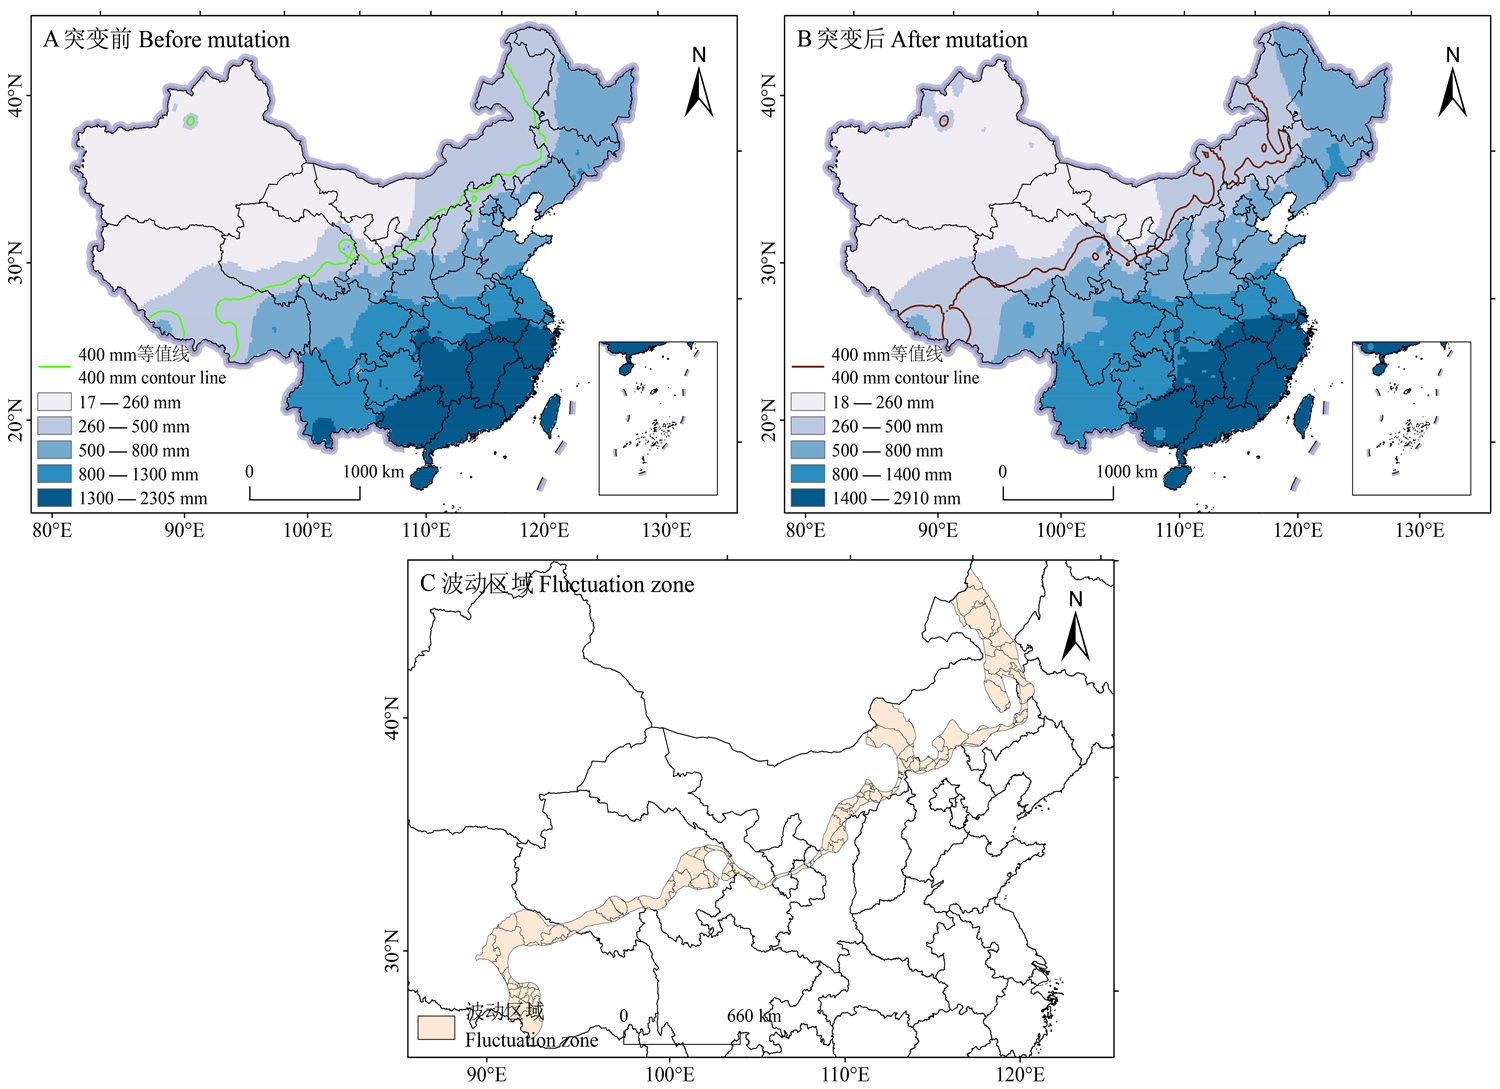
图6
1961—2020年降水量突变前后400 mm等降水量线分布图及波动区域 审图号:GS京(2026)0943号 A:400 mm等降水量线突变前位置;B:400 mm等降水量线突变后位置;C:400 mm等降水量线突变前后波动区域位置"
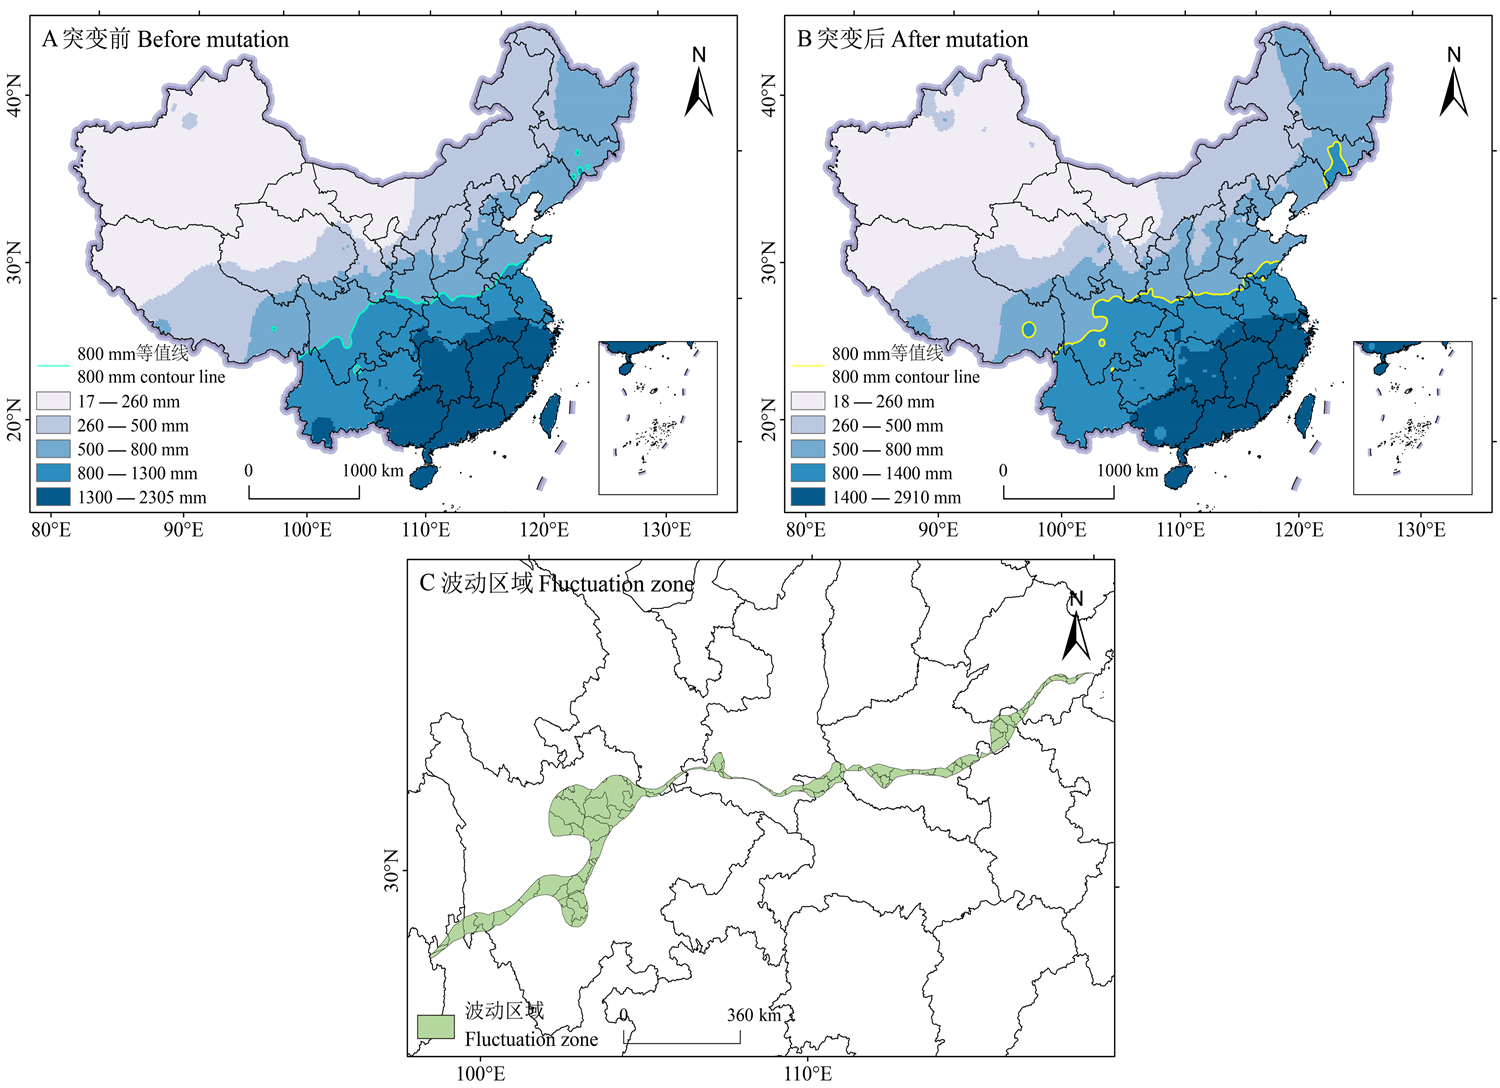
图7
1961—2020年降水量突变前后800 mm等降水量线分布图及波动区域 审图号:GS京(2026)0943号 A:800 mm等降水量线突变前位置;B:800 mm等降水量线突变后位置;C:800 mm等降水量线突变前后波动区域位置"
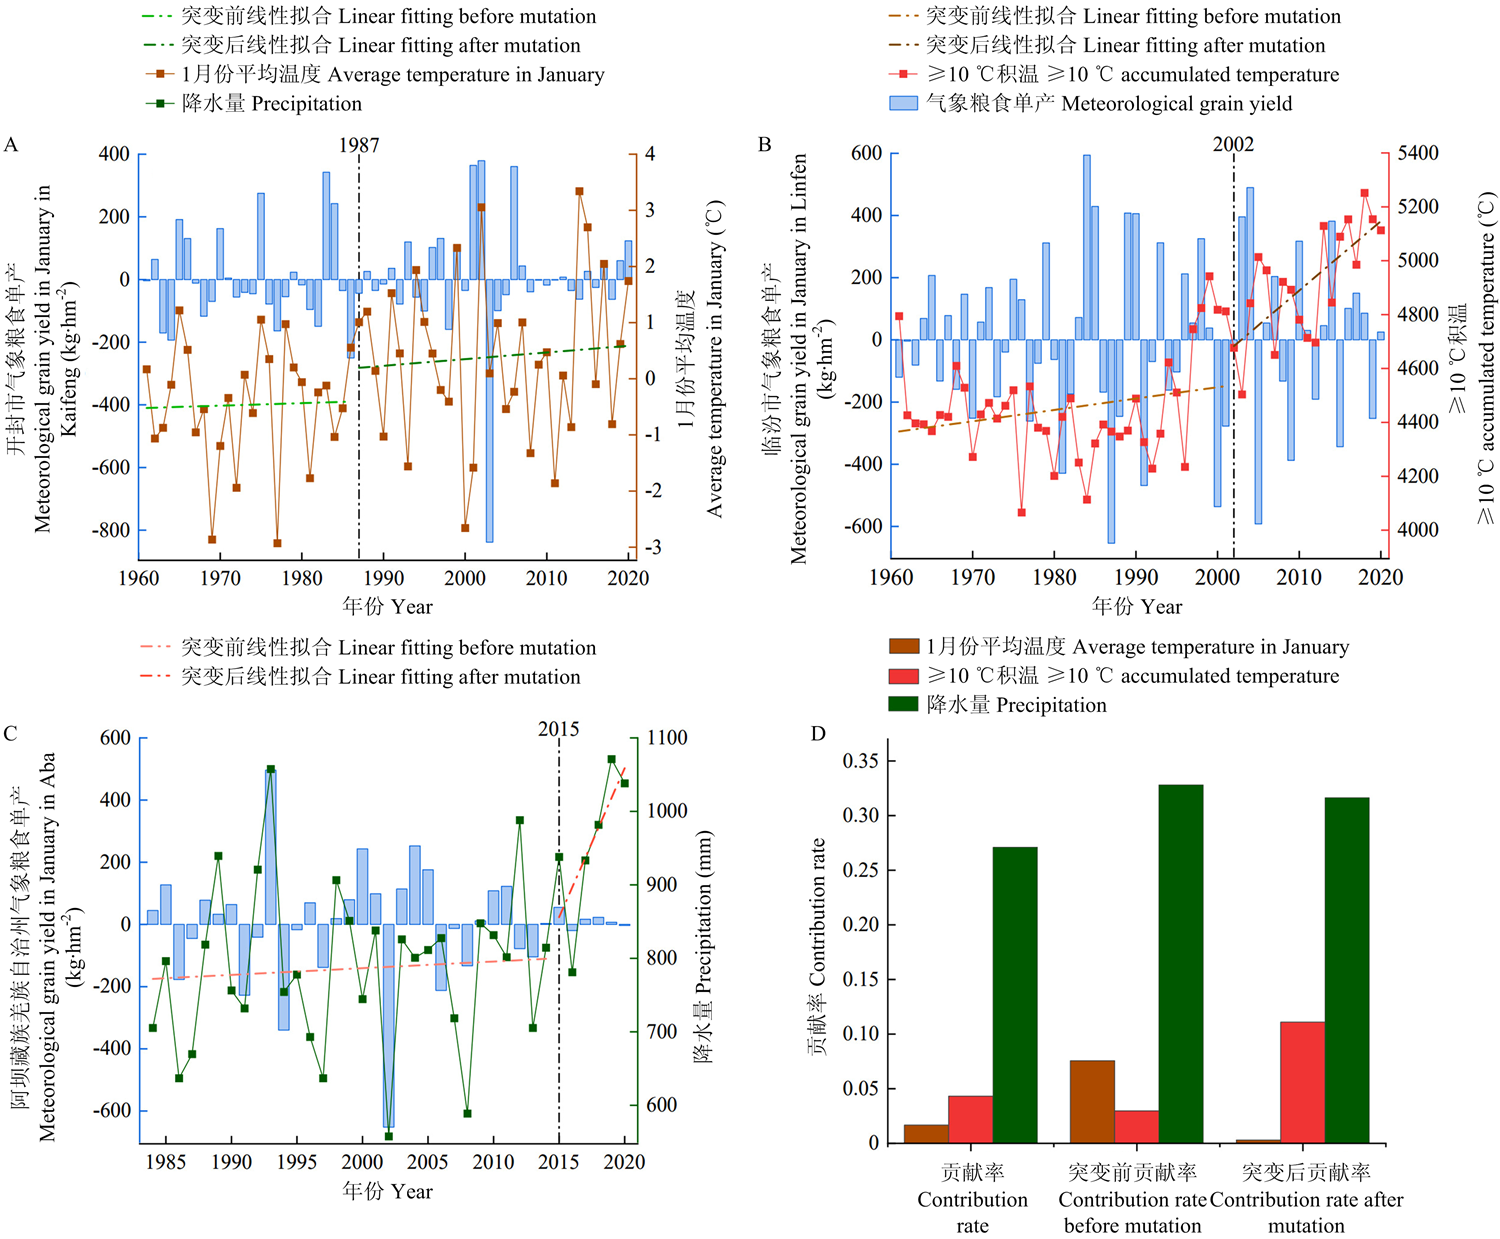
图8
气象粮食单产、气象因子变化趋势和气象因子贡献率 A:开封市气象粮食单产和1月份平均温度变化趋势;B:临汾市气象粮食单产和≥10 ℃积温变化趋势;C:阿坝藏族羌族自治州气象粮食单产和降水量变化趋势;D:气象因子对粮食单产贡献率"
| [1] |
IPCC. Climate Change 2021:The Physical Science Basis. Cambridge, Cambridge University Press, 2021.
|
| [2] |
doi: S0301-4797(18)31135-6 pmid: 30388650 |
| [3] |
doi: 10.1016/j.agsy.2019.102767 |
| [4] |
郭佳, 张宝林, 高聚林, 彭健, 罗瑞林. 气候变化对中国农业气候资源及农业生产影响的研究进展. 北方农业学报, 2019, 47(1): 105-113.
|
|
doi: 10.3969/j.issn.2096-1197.2019.01.18 |
|
| [5] |
徐上, 黄喆. 气候-生态突变对农业生产的影响. 科学与社会, 2024, 14(4): 30-42.
|
|
doi: 10.3390/socsci14010030 |
|
| [6] |
doi: 10.1016/j.agwat.2015.05.022 |
| [7] |
吕彤, 郭倩, 丁永霞, 彭守璋. 气候变化下中国小麦与玉米适生区研究. 兰州大学学报(自然科学版), 2022, 58(5): 588-599.
|
|
|
|
| [8] |
胡安顺. 云南气候与农作物网络建模及适生区分析[D]. 大理: 大理大学, 2024.
|
|
|
|
| [9] |
关凯心, 郭尔静, 高继卿, 张文梦, 张镇涛, 周丽涛, 郭世博, 杨晓光. 华北地区一年两熟种植模式智慧应对气候变化的水氮管理措施. 中国农业气象, 2023, 44(6): 453-468.
|
|
|
|
| [10] |
金文俊, 陈小飞, 陈金华, 韦志, 雷伟侠, 孔令聪, 杜祥备. 安徽稻油两熟制不同种植方式下气候资源配置和演变. 中国生态农业学报(中英文), 2024, 32(3): 436-445.
|
|
|
|
| [11] |
傅静, 胡振鹏, 李国文. 鄱阳湖流域水旱灾害对气候变化的响应. 水利水电技术(中英文), 2025, 56(11): 21-31.
|
|
|
|
| [12] |
费伟, 王莹, 吴吉东, 刘旭. 气候变化背景下的沿海城市台风灾害韧性研究进展. 灾害学, 2025, 40(2): 133-137.
|
|
|
|
| [13] |
申红艳, 温婷婷, 封国林, 李红梅, 乔少博, 段丽君. 中国冬季气温季节内变率特征及环流分析. 气象, 2021, 47(3): 327-336.
|
|
|
|
| [14] |
孙鹏飞, 曲哲, 张磊, 张礼宝, 吴岩, 谢玉静, 李兴权, 李瑶. 1961—2022年黑龙江省冬季气温特征及极寒天气分析. 冰川冻土, 2025, 47(1): 85-97.
doi: 10.7522/j.issn.1000-0240.2025.0007 |
|
doi: 10.7522/j.issn.1000-0240.2025.0007 |
|
| [15] |
崔婷, 王钧, 汪彦龙. 甘肃农牧交错带≥10℃积温时空变化特征. 甘肃农业大学学报, 2025, 60(5): 232-240.
|
|
|
|
| [16] |
李帅, 张勃, 马彬, 候启, 何航. 基于格点数据的中国1961—2016年≥5℃、≥10℃有效积温时空演变. 自然资源学报, 2020, 35(5): 1216-1227.
doi: 10.31497/zrzyxb.20200516 |
|
doi: 10.31497/zrzyxb.20200516 |
|
| [17] |
候启, 李帅, 赵玉洁, 崔广署. 气候变化对山西省有效积温时空演变的影响. 中国农学通报, 2023, 39(32): 138-144.
doi: 10.11924/j.issn.1000-6850.casb2022-0852 |
|
doi: 10.11924/j.issn.1000-6850.casb2022-0852 |
|
| [18] |
杨晓光, 刘志娟, 陈阜. 全球气候变暖对中国种植制度可能影响 Ⅰ.气候变暖对中国种植制度北界和粮食产量可能影响的分析. 中国农业科学, 2010, 43(2): 329-336. doi:10.3864/j.issn.0578-1752.2010.02.013.
|
|
|
|
| [19] |
郭政昇, 曹富强, 郑国璋. 2018年1月中国东部季风区降雪异常的特征及原因. 水文, 2020, 40(1): 81-85, 51.
|
|
|
|
| [20] |
段连强, 刘风华, 苏永军, 孔淑芹. 中国东部季风区降水δ18O与ENSO事件的关系. 灌溉排水学报, 2020, 39(9): 138-144.
|
|
|
|
| [21] |
彭艳玉, 郜倩倩, 刘煜. 厄尔尼诺对中国东部季风区夏季不同持续性降水的影响. 气象学报, 2023, 81(3): 375-392.
|
|
|
|
| [22] |
车彦军, 管小春, 王世金, 武荣. 中国东部季风区800 mm等降水量线的空间变化分析. 高原气象, 2020, 39(5): 997-1006.
doi: 10.7522/j.issn.1000-0534.2019.00094 |
|
doi: 10.7522/j.issn.1000-0534.2019.00094 |
|
| [23] |
河南省统计局. 河南统计年鉴. 北京: 中国统计出版社, 2021.
|
|
Statistic Bureau of Henan. Henan Statistical Yearbook. Beijing: China Statistics Press, 2021. (in Chinese)
|
|
| [24] |
开封市统计局. 开封七十年. 开封: 开封市统计局, 2020.
|
|
Statistic Bureau of Kaifeng. Seventy Years of Kaifeng. Kaifeng: Statistic Bureau of Kaifeng, 2020. (in Chinese)
|
|
| [25] |
临汾市统计局. 临汾统计年鉴. 北京: 中国统计出版社, 2021.
|
|
Statistic Bureau of Linfen. Linfen statistical yearbook. Beijing: China Statistics Press, 2021. (in Chinese)
|
|
| [26] |
四川省统计局. 四川统计年鉴. 北京: 中国统计出版社, 2021.
|
|
Statistic Bureau of Sichuan. Sichuan Statistical Yearbook. Beijing: China Statistics Press, 2021. (in Chinese)
|
|
| [27] |
胡亚飞, 包光, 王红桃. 榆林市1951—2012年气温变化特征. 地球环境学报, 2017, 8(2): 127-136.
|
|
|
|
| [28] |
耿婷, 付伟, 陈群, 侯雯嘉, 陈长青. 近20年河南省冬小麦生育期气候资源的时空变化及其适应性研究. 麦类作物学报, 2013, 33(4): 652-661.
|
|
|
|
| [29] |
张新刚. 气候变暖对豫北地区冬小麦生长发育和产量的影响: 以河南省沁阳市为例. 中国农学通报, 2025, 41(3): 98-106.
doi: 10.11924/j.issn.1000-6850.casb2024-0264 |
|
doi: 10.11924/j.issn.1000-6850.casb2024-0264 |
|
| [30] |
杨扬, 常伟, 张兴东. 新疆极端气候时空变化及其与棉花生产关联研究. 中国农业资源与区划, 2024, 45(12): 60-74.
|
|
|
|
| [31] |
珠杰桑布, 张存杰, 扎西普尺, 白玛德吉, 尼玛拉姆, 平措次旺. 西藏粮食主产区1980—2021年干湿气候变化特征及主要影响因子分析. 中国农学通报, 2023, 39(28): 75-82.
doi: 10.11924/j.issn.1000-6850.casb2022-0813 |
|
doi: 10.11924/j.issn.1000-6850.casb2022-0813 |
|
| [32] |
孙婉怡, 祝从文. 东亚副热带季风季节循环年际变化对华北夏季降水的影响. 大气科学, 2023, 47(5): 1466-1480.
|
|
|
|
| [33] |
王静爱, 左伟. 中国地理图集. 北京: 中国地图出版社, 2010: 27.
|
|
|
|
| [34] |
宁晓菊, 秦耀辰, 崔耀平, 李旭, 陈友民. 60年来中国农业水热气候条件的时空变化. 地理学报, 2015, 70(3): 364-379.
doi: 10.11821/dlxb201503002 |
|
doi: 10.11821/dlxb201503002 |
|
| [35] |
李亚男, 刘钢军, 刘德新, 秦耀辰. 中国南北过渡带范围的地理表达及定量探测. 地理研究, 2021, 40(7): 1857-1869.
doi: 10.11821/dlyj020200679 |
|
|
|
| [36] |
林冰, 陈立, 陈华忠, 张杰. 南亚高压年代际规律与青藏高原热力特征关系. 第35届中国气象学会年会S3高原天气气候研究进展, 2018: 111-124.
|
|
|
|
| [37] |
吕丽华, 吴立勇, 李谦, 刘朝芳, 姚艳荣, 贾秀领. 播期对小麦产量形成及株型结构的影响. 华北农学报, 2024, 39(S1): 53-62.
doi: 10.7668/hbnxb.20193629 |
|
doi: 10.7668/hbnxb.20193629 |
|
| [38] |
司学刚, 葛昌斌, 朱耀华, 蒋亚琴. 暖冬对漯河市小麦生产的影响. 现代农业科技, 2023(18): 55-57.
|
|
|
|
| [39] |
江新胜, 刘宝珺. 中国全球变化趋势与南水北调西线工程的全球变化风险. 矿物岩石, 2014, 34(4): 108-115.
|
|
|
|
| [40] |
doi: 10.1016/j.apgeog.2025.103561 |
| [41] |
doi: 10.1111/gcb.12684 pmid: 25044728 |
| [42] |
江梦圆. 长江中下游早、中稻高温热害灾变解析及风险预估研究[D]. 南京: 南京信息工程大学, 2024.
|
|
|
|
| [43] |
霍治国, 尚莹, 邬定荣, 吴立, 范雨娴, 王培娟, 杨建莹, 王纯枝. 中国小麦干热风灾害研究进展. 应用气象学报, 2019, 30(2): 129-141.
|
|
|
|
| [44] |
阮新民, 陈曦, 岳伟, 占新春, 从夕汉, 杜弘杨, 施伏芝, 罗志祥. 气候变化对安徽省两熟制粮食作物物候期及周年气候资源分配与利用的影响. 中国生态农业学报(中英文), 2021, 29(2): 355-365.
|
|
|
|
| [45] |
李乐乐, 李浩杰, 赵德一, 钞锦龙, 杨朔, 康利军. 北方地区1957—2016年400 mm等降水量线的空间演变及诱因. 甘肃科技, 2022, 38(23): 27-31.
|
|
|
|
| [46] |
吴浩, 颜鹏程, 侯威, 赵俊虎, 封国林. 近百年及未来百年PDO位相年代际转变检测及其早期预警信号研究. 大气科学, 2022, 46(2): 225-236.
|
|
|
|
| [47] |
张新科, 李强, 何跃, 许伟. 西南地区复杂地形对地闪与降水影响分析. 气象与环境科学, 2024, 47(5): 78-85.
|
|
|
|
| [48] |
李雪萍, 史兴民, 王阿如娜. 中国典型等降水量线年代际空间演变. 中国沙漠, 2016, 36(1): 232-238.
doi: 10.7522/j.issn.1000-694X.2015.00108 |
|
doi: 10.7522/j.issn.1000-694X.2015.00108 |
|
| [49] |
王进, 陈慈, 刘玥. 5种常用GIS插值方法计算面降水量对比分析. 水利科技, 2024(4): 9-14.
|
|
|
|
| [50] |
郭宏力. 近59年内蒙古乌兰察布市气候变化与农牧业的相关性分析. 农业灾害研究, 2024, 14(11): 153-155, 167.
|
|
|
|
| [51] |
侯奇奇, 杨柳, 张秀琼, 谢士娟, 冯文帅, 邹雨伽, 张玉芳. 基于GIS的水稻气象灾害风险评估: 以四川广元旺苍县为例. 西南大学学报(自然科学版), 2021, 43(5): 35-45.
|
|
|
| [1] | 崔士友, 陈澎军, 缪源卿, 韩继军, 沈俊明. EMS诱变抗草甘膦小麦新种质的创制与大田评价[J]. 中国农业科学, 2026, 59(4): 723-733. |
| [2] | 庄丽华, 罗磊, 赵春芳, 王纪忠, 张亚东, 赫磊. 水稻粒型突变体sgd13的鉴定及其基因定位[J]. 中国农业科学, 2025, 58(24): 5097-5109. |
| [3] | 王梦云, 邓力元, 余洋, 杨宇衡, 方安菲, 田斌年, 王静, 毕朝位. 稻瘟病菌琥珀酸脱氢酶不同位点氨基酸替换对苯并烯氟菌唑敏感性的影响[J]. 中国农业科学, 2025, 58(24): 5175-5189. |
| [4] | 梁雪, 姜艳, 危常州, 薛冰, 李芳芳, 崔怡蕊, 张夏然. 基于无人机遥感的玉米农田土壤水分诊断模型研究[J]. 中国农业科学, 2025, 58(23): 4979-4992. |
| [5] | 李艾雯, 成金礼, 陈丹, 陈鑫怡, 毛雅若, 李启权. 基于数据填补的四川盆地耕地表层土壤无机碳时空变化特征[J]. 中国农业科学, 2025, 58(14): 2838-2853. |
| [6] | 万云飞, 杨玉莹, 张乃心, 许萌萌, 于钦浩, 乔传玲, 陈化兰. 欧亚类禽H1N1猪流感病毒适应性突变氨基酸的鉴定及其功能分析[J]. 中国农业科学, 2025, 58(10): 2035-2044. |
| [7] | 张俊峰, 丁建成, 翁煜炜, 张雄. 基于地貌分区的湖北省粮食生产格局与耕地资源匹配关系研究[J]. 中国农业科学, 2024, 57(9): 1748-1765. |
| [8] | 杨启睿, 李岚涛, 张潇, 张倩, 张银杰, 张铎, 王宜伦. 施钾对夏花生产量、品质及光温生理特性的影响[J]. 中国农业科学, 2024, 57(7): 1335-1349. |
| [9] | 雷建峰, 尤扬子, 张锦恩, 代培红, 于莉, 杜正阳, 李月, 刘晓东. 靶向敲除棉花GhAGL16高效sgRNA的筛选[J]. 中国农业科学, 2024, 57(6): 1023-1033. |
| [10] | 党建友, 姜文超, 孙睿, 尚保华, 裴雪霞. 旱地小麦产量和水分利用对翻耕时间和降水量及其分布的响应[J]. 中国农业科学, 2024, 57(6): 1049-1065. |
| [11] | 姜亚楠, 亓方剑, 李维维, 陈巨莲, 谭晓玲. 温度升高通过小麦根际微生物加快禾谷缢管蚜和麦长管蚜的种群增长[J]. 中国农业科学, 2024, 57(20): 4045-4056. |
| [12] | 贾兵丽, 李艳行, 杨文杰, 于杰, 苑爱静, 李宁娜, 邱炜红, 王朝辉. 不同降水年型磷肥对旱地冬小麦产量及磷素吸收利用的影响[J]. 中国农业科学, 2024, 57(16): 3192-3206. |
| [13] | 徐亚楠, 陶怡, 叶淑珍, 徐春梅, 陈松, 褚光, 王丹英, 欧阳由男. 寒地粳稻在长江下游地区作双季早粳稻产量和品质表现分析[J]. 中国农业科学, 2024, 57(11): 2114-2124. |
| [14] | 张健, 赵彬森, 冯浩, 黄丽丽. Vm-milRN7调控苹果树腐烂病菌致病的功能及机理[J]. 中国农业科学, 2024, 57(10): 1930-1942. |
| [15] | 徐重新, 金嘉凤, 孙晓明, 沈成, 张霄, 陈澄宇, 刘贤金, 刘媛. 基于Bt毒素的杀虫蛋白理性设计与创新应用策略[J]. 中国农业科学, 2024, 57(1): 96-125. |
|
||
