


中国农业科学 ›› 2025, Vol. 58 ›› Issue (23): 4979-4992.doi: 10.3864/j.issn.0578-1752.2025.23.013
梁雪1( ), 姜艳1,*(), 危常州1, 薛冰2, 李芳芳1, 崔怡蕊1, 张夏然1
收稿日期:2024-12-09
接受日期:2025-04-15
出版日期:2025-12-01
发布日期:2025-12-09
通信作者:
联系方式:
梁雪,E-mail:1844823969@qq.com。
基金资助:
LIANG Xue1(), JIANG Yan1,*(), WEI ChangZhou1, XUE Bing2, LI FangFang1, CUI YiRui1, ZHANG XiaRan1
Received:2024-12-09
Accepted:2025-04-15
Published:2025-12-01
Online:2025-12-09
摘要:
【目的】 采用无人机遥感技术,构建快速、无损与准确监测玉米农田土壤水分的诊断模型,最大程度地提高农业用水的效率,为玉米的精准灌溉管理提供理论基础与科学依据。【方法】 以大田玉米为研究对象,通过田间小区试验设置4个水分处理,分别为低水分处理,灌水495 mm(W1);常规滴灌水量575 mm(对照,W2);高水分处理,灌水 660 mm(W3)和灌水740 mm(W4)。在玉米关键生育时期,同步测定玉米冠层温度(Tc)、空气温度(Ta)、土壤水分等信息,并结合K-Means法和统计技术提取并优化玉米Tc。同时,基于作物水分胁迫指数(CWSI)、Tc、Ta、冠气温差等指标构建水分-冠气温差指数(WCAI,CWSI与冠气温差之和)和水分-冠气相对温差指数(WRTI,CWSI与相对冠气温差之和),并筛选最优诊断模型明确土壤水分阈值。【结果】 Tc与土壤水分呈负相关关系。构建的模型WCAI不能很好地反映土壤水分变化趋势,而基于WRTI模型的土壤含水量预测值与实测值决定系数 R2均达到0.744以上,表明WRTI是诊断土壤水分效果较优的模型。通过比较WRTI在玉米不同生育时期与不同土层含水量的相关性可以发现,拔节期WRTI诊断0—20 cm土层含水量效果较优,R2为0.785和0.859;而大喇叭口期、抽穗期、灌浆期诊断0—40 cm土层含水量效果较优,R2范围为0.796—0.900。基于WRTI与玉米产量的相关关系得到各生育时期WRTI阈值范围为0.218—0.301,进一步根据WRTI与土壤含水量的关系反演出土壤水分阈值范围为67.8%—80.1%。【结论】 由于WCAI模型参数“冠气温差”受环境影响大,与WRTI和CWSI在不同水分处理下的变化趋势相比,WCAI与土壤水分没有明显关系,不适用于土壤水分诊断。而WRTI模型参数“相对冠气温差”削弱了环境的影响,其与CWSI结合可以更好的反映出土壤水分的变化,提高了基于遥感诊断农田土壤水分的精度,有效降低水资源的浪费,实现节水高产。研究结果为无人机遥感实时监测农田土壤水分和实施精准灌溉提供参考。
梁雪, 姜艳, 危常州, 薛冰, 李芳芳, 崔怡蕊, 张夏然. 基于无人机遥感的玉米农田土壤水分诊断模型研究[J]. 中国农业科学, 2025, 58(23): 4979-4992.
LIANG Xue, JIANG Yan, WEI ChangZhou, XUE Bing, LI FangFang, CUI YiRui, ZHANG XiaRan. Research on Soil Moisture Diagnosis Model of Maize Farmland Based on Remote Sensing of Unmanned Aerial Vehicles[J]. Scientia Agricultura Sinica, 2025, 58(23): 4979-4992.
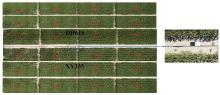
图1
试验区域布置图(左)和温度校准材料(右)"
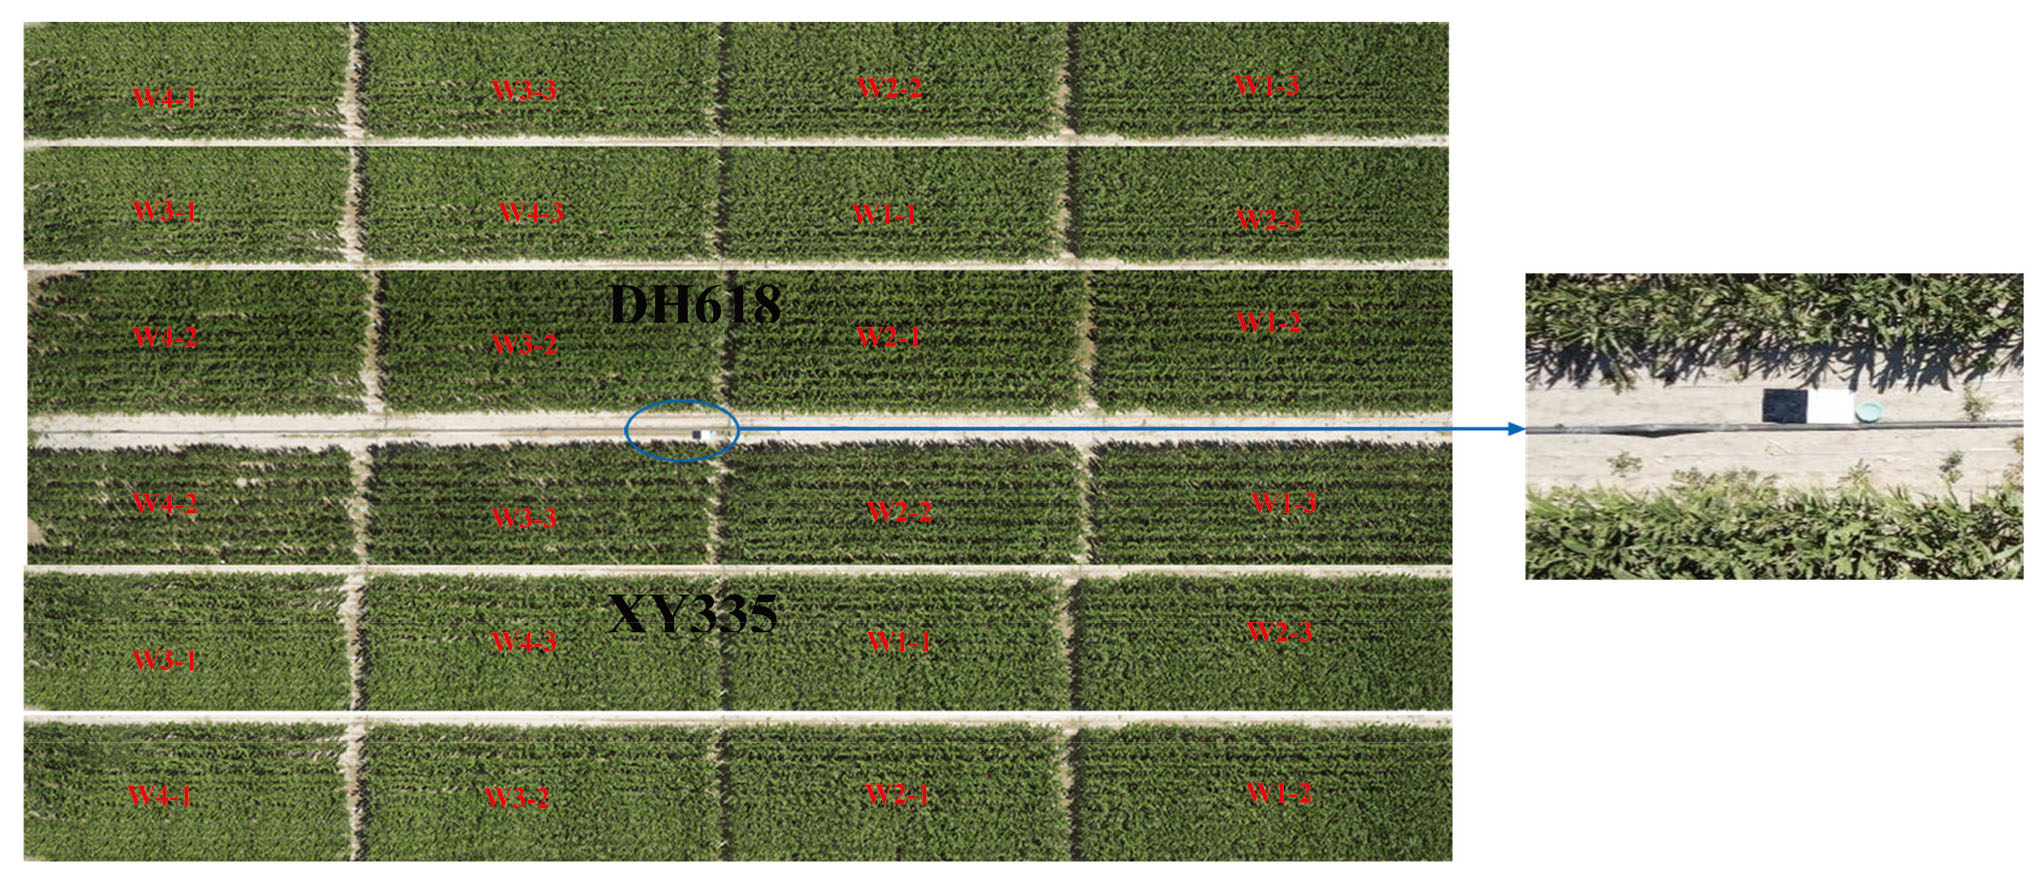
图2
温度转换与校准关系"
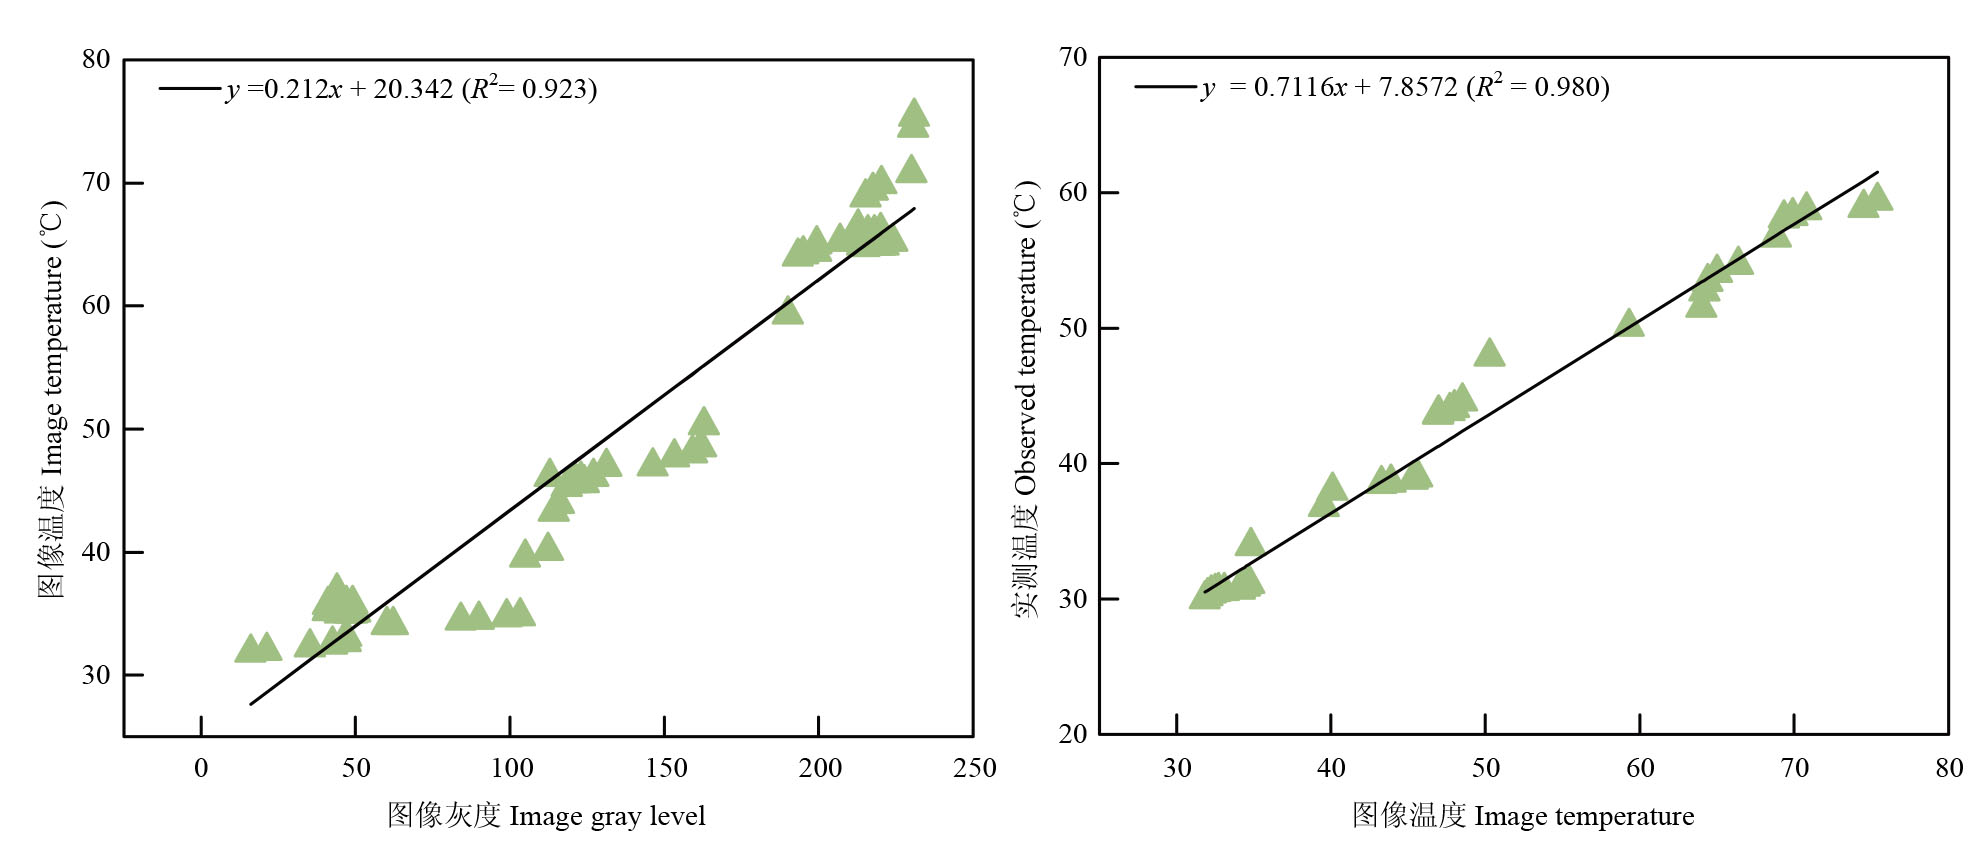

图3
冠层温度提取"
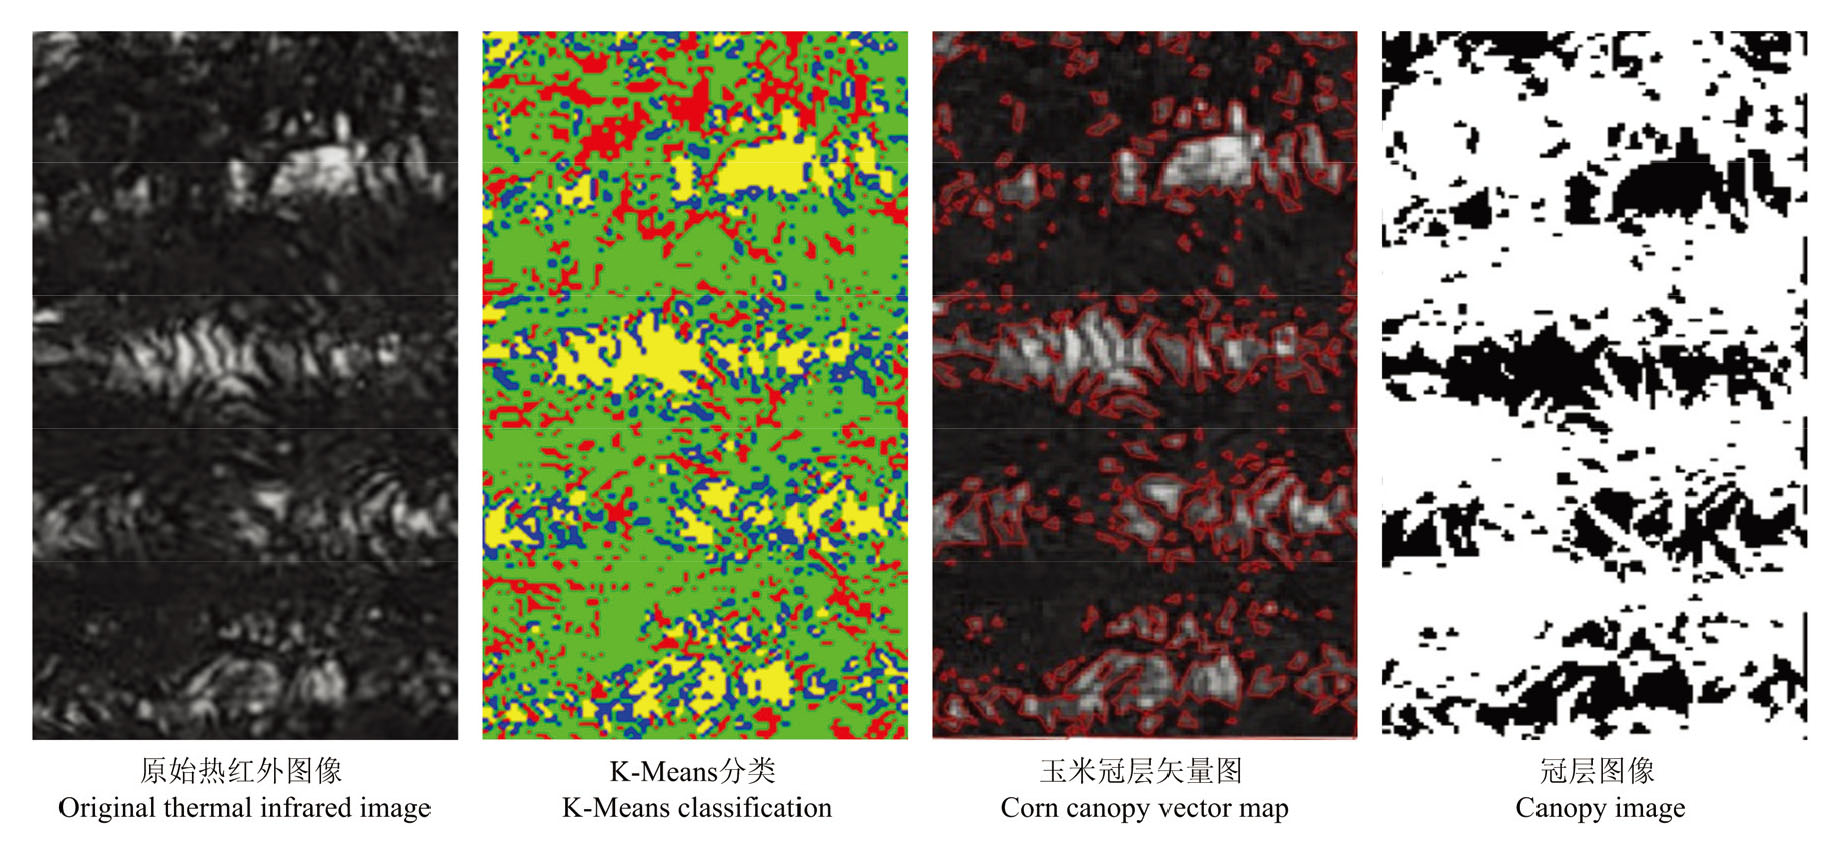
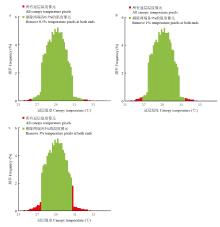
图4
冠层温度直方图"

图5
两个玉米品种在不同水分处理下各生育时期冠层温度变化"
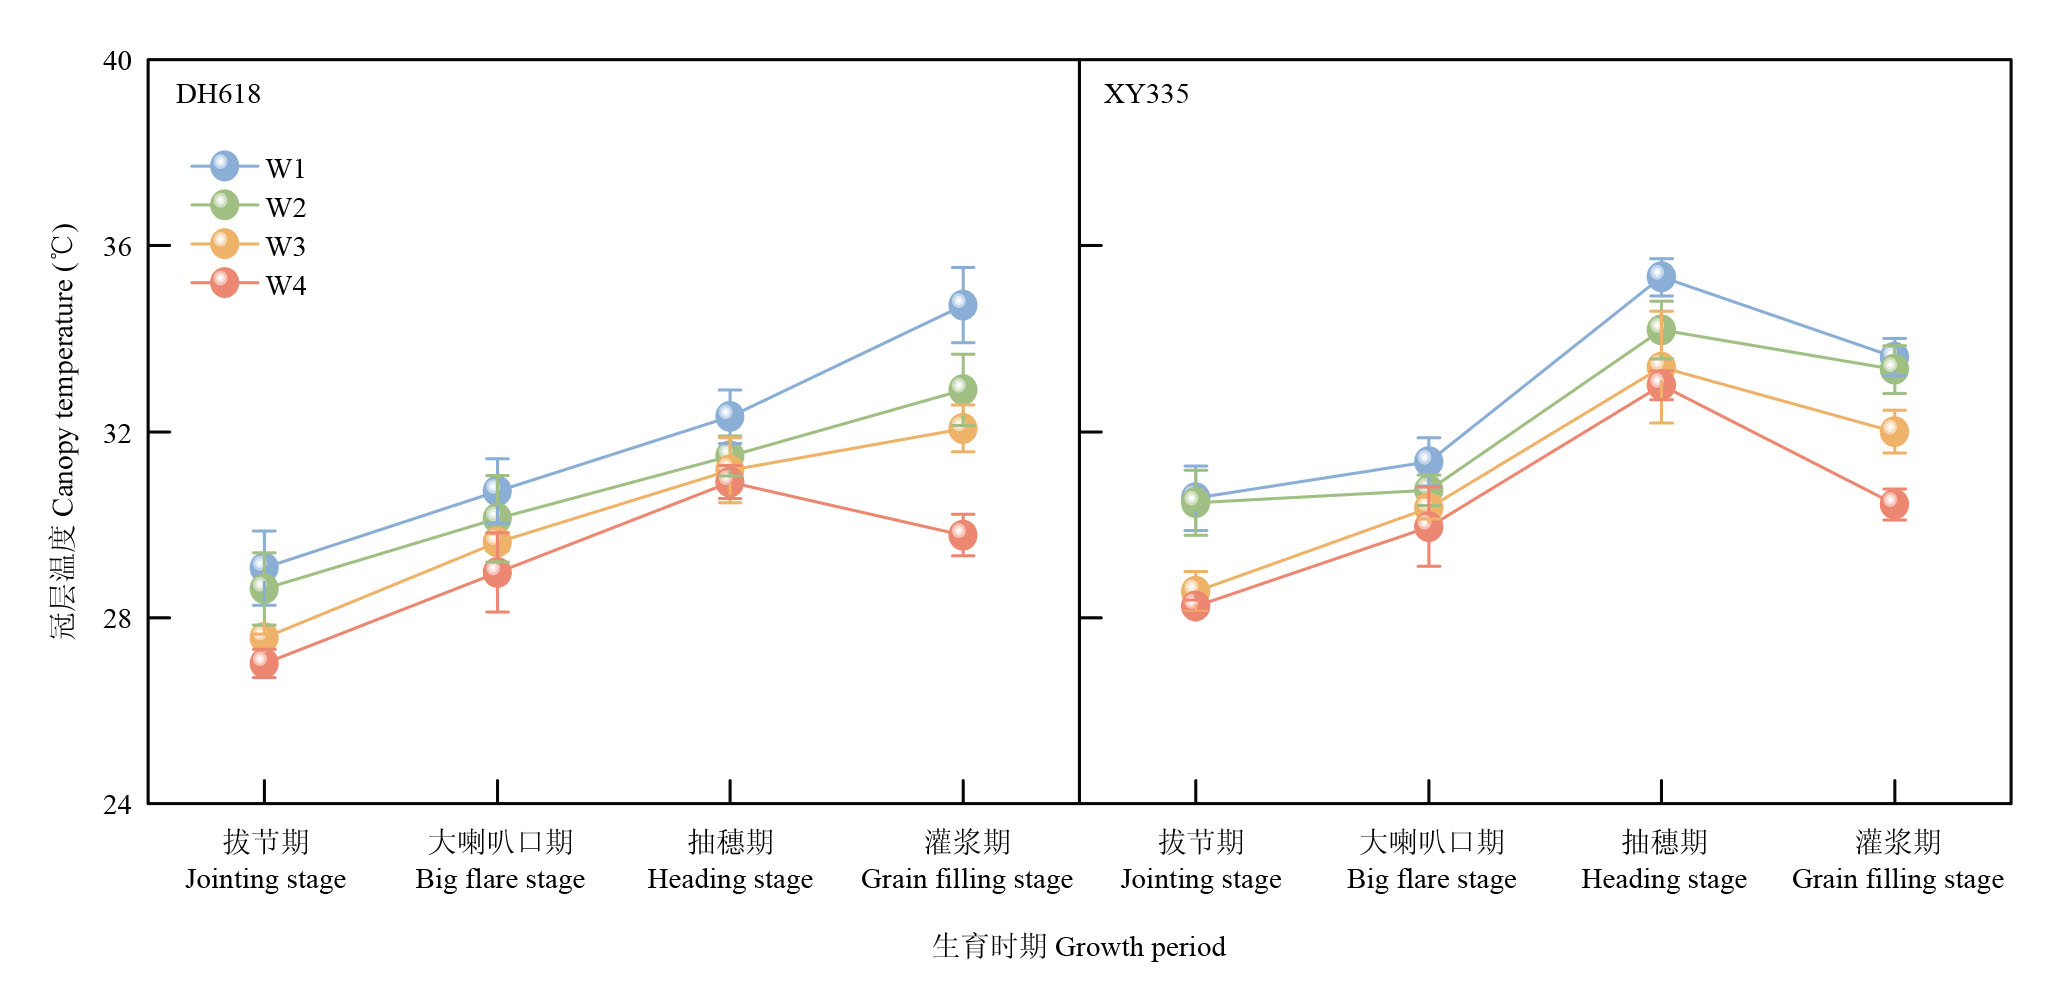
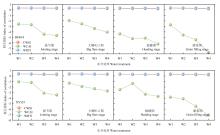
图6
CWSI、WCAI和 WRTI的变化趋势"
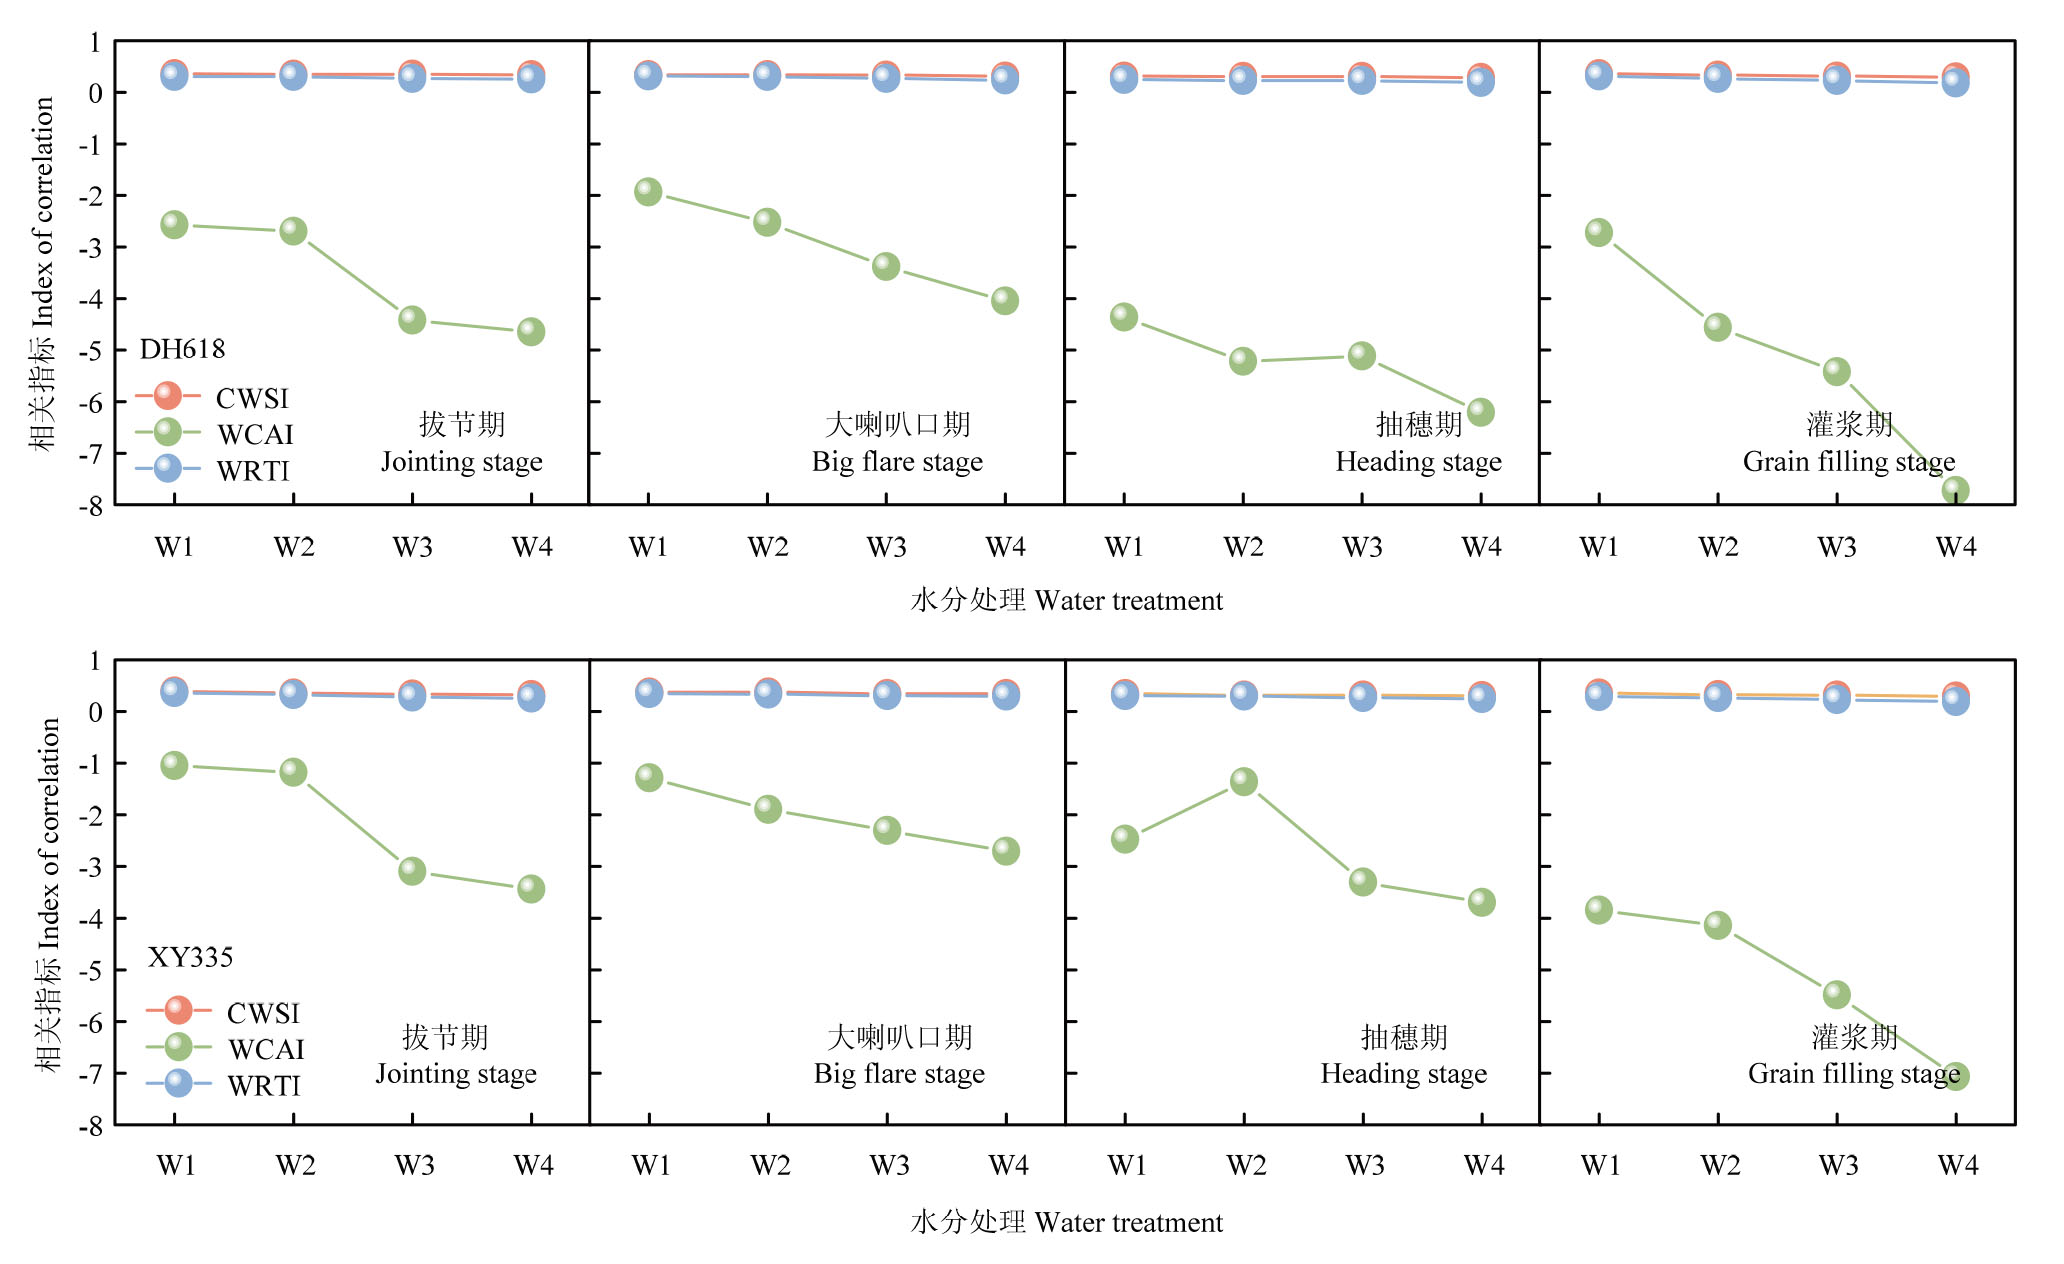
图7
登海618和先玉335的CWSI和WRTI与不同深度土壤含水量的相关性"
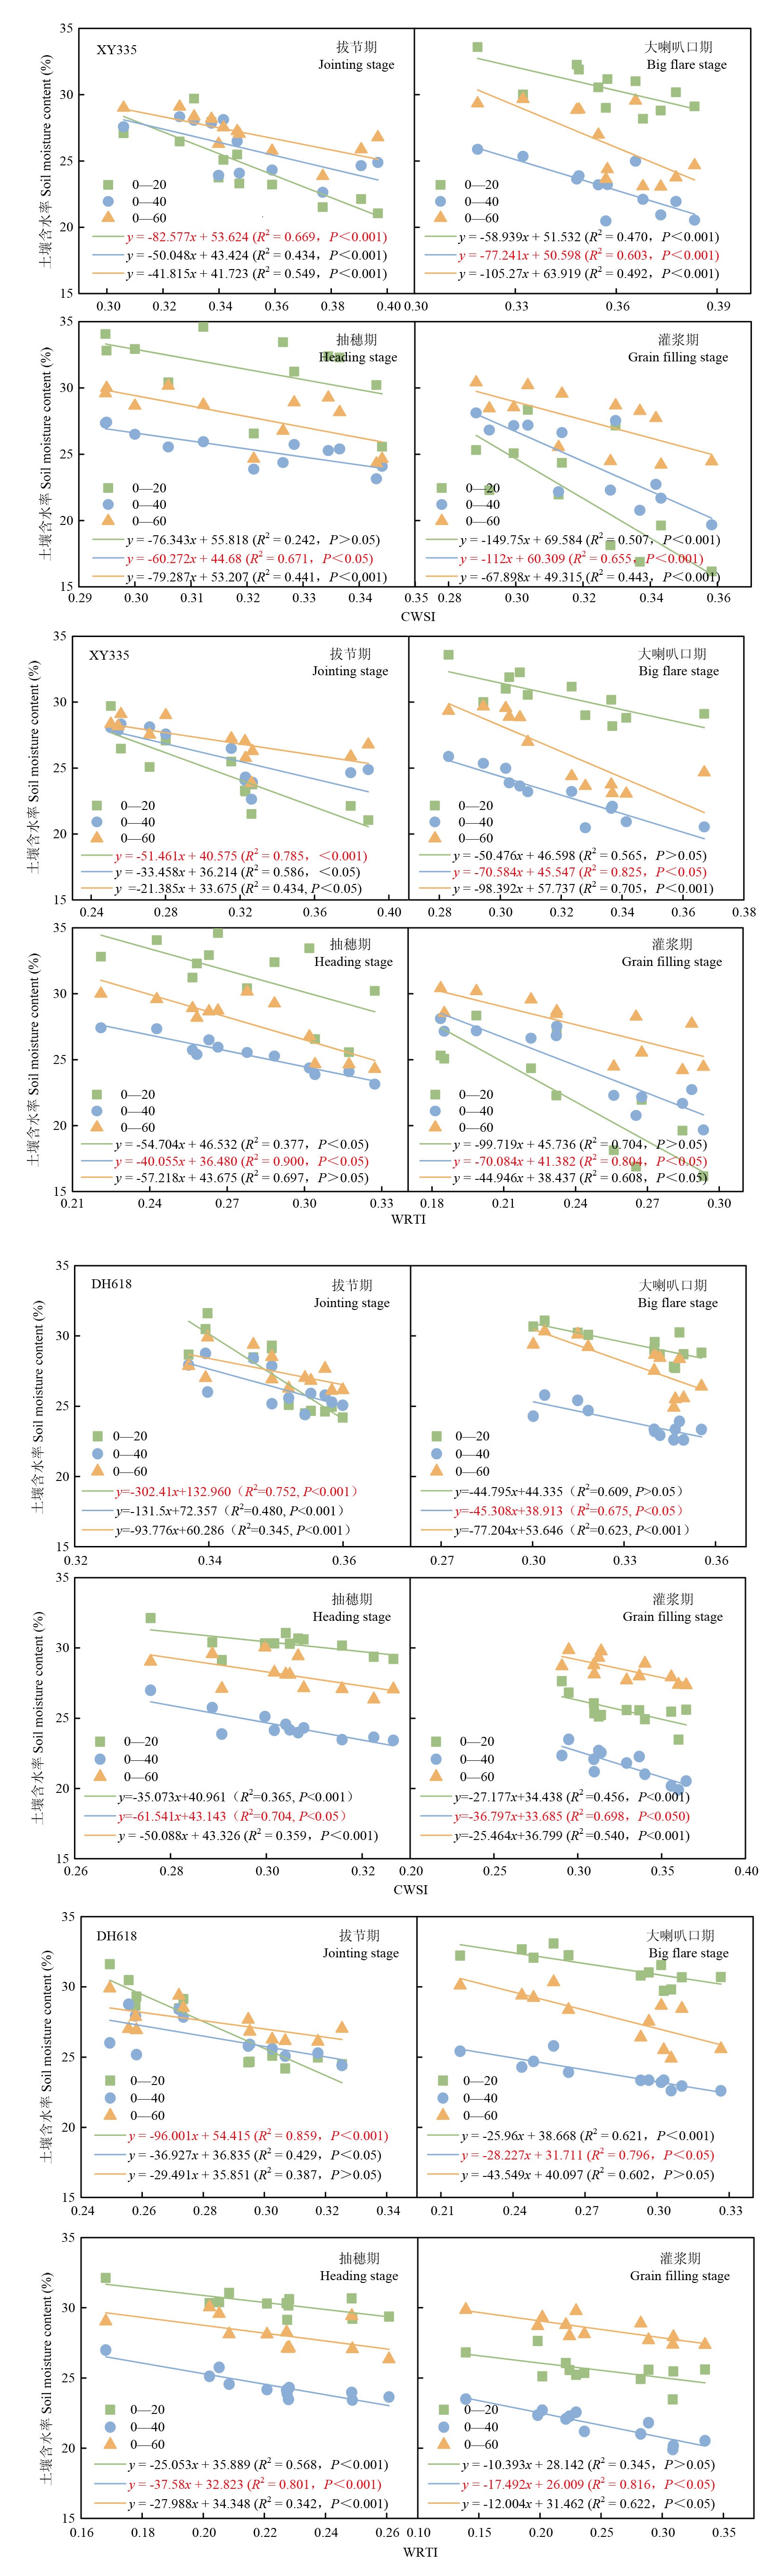
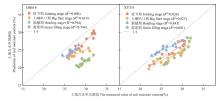
图8
WRTI对土壤含水量的预测效果验证"
图9
WRTI与玉米产量关系"
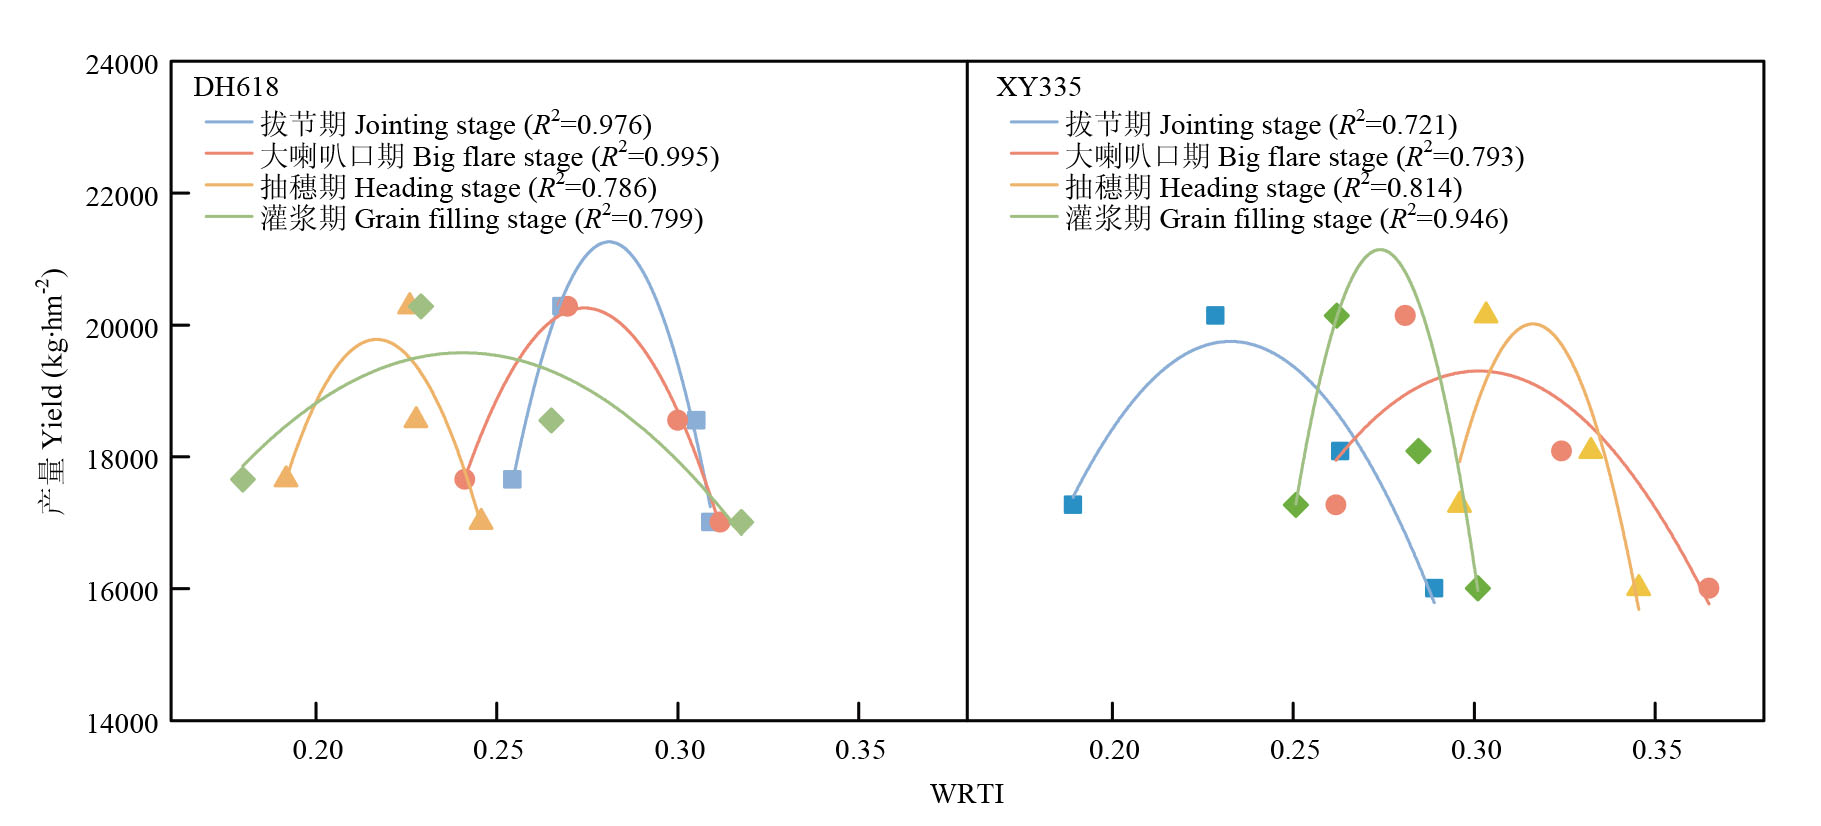
表1
玉米各生育时期土壤相对含水量阈值"
| 生育时期 Growth period | 登海618 DH618 | 先玉335 XY335 | ||
|---|---|---|---|---|
| WRTI阈值 WRTI threshold | 土壤相对含水量阈值 Threshold of soil relative water content (%) | WRTI阈值 WRTI threshold | 土壤相对含水量阈值 Threshold of soil relative water content (%) | |
| 拔节期 Jointing stage | 0.300 | 75.183 | 0.301 | 73.780 |
| 大喇叭口期 Big flare stage | 0.254 | 79.376 | 0.300 | 78.467 |
| 抽穗期 Heading stage | 0.218 | 79.058 | 0.250 | 80.052 |
| 灌浆期 Grain filling stage | 0.241 | 70.222 | 0.286 | 67.797 |
| [1] |
张晓斌, 冯俊杰, 刘杨, 韩启彪, 娄和, 王明. 灌溉流量自调节阀的结构设计与性能分析. 节水灌溉, 2020(6): 56-60.
|
|
|
|
| [2] |
doi: 10.1016/j.compag.2020.105441 |
| [3] |
doi: 10.1016/j.compag.2017.05.001 |
| [4] |
doi: 10.1117/1.JRS.11.026036 |
| [5] |
魏征, 许迪, 刘钰, 蔡甲冰. 基于冠气温差的冬小麦水分亏缺诊断试验研究. 水利学报, 2014, 45(8): 984-990.
|
|
|
|
| [6] |
doi: 10.1016/j.agwat.2008.04.017 |
| [7] |
doi: 10.3390/rs13224710 |
| [8] |
张旭东, 陈伟, 迟道才, 蔡亮. 水稻需水关键期冠气温差变化规律试验研究. 灌溉排水学报, 2011, 30(4): 80-83.
|
|
|
|
| [9] |
王纯枝, 宇振荣, 孙丹峰, 刘云, 刘云慧. 夏玉米冠气温差及其影响因素关系探析. 土壤通报, 2006, 37(4): 651-658.
|
|
|
|
| [10] |
doi: 10.1016/j.jag.2016.08.004 |
| [11] |
|
| [12] |
doi: 10.1016/j.agrformet.2022.109226 |
| [13] |
张吉立, 蒋雨洲, 王鹏. 作物冠层温度测定及其与水分关系研究. 青海农林科技, 2020(1): 77-80.
|
|
|
|
| [14] |
张智韬, 许崇豪, 谭丞轩, 李宇, 宁纪锋. 基于无人机热红外遥感的玉米地土壤含水率诊断方法. 农业机械学报, 2020, 51(3): 180-190.
|
|
|
|
| [15] |
汪玉莹. 不同水分条件下冬小麦-夏玉米基于冠气温差的蒸散量模型研究[D]. 保定: 河北农业大学, 2021.
|
|
|
|
| [16] |
蔡焕杰, 张振华, 柴红敏. 冠层温度定量诊断覆膜作物水分状况试验研究. 灌溉排水, 2001, 20(1): 1-4.
|
|
|
|
| [17] |
刘奇, 张智韬, 刘畅, 贾江栋, 黄嘉亮, 郭宇宏, 张秋雨. 基于无人机遥感的夏玉米水分胁迫指数改进方法. 农业工程学报, 2023, 39(2): 68-77.
|
|
|
|
| [18] |
doi: 10.3389/fpls.2019.01270 pmid: 31649715 |
| [19] |
doi: 10.3390/rs11030267 |
| [20] |
张智韬, 边江, 韩文霆, 付秋萍, 陈硕博, 崔婷. 剔除土壤背景的棉花水分胁迫无人机热红外遥感诊断. 农业机械学报, 2018, 49(10): 250-260.
|
|
|
|
| [21] |
陈科尹, 吴崇友, 关卓怀, 李海同, 王刚. 基于统计直方图k-means聚类的水稻冠层图像分割. 江苏农业学报, 2021, 37(6): 1425-1435.
|
|
|
|
| [22] |
doi: 10.1109/JSTARS.4609443 |
| [23] |
马晓丹, 刘梦, 关海鸥, 温冯睿, 刘刚. 基于热红外图像处理技术的农作物冠层识别方法研究. 光谱学与光谱分析, 2021, 41(1): 216-222.
|
|
|
|
| [24] |
赵叶萌, 刘晓英, 钟秀丽, 曹金峰, 任图生, 冯丹红. 基于产量响应诊断冬小麦水分亏缺适宜土层及其水分阈值. 农业工程学报, 2014, 30(20): 147-154.
|
|
|
|
| [25] |
doi: 10.1186/s13640-018-0322-6 |
| [26] |
doi: 10.1071/FP09123 pmid: 32688709 |
| [27] |
姚一飞, 王爽, 张珺锐, 黄小鱼, 陈策, 张智韬. 基于GF-1卫星遥感的河套灌区土壤含水率反演模型研究. 农业机械学报, 2022, 53(9): 239-251.
|
|
|
|
| [28] |
赵杰鹏, 张显峰, 廖春华, 包慧漪. 基于TVDI的大范围干旱区土壤水分遥感反演模型研究. 遥感技术与应用, 2011, 26(6): 742-750.
|
|
|
|
| [29] |
doi: 10.1016/j.agwat.2022.107674 |
| [30] |
杨宝城, 鲁向晖, 张海娜, 王倩, 陈志琪, 张杰. 基于无人机多光谱影像的矮林芳樟叶片含水率与叶水势反演. 农业机械学报, 2024, 55 (2): 220-230.
|
|
|
|
| [31] |
陈海波, 李就好, 余长洪, 张连宽. 基于茎直径变化的甘蔗水分亏缺诊断指标确定. 农业工程学报, 2014, 30(19): 115-122.
|
|
|
|
| [32] |
陈智芳, 宋妮, 王景雷, 孙景生. 基于高光谱遥感的冬小麦叶水势估算模型. 中国农业科学, 2017, 50(5): 871-880. doi: 10.3864/j.issn.0578-1752.2017.05.010.
|
|
|
|
| [33] |
高晨凯, 刘水苗, 李煜铭, 吴鹏年, 王艳丽, 刘长硕, 乔毅博, 关小康, 王同朝, 温鹏飞. 基于综合指标协同优化的冬小麦植株水分含量预测. 中国农业科学, 2023, 56(22): 4403-4416. doi: 10.3864/j.issn.0578-1752.2023.22.004.
|
|
|
|
| [34] |
彭世彰, 徐俊增, 丁加丽, 李道西. 节水灌溉条件下水稻叶气温差变化规律与水分亏缺诊断试验研究. 水利学报, 2006, 37(12): 1503-1508.
|
|
|
|
| [35] |
张文旭, 祝丹凤, 崔静, 宋江辉, 史晓艳, 王金刚, 杨明凤, 王海江. 基于无人机热成像的棉花根域土壤水分含量估测研究. 中国农业大学学报, 2024, 29(1): 40-52.
|
|
|
|
| [36] |
漆栋良, 胡田田, 吴雪, 牛晓丽. 适宜灌水施氮方式利于玉米根系生长提高产量. 农业工程学报, 2015, 31(11): 144-149.
|
|
|
|
| [37] |
周始威, 胡笑涛, 王文娥, 张亚军. 春玉米不同生育期土壤湿润层深度调控的稳产节水效应. 农业工程学报, 2016, 32(21): 125-132.
|
|
|
|
| [38] |
doi: 10.1016/j.agwat.2021.107065 |
| [39] |
司昌亮, 尚学灵, 王旭立, 张生武, 于海荣. 基于回归分析的玉米膜下滴灌适宜土壤含水量及阈值研究. 吉林水利, 2021(1): 9-12, 44.
|
|
|
|
| [40] |
常浩, 洪明, 陈志卿, 兰茜, 高瑞. 土壤水分上下限对北疆滴灌春玉米产量和品质的影响. 水资源与水工程学报, 2023, 34(1): 207-215.
|
|
|
| [1] | 韦文华, 李盼, 邵冠贵, 樊志龙, 胡发龙, 范虹, 何蔚, 柴强, 殷文, 赵连豪. 西北灌区青贮玉米产量及品质对减量灌水与有机无机肥配施的响应[J]. 中国农业科学, 2025, 58(8): 1521-1534. |
| [2] | 薛钰琦, 赵继玉, 孙旺胜, 任佰朝, 赵斌, 刘鹏, 张吉旺. 不同氮素形态对夏玉米产量和品质的影响[J]. 中国农业科学, 2025, 58(8): 1535-1549. |
| [3] | 陈桂平, 李盼, 邵冠贵, 吴霞玉, 殷文, 赵连豪, 樊志龙, 胡发龙. 减量灌水与有机无机肥配施对青贮玉米吐丝期后叶片持绿特性的调控作用[J]. 中国农业科学, 2025, 58(7): 1381-1396. |
| [4] | 岳润清, 李文兰, 丁照华, 孟昭东. 转基因复合抗虫耐除草剂玉米LD05的分子特征及抗性评价[J]. 中国农业科学, 2025, 58(7): 1269-1283. |
| [5] | 赵耀, 程前, 徐田军, 刘正, 王荣焕, 赵久然, 陆大雷, 李从锋. 高密度条件下株型改良对春玉米根-冠特征及籽粒产量的影响[J]. 中国农业科学, 2025, 58(7): 1296-1310. |
| [6] | 邹晓威, 夏蕾, 朱晓敏, 孙辉, 周琦, 齐霁, 张亚封, 郑岩, 姜兆远. 基于转录组测序的玉米瘤黑粉菌UM01240过表达菌株诱导玉米抗病性分析[J]. 中国农业科学, 2025, 58(6): 1116-1130. |
| [7] | 赵彤彤, 谷晓博, 谭川东, 延廷霖, 李晓雁, 常甜, 杜娅丹. 水氮耦合对西北旱区覆膜农田土壤有机碳、氮矿化的影响[J]. 中国农业科学, 2025, 58(5): 929-942. |
| [8] | 周广飞, 马亮, 马璐, 张舒钰, 章慧敏, 宋旭东, 张振良, 陆虎华, 郝德荣, 冒宇翔, 薛林, 陈国清. 玉米苞叶性状全基因组关联分析[J]. 中国农业科学, 2025, 58(3): 431-442. |
| [9] | 王佳芯, 胡静一, 张巍, 魏骞, 王涛, 王小林, 张雄, 张盼盼. 覆膜方式对间作玉米光合物质生产及水分利用效率的影响[J]. 中国农业科学, 2025, 58(3): 460-477. |
| [10] | 张方方, 宋启龙, 高娜, 白炬, 李阳, 岳善超, 李世清. 长期覆盖对黄土高原春玉米产量、土壤碳氮组分和碳氮库相关指数的影响[J]. 中国农业科学, 2025, 58(3): 507-519. |
| [11] | 房健, 秦召纪, 于园园, 于宁宁, 赵斌, 刘鹏, 任佰朝, 张吉旺. 大豆玉米带状间作下不同行比配置对作物个体和群体产量及效益的影响[J]. 中国农业科学, 2025, 58(23): 4841-4857. |
| [12] | 宋旭辉, 赵雪盈, 赵斌, 任佰朝, 张吉旺, 刘鹏, 任昊. 行比配置对玉米大豆带状复合种植系统冠层光合特性及产量形成的影响[J]. 中国农业科学, 2025, 58(23): 4858-4871. |
| [13] | 石德杨, 高春华, 李艳红, 赵海军, 夏德君. 行距配置对间作玉米冠层特性及产量的影响[J]. 中国农业科学, 2025, 58(23): 4872-4885. |
| [14] | 张梦雨, 何在菊, 王星星, 任昊, 任佰朝, 刘鹏, 张吉旺, 赵斌. 玉米大豆带状复合种植模式下不同株高玉米品种搭配对群体冠层光分布及玉米光合特性的影响[J]. 中国农业科学, 2025, 58(23): 4886-4904. |
| [15] | 孔玮琳, 高春华, 赵逢涛, 巨飞燕, 李宗新, 赵海军, 刘苹. 施氮量与播后滴灌量对玉米大豆带状复合种植系统产量、经济效益及水分利用特性的影响[J]. 中国农业科学, 2025, 58(23): 4905-4919. |
|
||