


中国农业科学 ›› 2025, Vol. 58 ›› Issue (19): 3946-3958.doi: 10.3864/j.issn.0578-1752.2025.19.011
刘若辰1,2( ), 张水勤2, 许猛2, 徐久凯2, 袁亮2, 高强1, 李燕婷2(), 赵秉强2()
收稿日期:2024-11-01
接受日期:2025-02-21
出版日期:2025-10-01
发布日期:2025-10-10
通信作者:
联系方式:
刘若辰,E-mail:liuruochen0003@163.com。
基金资助:
LIU RuoChen1,2(), ZHANG ShuiQin2, XU Meng2, XU JiuKai2, YUAN Liang2, GAO Qiang1, LI YanTing2(), ZHAO BingQiang2()
Received:2024-11-01
Accepted:2025-02-21
Published:2025-10-01
Online:2025-10-10
摘要:
【目的】对含腐殖酸增值磷酸二铵生产周期的碳足迹进行核算评估与研究分析,以期为增值肥料碳足迹研究提供科学依据和理论支撑。【方法】将产品工业生产过程(从“摇篮”到“大门”)定义为产品生产周期,基于生命周期法采用PAS 2050标准对磷酸二铵和含腐殖酸增值磷酸二铵产品生产周期的碳足迹进行核算研究和评估分析。【结果】(1)以纯养分(P2O5)量计,普通磷酸二铵和含腐殖酸增值磷酸二铵产品生产周期的碳足迹分别为3 636.73和3 653.16 kg CO2-eq·t-1,含腐殖酸增值磷酸二铵较普通磷酸二铵碳排放仅增加0.45%;以实物量(1 t 肥料产品)计,普通磷酸二铵和含腐殖酸增值磷酸二铵产品生产周期的碳足迹分别为1 672.90和1 660.38 kg CO2-eq·t-1,含腐殖酸增值磷酸二铵较普通磷酸二铵碳排放则降低了0.75%。二者碳足迹的差异只与腐殖酸增效剂的添加量相关。(2)合成氨碳足迹分别占磷酸二铵和含腐殖酸增值磷酸二铵产品生产周期碳足迹的67.87%和67.57%,是两种磷肥碳足迹的最大贡献者,而由添加腐殖酸增效剂所增加的碳足迹仅占含腐殖酸增值磷酸二铵产品生产周期碳足迹的0.45%。【结论】添加腐殖酸增效剂对磷酸二铵产品生产的碳排放影响很小,合成氨是磷酸二铵肥料产品生产周期碳足迹高低的最大影响因素。
刘若辰, 张水勤, 许猛, 徐久凯, 袁亮, 高强, 李燕婷, 赵秉强. 含腐殖酸增值磷酸二铵生产周期的碳足迹评估[J]. 中国农业科学, 2025, 58(19): 3946-3958.
LIU RuoChen, ZHANG ShuiQin, XU Meng, XU JiuKai, YUAN Liang, GAO Qiang, LI YanTing, ZHAO BingQiang. Carbon Footprint Assessment for the Production Cycle of Value- Added Diammonium Phosphate Containing Humic Acid[J]. Scientia Agricultura Sinica, 2025, 58(19): 3946-3958.
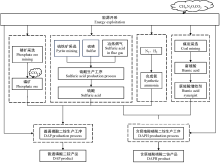
图1
普通磷酸二铵和含腐殖酸增值磷酸二铵生产周期碳足迹研究的系统边界划分"

表1
原料运输距离"
| 原料类型 Type of raw materials | 运输距离 Transport distance | 参考来源 Reference | ||
|---|---|---|---|---|
| 公路 Highway | 铁路 Railway | 海运 Ocean | ||
| 磷矿 Phosphate ore | 150 | — | — | 陈舜等[ |
| 硫铁矿 Pyrite | 600 | — | — | 陈舜等[ |
| 烟气硫酸 Flue-process sulfuric acid | 200 | — | - | 陈舜等[ |
| 进口硫磺 Imported sulfur | 9200 | — | 750 | 陈舜等[ |
| 国产硫磺 Domestic sulfur | 200 | — | — | 陈舜等[ |
| 腐殖酸 Humic acid | 4501) | — | — | 企业生产调研 Enterprise production survey |
| 腐殖酸增效剂Humic acid synergist, HAS | 15442) | 172 | — | 企业生产调研 Enterprise production survey |
表2
磷酸二铵及含腐殖酸增值磷酸二铵生产中涉及的碳排放系数"
| 项目Item | 数值Value | 单位Unit | 参考来源Reference |
|---|---|---|---|
| 合成氨生产的碳排放系数EFa | 6.13 | t CO2-eq·t-1N | 陈舜等[ |
| 原煤采选的碳排放系数EFcm1) | 0.2348 | t CO2-eq·t-1 | 崔夏瑜[ |
| 电力的单位tce碳排放系数TCEFe | 2.38 | t CE/tce | 陈舜等[ |
| 非电力能源的单位tce碳排放系数TCEFue | 0.81 | t CE/tce | 陈舜等[ |
| 蒸汽的单位tce碳排放系数TCEFs | 0.80 | t CE/tce | 陈舜等[ |
| 公路运输的碳排放系数UDEh | 0.092 | kg CO2-eq·t-1·km-1 | 吴雪妍等[ |
| 铁路运输的碳排放系数UDEr | 0.046 | kg CO2-eq·t-1·km-1 | 陈舜等[ |
| 海运的碳排放系数UDEo | 2.365 | g CO2-eq·t-1·km-1 | 陈舜等[ |
表3
式(1)—(10)中各代码释义"
| 代码 Code | 释义 Interpretation |
|---|---|
| CFDAP | 普通磷酸二铵生产周期的碳足迹Carbon footprint of the production cycle of DAP |
| UPsa | 硫酸的上游排放量Upstream emissions of sulfuric acid |
| UPpo | 磷矿石的上游排放量Upstream emissions of phosphate ore |
| UPa | 合成氨的上游排放量Upstream emissions of synthetic ammonia |
| CBpo | 磷矿石分解释放的CO2 Released CO2 by decomposition of phosphate rock |
| PEDAP | 普通磷酸二铵生产工序产生的碳排放Carbon emissions of DAP production process |
| CFDAPH | 含腐殖酸增值磷酸二铵生产周期的碳足迹Carbon footprint of the production cycle of DAPH |
| UPHAS | 腐殖酸增效剂的上游碳排放量Upstream emissions of HAS |
| PEDAPH | 含腐殖酸增值磷酸二铵生产工序的碳排放Carbon emissions of DAPH production process |
| MPsa | 硫酸的消耗量Sulfuric acid consumption |
| PEsa | 硫酸制造工序的碳排放量Carbon emissions of sulfuric acid manufacturing process |
| MPpy | 硫铁矿的加权用量Weighted consumption of pyrite |
| PEpy | 1 t硫铁矿的采选工序碳排放量Carbon emissions per ton pyrite mining process |
| TRpy | 硫铁矿运输过程的碳排放Carbon emissions of pyrite during the transportation |
| MPg | 烟气硫酸的加权用量Weighted consumption of sulfuric acid in flue gas |
| 98% | 硫酸浓度Sulfuric acid concentration |
| TRg | 烟气硫酸运输过程的碳排放Carbon emissions of sulfuric acid in flue gas during the transportation |
| MPsu | 硫磺的加权用量Weighted consumption of sulfur |
| TRsu | 硫磺运输过程的碳排放Carbon emissions of sulfur during the transportation |
| MPpo | 生产1 t 普通磷酸二铵或含腐殖酸增值磷酸二铵的磷矿消耗量Phosphate ore consumption per ton DAP or DAPH production |
| PEpo | 1 t磷矿石采选工序的碳排放Carbon emissions per ton phosphate ore mining process |
| TRpo | 1 t磷标矿运输的碳排放量Carbon emissions of phosphate ore during the transportation |
| MPa | 生产1 t 普通磷酸二铵或含腐殖酸增值磷酸二铵的合成氨消耗量Synthetic ammonia consumption per ton DAP or DAPH production |
| EFa | 合成氨生产的碳排放系数Carbon emissions factor of synthetic ammonia production |
| 5% | 磷矿石自身CO2含量CO2 content of phosphate ore |
| QuotaDAP | 普通磷酸二铵生产工序的能耗限额Limit value of energy consumption of DAP production process |
| EDAP | 普通磷酸二铵生产工序中电耗在综合能耗中所占的比例 The proportion of electricity consumption in the comprehensive energy consumption during the DAP production process |
| TCEFe | 电力的单位tce碳排放系数Carbon emissions factor per unit tce of electricity |
| TCEFne | 非电力能源的单位tce碳排放系数Carbon emissions factor per unit tce of non-electric energy |
| MPHAS | 生产1 t含腐殖酸增值磷酸二铵的腐殖酸增效剂用量HAS consumption per ton DAPH production |
| MPc | 生产1 t腐殖酸的煤炭用量Coal consumption per ton HA production |
| EFcm | 原煤采选的碳排放系数Carbon emissions factor of coal mining process |
| PEHA | 腐殖酸生产工序的碳排放量Carbon emissions of HA production process |
| TRHA | 腐殖酸运输过程的碳排放量Carbon emissions of HA during the transportation |
| MPHA | 生产1 t含腐殖酸增效剂消耗的腐殖酸用量HA consumption per ton HAS production |
| PEHAS | 腐殖酸增效剂生产工序的碳排放量Carbon emissions of HAS production process |
| TRHAS | 腐殖酸增效剂运输过程的碳排放量Carbon emissions of HAS during the transportation |
| PEa-s | 腐殖酸增效剂添加工序的碳排放Carbon emissions of HAS addition process |
| Di | 各材料运输距离Transport distance of each material |
| UDEi | 该运输方式的碳排放系数Carbon emissions factor of this transport mode |
表4
磷酸二铵与含腐殖酸增值磷酸二铵投入项目清单"
| 项目Item | 普通磷酸二铵 DAP (t P2O5) | 含腐殖酸增值磷酸二铵 DAPH (t P2O5) |
|---|---|---|
| 合成氨 Synthetic ammonia (t) | 0.40 | 0.40 |
| 磷矿 Phosphate ore (t) | 3.60 | 3.60 |
| 硫磺 Sulfur (t) | 0.46 | 0.46 |
| 硫铁矿 Pyrite (t) | 1.13 | 1.13 |
| 冶炼烟气 Flue-process sulfuric acid (t) | 0.52 | 0.52 |
| 能耗 Energy consumption (tce) | 0.25 | 0.25 |
| 电力 Electricity (kWh) | 223.76 | 228.42 |
| 风化煤 Coal (kg) | — | 27.08 |
表5
磷酸二铵生产周期的碳足迹及其组成"
| 生产阶段 Production phase | 矿石采选 Mining of ores | 原料/产品制造Manufacturing of raw materials/products | 运输 Transportation | 磷矿酸解 Phosphate ore decomposed with sulfuric acid | 总计 Total | 占比 Percent (%) |
|---|---|---|---|---|---|---|
| kg CO2-eq·t-1P2O5 | ||||||
| 磷矿石开采运输 Mining and transportation of phosphate ores | 176.06 | — | 49.68 | — | 225.74 | 6.21 |
| 硫酸生产 Production of sulfuric acid | 206.41 | -528.71 | 109.94 | — | -212.361) | -5.84 |
| 合成氨生产 Production of synthesis ammonia | — | 2468.292) | — | — | 2468.29 | 67.87 |
| 磷酸二铵制造工序 Production process of DAP | — | 975.06 | — | 180.00 | 1155.06 | 31.76 |
| 总计 Total | 382.47 | 2914.64 | 159.62 | 180.00 | 3636.73 | 100.00 |
| 占比 Percent (%) | 10.52 | 80.14 | 4.39 | 4.95 | 100.00 | — |
表6
腐殖酸增效剂生产的碳足迹及其组成"
| 生产阶段 Production phase | 矿石采选 Mining of coal | 原料/产品制造Manufacturing of raw materials/products | 运输 Transportation | 总计 Total | 占比 Percent (%) |
|---|---|---|---|---|---|
| kg CO2-eq·t-1 | |||||
| 腐殖酸生产运输 Production and transportation of humic acid | 243.72 | 29.15 | 12.42 | 285.29 | 99.06 |
| 腐殖酸增效剂生产工序 Production process of HAS | — | 2.70 | — | 2.70 | 0.94 |
| 总计 Total | 243.72 | 31.85 | 12.42 | 288.00 | 100.00 |
| 占比 Percent (%) | 84.63 | 11.06 | 4.31 | 100.00 | — |
表7
含腐殖酸增值磷酸二铵生产周期的碳足迹及其组成"
| 生产阶段 Production phase | 矿石采选 Mining of ores | 原料/产品制造 Manufacturing of raw materials/products | 运输 Transportation | 磷矿酸解 Phosphate ore decomposed with sulfuric acid | 总计 Total | 占比 Percent (%) |
|---|---|---|---|---|---|---|
| kg CO2-eq·t-1P2O5 | ||||||
| 磷矿石开采运输 Mining and transportation of phosphate ores | 176.06 | — | 49.68 | — | 225.74 | 6.18 |
| 硫酸生产 Production of sulfuric acid | 206.41 | -528.71 | 109.94 | — | -212.36 | -5.81 |
| 合成氨生产 Production of synthesis ammonia | — | 2468.29 | — | — | 2468.29 | 67.57 |
| 腐殖酸增效剂生产运输 Production and transportation of HAS | 7.12 | 0.07 | 4.24 | — | 11.43 | 0.31 |
| 含腐殖酸增值磷酸二铵制造工序 Production process of DAPH | — | 980.06 | — | 180.00 | 1160.06 | 31.76 |
| 总计 Total | 389.59 | 2919.72 | 163.86 | 180.00 | 3653.16 | 100.00 |
| 占比Percent (%) | 10.66 | 79.92 | 4.49 | 4.93 | 100 | — |
表8
磷酸二铵及含腐殖酸增值磷酸二铵产品生产周期碳足迹比较"
| 计量方法 Measurement method | 磷酸二铵 DAP | 含腐殖酸增值 磷酸二铵 DAPH | DAPH较DAP增排 DAPH increased the emissions compared with DAP | 增排比例 Increase proportion (%) |
|---|---|---|---|---|
| kg CO2-eq | ||||
| 以单位纯养分(P2O5)量计 Measured in unit of pure nutrient (P2O5) (t P2O5) | 3636.73 | 3653.16 | 16.43 | 0.45 |
| 以单位实物量计 Measured in unit of physical quantity (t) | 1672.90 | 1660.38 | -12.52 | -0.75 |
表9
磷酸二铵产品生产碳排放系数比较"
| 排放系数 Emissions factors(kg CO2-eq·t-1 P2O5) | 国家/地区 Country/region | 参考来源 Reference |
|---|---|---|
| 3636.73 | 中国China | 本文核算结果The accounting results of this article |
| 985 | 中国China | 徐晨等[ |
| 2891 | 中国China | BRENTRUP, et al[ |
| 4066 | 中国China | 陈舜等[ |
| 8978 | 中国China | ZHANG F F, et al[ |
| 1391 | 欧洲Europe | BRENTRUP, et al[ |
| 1587 | 美国America | BRENTRUP, et al[ |
| 1761 | 俄罗斯Russia | BRENTRUP, et al[ |
| [1] |
赵秉强, 袁亮, 李燕婷, 张水勤. 增值肥料概论. 北京: 中国农业科学技术出版社, 2020.
|
|
|
|
| [2] |
赵秉强, 袁亮. 我国绿色高效化肥产品创新与产业发展. 植物营养与肥料学报, 2023, 29(11): 2143-2149.
|
|
|
|
| [3] |
李志坚, 林治安, 赵秉强, 袁亮, 李燕婷, 温延臣. 增效磷肥对冬小麦产量和磷素利用率的影响. 植物营养与肥料学报, 2013, 19(6): 1329-1336.
|
|
|
|
| [4] |
李伟, 袁亮, 张水勤, 林治安, 李燕婷, 赵秉强. 中低分子量腐殖酸提高冬小麦磷吸收和产量的机理. 植物营养与肥料学报, 2020, 26(11): 2043-2050.
|
|
|
|
| [5] |
李军. 腐植酸对氮、磷肥增效减量效应研究[D]. 北京: 中国农业科学院, 2017.
|
|
|
|
| [6] |
周黔川, 刘敏敏, 张龙, 肖远航, 王春华, 任可帅, 林炜. “双碳” 目标下皮革产品碳足迹核算的研究与实践. 皮革科学与工程, 2024, 34(6): 40-46.
|
|
|
|
| [7] |
|
| [8] |
陈舜, 逯非, 王效科. 中国氮磷钾肥制造温室气体排放系数的估算. 生态学报, 2015, 35(19): 6371-6383.
|
|
|
|
| [9] |
|
| [10] |
|
| [11] |
江敬安, 陈丽, 沈兵, 张卫峰. 世界肥料产业发展趋势及展望. 现代化工, 2023, 43(1): 13-20.
doi: 10.16606/j.cnki.issn0253-4320.2023.01.002 |
|
|
|
| [12] |
|
| [13] |
徐晨, 张玲. 我国磷肥生产施用的全生命周期环境影响分析: 以磷酸二铵为例. 资源开发与市场, 2018, 34(9): 1262-1270.
|
|
|
|
| [14] |
郑秀兴, 白海丹, 冯尚善, 崔荣政, 王臣, 高永峰. 磷复肥产业碳排放现状及低碳绿色发展路径. 磷肥与复肥, 2022, 37(10): 1-7.
|
|
|
|
| [15] |
王莹, 方俊文, 高鹏. 2023年我国磷复肥行业运行情况及发展趋势. 生态产业科学与磷氟工程, 2024, 39(7): 1-8.
|
|
|
|
| [16] |
龚海青. 基于粮食作物磷需求的全链条磷高效利用途径探索[D]. 北京: 中国农业大学, 2022.
|
|
|
|
| [17] |
|
| [18] |
刘巽浩, 徐文修, 李增嘉, 褚庆全, 杨晓琳, 陈阜. 农田生态系统碳足迹法: 误区、改进与应用: 兼析中国集约农作碳效率(续). 中国农业资源与区划, 2014, 35(1): 1-7.
|
|
|
|
| [19] |
王微, 林剑艺, 崔胜辉, 吝涛. 碳足迹分析方法研究综述. 环境科学与技术, 2010, 33(7): 71-78.
|
|
|
|
| [20] |
石敏俊, 王妍, 张卓颖, 周新. 中国各省区碳足迹与碳排放空间转移. 地理学报, 2012, 67(10): 1327-1338.
|
|
doi: 10.11821/xb201210004 |
|
| [21] |
方恺. 足迹家族: 概念、类型、理论框架与整合模式. 生态学报, 2015, 35(6): 1647-1659.
|
|
|
|
| [22] |
童庆蒙, 沈雪, 张露, 张俊飚. 基于生命周期评价法的碳足迹核算体系: 国际标准与实践. 华中农业大学学报(社会科学版), 2018(1): 46-57, 158.
|
|
|
|
| [23] |
赵薇, 孙一桢, 张文宇, 梁赛. 基于生命周期方法的生活垃圾资源化利用系统生态效率分析. 生态学报, 2016, 36(22): 7208-7216.
|
|
|
|
| [24] |
闫明. 农业生产碳足迹及氮肥去向的计量研究[D]. 南京: 南京农业大学, 2015.
|
|
|
|
| [25] |
BSI. PAS 2050:2008. Specification for the Assessment of Life Cycle Greenhouse Gas Emissions of Goods and Services. British Standards Institute, London, UK, 2008.
|
| [26] |
廖康程, 杨曼. 2021年我国硫酸行业生产运行情况及发展趋势. 磷肥与复肥, 2022, 37(7): 1-8.
|
|
|
|
| [27] |
连文璞. 硫磺及下游行业发展趋势分析. 硫酸工业, 2009(4): 1-7.
|
|
|
|
| [28] |
崔夏瑜. 中国煤炭产业碳排放量测算. 能源与节能, 2022(5): 33-35, 73.
|
|
|
|
| [29] |
吴雪妍, 毛保华, 周琪, 黄俊生, 童瑞咏. 交通运输业不同方式碳排放因子水平比较研究. 华东交通大学学报, 2022, 39(4): 41-47.
|
|
|
|
| [30] |
doi: 10.15302/J-FASE-2022468 |
| [31] |
张晓彤. 基于生命周期评价的腐植酸增值尿素碳足迹研究[D]. 北京: 中国农业科学院, 2024.
|
|
|
|
| [32] |
|
| [33] |
马明坤, 袁亮, 李燕婷, 高强, 赵秉强. 不同磺化腐殖酸磷肥提高冬小麦产量和磷素吸收利用的效应研究. 植物营养与肥料学报, 2019, 25(3): 362-369.
|
|
|
|
| [34] |
袁亮, 赵秉强, 林治安, 温延臣, 李燕婷. 增值尿素对小麦产量、氮肥利用率及肥料氮在土壤剖面中分布的影响. 植物营养与肥料学报, 2014, 20(3): 620-628.
|
|
|
| [1] | 郑煜, 陈颐, 遆晋松, 史龙飞, 许校博, 李昱霖, 郭瑞. 烟草不同轮作模式碳足迹及经济效益评价[J]. 中国农业科学, 2025, 58(4): 733-747. |
| [2] | 王楚凡, 牛俊. 西北地区主要粮食作物种植的水、碳足迹及布局优化[J]. 中国农业科学, 2024, 57(6): 1137-1152. |
| [3] | 周元清, 董红敏, 朱志平, 王悦, 李南西. 生猪养殖系统碳足迹评估研究进展[J]. 中国农业科学, 2024, 57(2): 379-389. |
| [4] | 陈晓炜, 王小龙. 种养循环农作制度碳足迹评估—以鲜食玉米-奶牛-粪便还田循环模式为例[J]. 中国农业科学, 2023, 56(2): 314-332. |
| [5] | 李晓立,何堂庆,张晨曦,田明慧,吴梅,李潮海,杨青华,张学林. 等氮量条件下有机肥替代化肥对玉米农田温室气体排放的影响[J]. 中国农业科学, 2022, 55(5): 948-961. |
| [6] | 陈绪昊,高强,陈新平,张务帅. 东北三省玉米生产资源投入和环境效应的时空特征[J]. 中国农业科学, 2022, 55(16): 3170-3184. |
| [7] | 刘松, 王效琴, 胡继平, 李强, 崔利利, 段雪琴, 郭亮. 施肥与灌溉对甘肃省苜蓿碳足迹的影响[J]. 中国农业科学, 2018, 51(3): 556-565. |
| [8] | 黄文强,董红敏,朱志平,刘翀,陶秀萍,王悦. 畜禽产品碳足迹研究进展与分析[J]. 中国农业科学, 2015, 48(1): 93-111. |
| [9] | 王占彪,王猛,陈阜. 华北平原作物生产碳足迹分析[J]. 中国农业科学, 2015, 48(1): 83-92. |
|
||