


中国农业科学 ›› 2022, Vol. 55 ›› Issue (24): 4823-4839.doi: 10.3864/j.issn.0578-1752.2022.24.004
王淑婷1( ),孔雨光2,张赞3,陈红艳1(),刘鹏4
收稿日期:2022-01-17
接受日期:2022-06-06
出版日期:2022-12-16
发布日期:2023-01-04
联系方式:
王淑婷,E-mail:wstwang@163.com。
基金资助:
WANG ShuTing1(),KONG YuGuang2,ZHANG Zan3,CHEN HongYan1(),LIU Peng4
Received:2022-01-17
Accepted:2022-06-06
Published:2022-12-16
Online:2023-01-04
摘要:
【目的】为提高棉花叶片叶绿素含量的反演精度,并掌握其在山东省夏津县的空间分布特征。【方法】本研究以山东省德州市夏津县为研究区,以夏津县大李庄棉田为试验区,通过SPAD(soil and plant analyzer development,SPAD)仪实地测定试验区棉花叶片叶绿素含量的相对值(SPAD值),并获取同期试验区无人机(unmanned aerial vehicle,UAV)近地多光谱图像和研究区Sentinel-2A MSI(MSI)卫星影像;然后分别基于UAV和MSI的光谱反射率,构建并筛选最优光谱参量,采用多元线性回归(multiple linear regression,MLR)建立SPAD值定量反演模型;最后采用二次多项式拟合法融合UAV和Sentinel-2A MSI对应的最优光谱参量,对比分析融合前后模型效果,优选最佳反演模型,实现研究区SPAD值反演。【结果】研究表明,(REG-R)/(REG+R)、R/G、CL(red edge)、NDVI可作为SPAD值的最优光谱参量;基于UAV图像的定量反演模型精度优于基于MSI影像的模型;基于二次多项式拟合后建模R 2提高了0.015—0.057,RMSE降低了0.457—0.638,验证R 2提高了0.040—0.085,RMSE降低了0.387—0.397,RPD提高了0.020—0.139;将融合后的MSI光谱参量代入基于UAV图像的反演模型(Fused MSI-ModUAV),也可获得较高的反演精度,建模R 2达0.672,RMSE为3.982,验证R 2达0.713,RMSE为3.859,RPD为1.685;基于上述模型进行研究区棉花叶片SPAD值反演分析,试验区整体呈南高北低的分布趋势,研究区呈中间低、四周高的分布趋势,均与实地情况一致,具有较好的预测效果。【结论】采用二次多项式拟合法融合无人机和卫星影像数据,可较好地实现区域高精度作物生长指标的定量反演,研究结果可丰富多源遥感融合理论与技术,为后续棉花长势监测与精准生产提供技术参考和数据支持。
王淑婷, 孔雨光, 张赞, 陈红艳, 刘鹏. 基于星-机光谱融合的棉花叶片SPAD值反演[J]. 中国农业科学, 2022, 55(24): 4823-4839.
WANG ShuTing, KONG YuGuang, ZHANG Zan, CHEN HongYan, LIU Peng. SPAD Value Inversion of Cotton Leaves Based on Satellite-UAV Spectral Fusion[J]. Scientia Agricultura Sinica, 2022, 55(24): 4823-4839.

图1
研究区、试验区地理位置(a:山东省;b:研究区;c:试验区)"
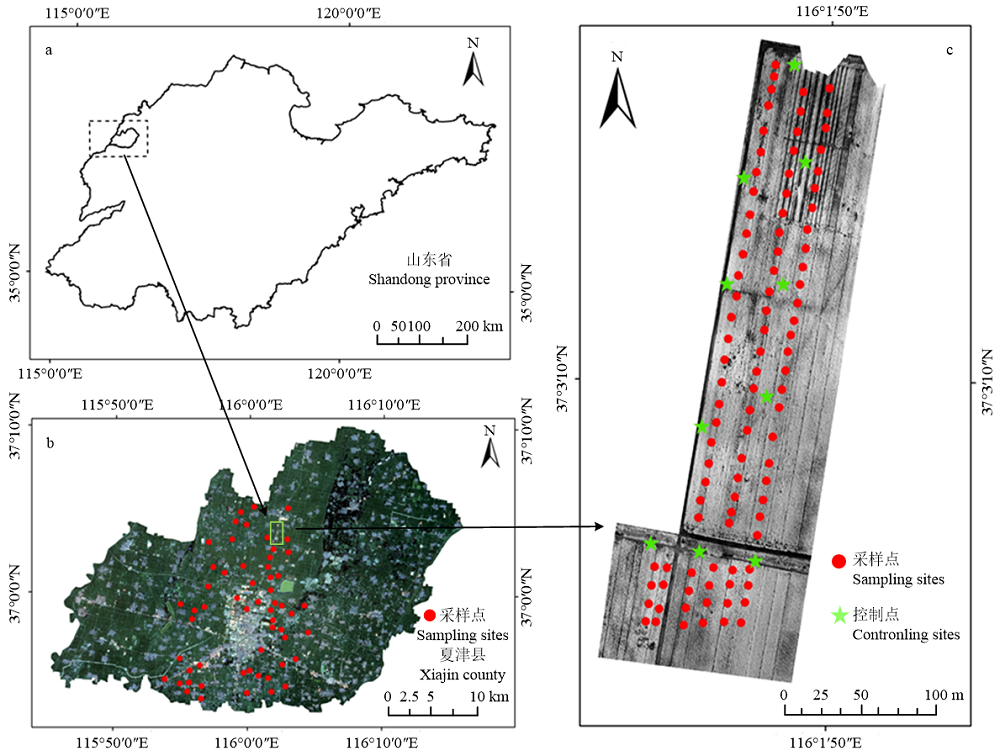
表1
UAV与Sentinal-2A MSI波段对应关系"
| 波段名称 Band name | 无人机 UAV | 卫星 Sentinel-2A MSI | ||||
|---|---|---|---|---|---|---|
| 波段 Band | 中心波长 Central wavelength (nm) | 带宽 Bandwidth (nm) | 波段 Band | 中心波长 Central wavelength (nm) | 带宽 Bandwidth (nm) | |
| G | Green | 550 | 40 | B3-Green | 560 | 45 |
| R | Red | 660 | 40 | B4-Red | 665 | 38 |
| REG | Red Edge | 735 | 10 | B6-Vegetation Red Edge | 740 | 18 |
| NIR | Near IR | 790 | 40 | B7- Vegetation Red Edge | 783 | 28 |
表2
光谱参量及其计算公式"
| 植被指数 Vegetation index | 名称 Name | 计算公式 Calculation formula | 参考文献 Reference |
|---|---|---|---|
| RVI | 比值植被指数 Ratio vegetation index | NIR/R | [ |
| DVI | 差值植被指数 Difference vegetation index | NIR-R | |
| GNDVI | 绿色归一化植被指数 Green normalized difference vegetation index | (NIR-G)/(NIR+R) | |
| NDRE | 红边植被指数 Normalized difference red edge | (NIR-REG)/(NIR+REG) | [ |
| CL(red edge) | 红边叶绿素指数Ⅱ Red edge chlorophyII index | REG/R-1 | [ |
| MCARI | 改进叶绿素吸收比值指数 Modified chlorophyII absorption ratio index | [(REG-R)-0.2×(REG-G)] ×(REG/R) | |
| TCARI | 转化叶绿素吸收比值指数 Transformed chlorophyII absorption ratio index | 3×[(REG-R)-0.2×(REG-G)×(REG/R)] | |
| OSAVI | 优化型土壤调节植被指数 Optimized soil adjusted vegetation index | 1.16×(NIR-R)/(NIR+R+0.16) | |
| NDVI | 归一化植被指数 Normalized difference vegetation index | (NIR-R)/(NIR+R) | |
| CIRE | 红边叶绿素指数Ⅰ Red edge chlorophyII index | NIR/REG-1 | [ |
| MSR | 改进简单比值植被指数 Modified simple ratio | (NIR/R-1)(NIR/R+1)0.5 | [ |
| RDVI | 重归一化植被指数 Renormalized difference vegetation index | (NIR-R)/(NIR+R)0.5 | |
| (REG-R)/(REG+R) | — | (REG-R)/(REG+R) | [ |
| R/G | — | R/G | |
| sqrt(R2+G^2) | — | sqrt(R^2+G^2) | |
| G×R | — | G×R | |
| G×R×REG | — | G×R×REG | |
| REG-R | — | REG-R | |
| REG-NIR | — | REG-NIR |
图2
技术路线图"
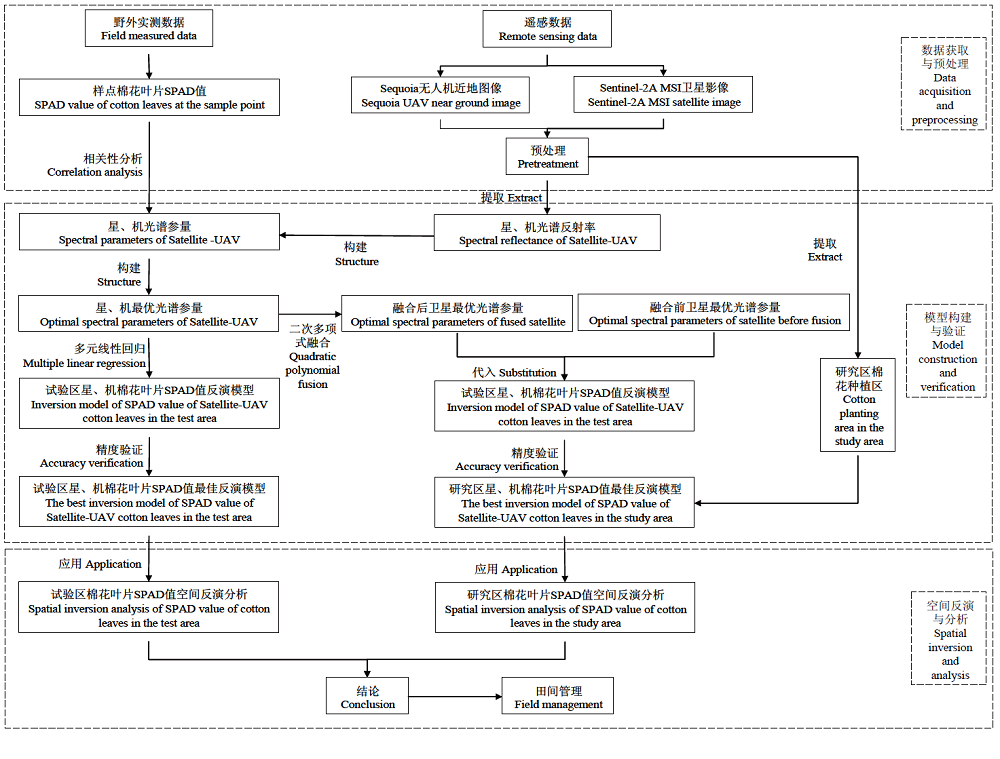
表3
样本棉花叶片SPAD值统计分析"
| 样本类型 Sample type | 样本数 Number of samples | 最大值 Maximum value | 最小值 Minimum value | 平均值 Average value | 标准差 Standard deviation |
|---|---|---|---|---|---|
| 建模集 Calibration set | 64 | 59.5 | 20.2 | 43.5 | 7.8 |
| 验证集 Validation set | 31 | 68.2 | 17.1 | 43.3 | 8.3 |
| 全部 All the samples | 95 | 68.2 | 17.1 | 43.3 | 8.6 |
| 研究区 Study area | 58 | 63.1 | 21.5 | 46.9 | 8.1 |
表4
光谱参量与样本实测SPAD值的相关性分析"
| 序号 Number | 光谱参量 Spectral parameter | 相关系数 Correlation coefficient | |
|---|---|---|---|
| 无人机 UAV | 卫星 Sentinel-2A MSI | ||
| 1 | NDVI | 0.688** | 0.559** |
| 2 | RVI | 0.655** | 0.518* |
| 3 | DVI | 0.300 | 0.558* |
| 4 | MSR | 0.683** | 0.534 |
| 5 | RDVI | 0.530* | 0.553* |
| 6 | GNDVI | -0.613 | 0.542 |
| 7 | CIRE | -0.547* | 0.411 |
| 8 | OSAVI | 0.531* | 0.545* |
| 9 | CL(red edge) | 0.756** | 0.549* |
| 10 | MCARI | 0.687** | 0.517* |
| 11 | TCARI | -0.490 | -0.496 |
| 12 | NDRE | -0.196 | 0.412 |
| 13 | (REG-R)/(REG+R) | 0.800** | 0.557** |
| 14 | R/G | -0.768** | -0.547** |
| 15 | sqrt(R^2+G^2) | -0.653** | -0.529* |
| 16 | G×R | -0.626** | -0.541* |
| 17 | G×R×REG | -0.405 | -0.510 |
| 18 | REG-R | 0.680** | 0.548** |
| 19 | REG-NIR | 0.023 | -0.505* |
表5
棉花叶片SPAD值反演模型"
| 数据源 Data source | 反演模型 Inversion model | 建模精度 Calibration accuracy | 验证精度 Verification accuracy | ||||
|---|---|---|---|---|---|---|---|
| 决定系数 R2 | 均方根误差RMSE | 决定系数 R2 | 均方根误差RMSE | 相对分析误差 RPD | |||
| 无人机 UAV | Y=37.362+1.093×NDVI+1.26×CL(red edge)- 4.946×R/G+8.286×(REG-R)/(REG+R) | 0.709 | 3.782 | 0.753 | 3.589 | 2.045 | |
| 卫星 Sentinel-2A MSI | Y=-39.914+152.318×NDVI-2.267×CL(red edge)- 4.990×R/G-25.234×(REG-R)/(REG+R) | 0.452 | 5.823 | 0.447 | 5.909 | 1.521 | |

图3
试验区样点SPAD值散点图"
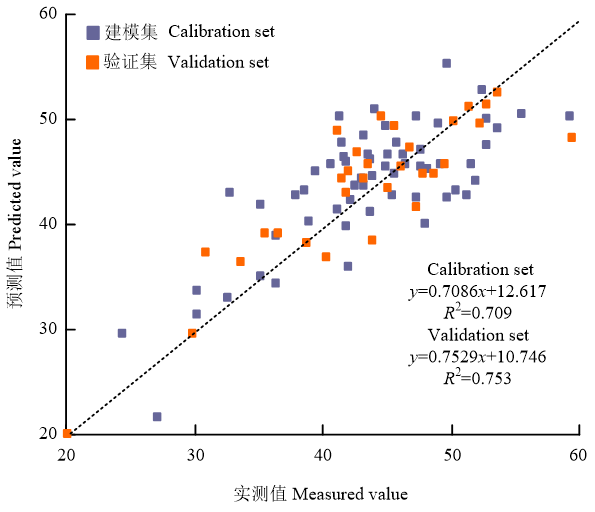
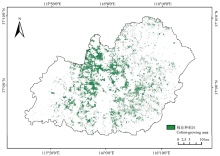
图4
研究区棉花种植区分布图"
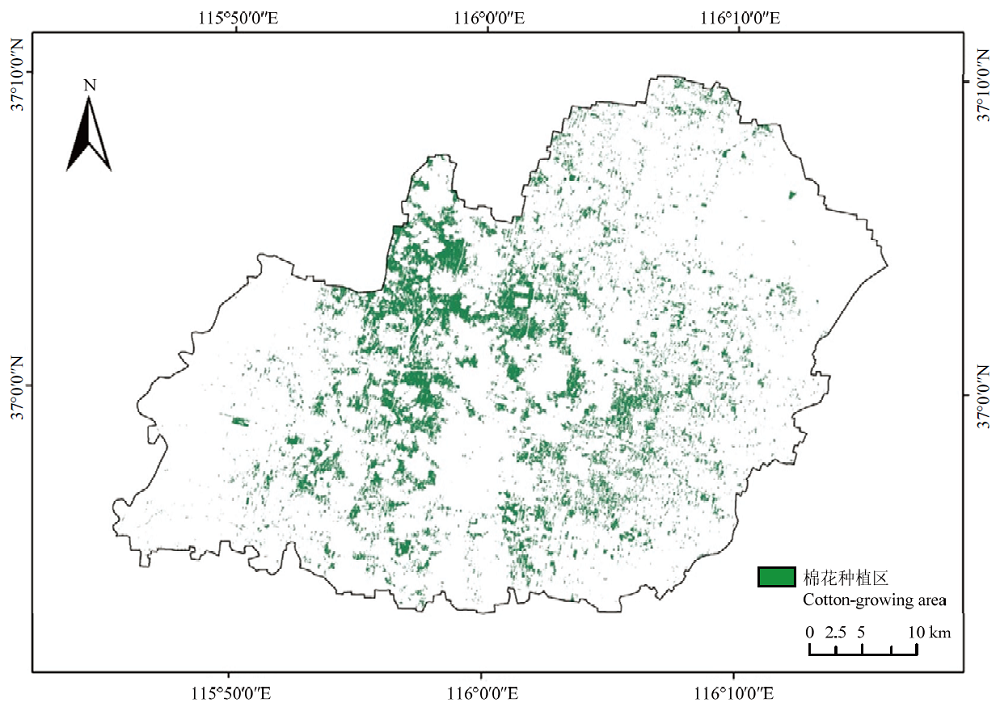
表6
棉花种植区提取混淆矩阵"
| 区域 Region | 棉花种植区 Cotton-growing area | 非棉花种植区 Non cotton-growing area | 样本总数 Total number of samples |
|---|---|---|---|
| 棉花种植区 Cotton-growing area | 1007 | 60 | 1067 |
| 非棉花种植区 Non cotton-growing area | 12 | 1360 | 1372 |
| 样本总数 Total number of samples | 1019 | 1420 | 2439 |
表7
融合前后的特征光谱参量"
| 最优光谱参量 Optimal spectral parameter | 光谱转换公式 Spectral conversion formula | 融合前 Unfused | 融合后 Fused | ||
|---|---|---|---|---|---|
| 拟合度R2 Fitting degree | 相关系数 Correlation coefficient | 拟合度R2 Fitting degree | 相关系数 Correlation coefficient | ||
| NDVI | NDVI′= 0.325×NDVI2+0.2682×NDVI+0.4053 | 0.704 | 0.559** | 0.721 | 0.580** |
| CL(red edge) | CL(red edge)′=-0.2687×CL(red edge)2+3.0079×CL (red edge) -0.821 | 0.670 | 0.549** | 0.714 | 0.611** |
| R/G | R/G′=-0.0682×R/G2+0.4316×R/G+0.3128 | 0.697 | -0.547** | 0.712 | -0.587** |
| (REG-R)/(REG+R) | (REG-R)/(REG+R)′= 0.4694×(REG-R)/(REG+R)2+ 0.1082×(REG-R)/(REG+R)+0.453 | 0.695 | 0.557** | 0.718 | 0.618** |
表8
研究区棉花叶片SPAD值反演模型"
| 模型 Model | 公式 Formula | 建模精度 Calibration accuracy | 验证精度 Verification accuracy | |||
|---|---|---|---|---|---|---|
| 决定系数 R2 | 均方根误差RMSE | 决定系数 R2 | 均方根误差RMSE | 相对分析误差 RPD | ||
| MSI-ModMSI | Y=-39.914+152.318×NDVI-2.267×CL(red edge)- 4.990×R/G-25.234×(REG-R)/(REG+R) | 0.452 | 5.823 | 0.447 | 5.909 | 1.521 |
| Fused MSI-ModMSI | Y=-39.914+152.318×NDVI′-2.267×CL(red edge)′- 4.990×R/G′-25.234×(REG-R)/(REG+R)′ | 0.467 | 5.366 | 0.487 | 5.522 | 1.541 |
| MSI-ModUAV | Y=37.362+1.093×NDVI+1.26×CL(red edge)- 4.946×R/G+8.286×(REG-R)/(REG+R) | 0.615 | 4.620 | 0.628 | 4.256 | 1.546 |
| Fused MSI-ModUAV | Y=37.362+1.093×NDVI′+1.26×CL(red edge)′- 4.946×R/G′+8.286×(REG-R)/(REG+R)′ | 0.672 | 3.982 | 0.713 | 3.859 | 1.685 |
| AR Fused MSI-ModUAV | Y=37.362+1.066×NDVI+5.388×CL(red edge)- 3.645×R/G+18.652×(REG-R)/(REG+R) | 0.638 | 4.259 | 0.664 | 4.015 | 1.598 |
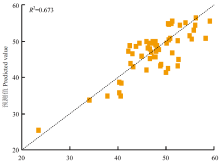
图5
研究区样点SPAD值散点图"

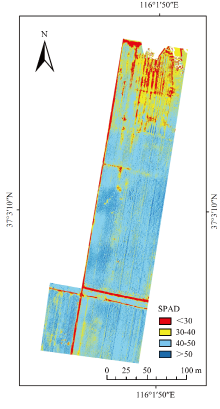
图6
试验区棉花叶片SPAD值反演图"

表9
试验区棉花叶片SPAD值分级统计"
| 等级 Level | 反演值 Inversion value | 样点实测值 Measured value of sample point | 样点预测值 Predicted values of sample points | |||
|---|---|---|---|---|---|---|
| 像元数 Number of pixels | 所占比例 Proportion (%) | 个数 Number | 所占比例 Proportion (%) | 个数 Number | 所占比例 Proportion (%) | |
| <30 | 664632 | 6.747 | 6 | 6.316 | 4 | 4.210 |
| 30-40 | 1829536 | 18.574 | 17 | 17.895 | 17 | 17.895 |
| 40-50 | 6483804 | 65.825 | 55 | 57.895 | 62 | 65.263 |
| >50 | 872169 | 8.854 | 17 | 17.894 | 12 | 12.632 |
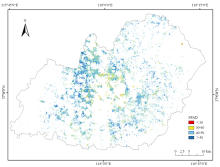
图7
研究区棉花叶片SPAD值反演图"
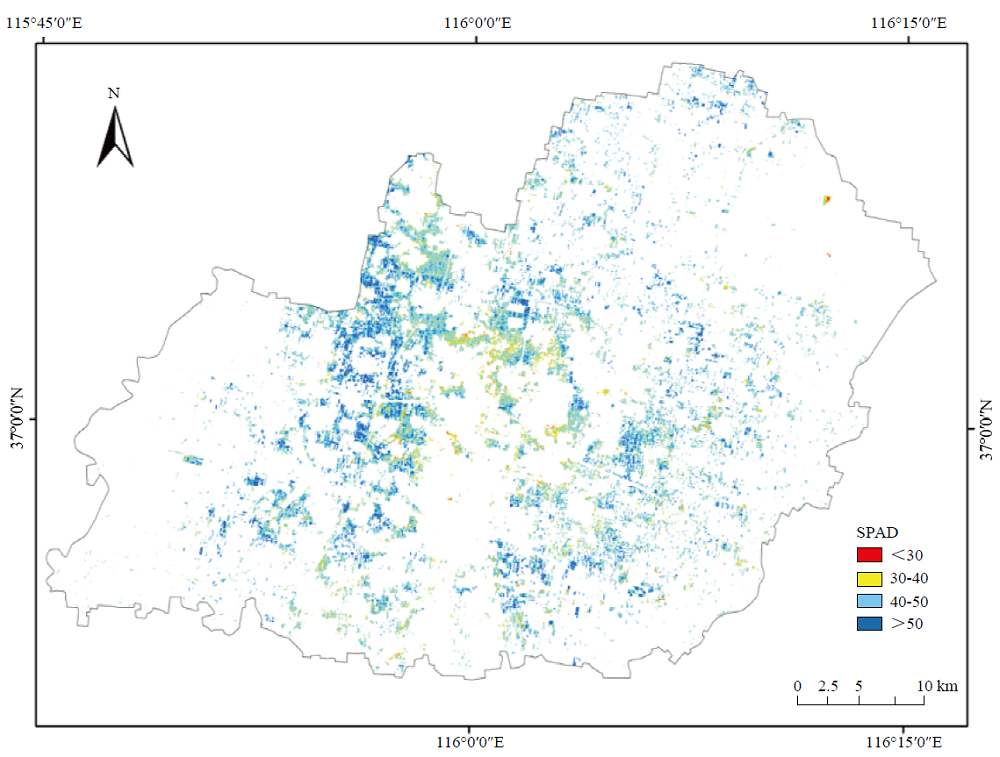
表10
研究区棉花叶片SPAD值分级统计"
| 等级 Level | 反演图 Inversion map | |
|---|---|---|
| 像元数 Number of pixels | 所占比例 Proportion (%) | |
| <30 | 15749 | 1.395 |
| 30-40 | 186849 | 16.553 |
| 40-50 | 492603 | 43.640 |
| >50 | 433588 | 38.412 |
| [1] | 苏伟, 赵晓凤, 孙中平, 张明政, 邹再超, 王伟, 史园莉. 基于Sentinel-2A影像的玉米冠层叶绿素含量估算. 光谱学与光谱分析, 2019, 39(5): 1535-1542. |
| SU W, ZHAO X F, SUN Z P, ZHANG M Z, ZOU Z C, WANG W, SHI Y L. Estimating the corn canopy chlorophyll content using the Sentinel-2A image. Spectroscopy and Spectral Analysis, 2019, 39(5): 1535-1542. (in Chinese) | |
| [2] | 周敏姑, 邵国敏, 张立元, 刘治开, 韩文霆. 基于无人机遥感的冬小麦叶绿素含量多光谱反演. 节水灌溉, 2019, (9): 40-45. |
| ZHOU M G, SHAO G M, ZHANG L Y, LIU Z K, HAN W T. Multi-spectral inversion of SPAD value of winter wheat based on unmanned aerial vehicle remote sensing. Water Saving Irrigation, 2019, (9): 40-45. (in Chinese) | |
| [3] | 陈硕博. 无人机多光谱遥感反演棉花光合参数与水分的模型研究[D]. 西安: 西北农林科技大学, 2019. |
| CHEN S B. Modeling of cotton photosynthetic parameters and water content retrieval by multi-spectral remote sensing of UAV[D]. Xi’an: Northwest A&F University, 2019. (in Chinese) | |
| [4] |
HATAM Z, SABET M S, MALAKOUTI M J, BIDGOLI A M, HOMAEE M. Zinc and potassium fertilizer recommendation for cotton seedlings under salinity stress based on gas exchange and chlorophyll fluorescence responses. South African Journal of Botany, 2020, 130: 155-164.
doi: 10.1016/j.sajb.2019.11.032 |
| [5] | 鱼欢, 邬华松, 王之杰. 利用SPAD和Dualex快速、无损诊断玉米氮素营养状况. 作物学报, 2010, 36(5): 840-847. |
| YU H, WU H S, WANG Z J. Evaluation of SPAD and Dualex for in season corn nitrogen status estimation. Acta Agronomica Sinica, 2010, 36(5): 840-847. (in Chinese) | |
| [6] |
LI X J, DU H Q, ZHOU G M, MAO F J, ZHANG M, HAN N, FAN W L, LIU H, HUANG Z H, HE S B, MEI T T. Phenology estimation of subtropical bamboo forests based on assimilated MODIS LAI time series data. ISPRS Journal of Photogrammetry and Remote Sensing, 2021, 173(6): 262-277.
doi: 10.1016/j.isprsjprs.2021.01.018 |
| [7] |
KOTIKOT A M, FLORES A, GRIFFIN R E, SEDAH A, NYAGA J, MUGO R, LIMAYE A, IRWIN D E. Mapping threat to agriculture in East Africa: Performance of MODIS derived LST for frost identification in Kenya’s tea plantations. International Journal of Applied Earth Observation and Geoinformation, 2018, 72: 131-139.
doi: 10.1016/j.jag.2018.05.009 |
| [8] |
HOLZMAN M E, CARMONA F, RIVAS R, NICLOS R. Early assessment of crop yield from remotely sensed water stress and solar radiation data. ISPRS Journal of Photogrammetry and Remote Sensing, 2018, 145: 297-308.
doi: 10.1016/j.isprsjprs.2018.03.014 |
| [9] |
GHOSH S, MISHRA D R, GITELSON A A. Long-term monitoring of biophysical characteristics of tidal wetlands in the northern Gulf of Mexico—A methodological approach using MODIS. Remote Sensing of Environment, 2016, 173: 39-58.
doi: 10.1016/j.rse.2015.11.015 |
| [10] |
LIAQAT M U, CHEEMA M J M, HUANG W J, MAHMOOD T, ZAMAN M, KHAN M M. Evaluation of MODIS and Landsat multiband vegetation indices used for wheat yield estimation in Irrigated Indus Basin. Computers and Electronics in Agriculture, 2017, 138: 39-47.
doi: 10.1016/j.compag.2017.04.006 |
| [11] |
MOKHTARI A, NOORY H, POURSHAKOURI F, HAGHIGHATMEHE P, AFRASIABIAN Y, RAZAVI M, FEREYDOONI F, NAENI A S. Calculating potential evapotranspiration and single crop coefficient based on energy balance equation using Landsat 8 and Sentinel-2. ISPRS Journal of Photogrammetry and Remote Sensing, 2019, 154: 231-245.
doi: 10.1016/j.isprsjprs.2019.06.011 |
| [12] | 张卓然, 常庆瑞, 张延龙, 班松涛, 由明明. 基于支持向量机的棉花冠层叶片叶绿素含量高光谱遥感估算. 西北农林科技大学(自然科学版), 2018, 46(11): 39-45. |
| ZHANG Z R, CHANG Q R, ZHANG Y L, BAN S T, YOU M M. Hyperspectral estimation of chlorophyll remote sensing content of cotton canopy leaves based on support vector machine. Journal of Northwest A&F University (Natural Science Edition), 2018, 46(11): 39-45. (in Chinese) | |
| [13] | LIU J B, HAN J C, CHEN X, SHI L, ZHANG L. Nondestructive detection of rape leaf chlorophyll level based on Vis-NIR spectroscopy. Spectrochimica Acta Part A: Molecular and Biomolecular Spectroscopy, 2019, 222: 117202. |
| [14] | 张东彦, 宋晓宇, 马智宏, 杨贵军, 黄文江, 王纪华. 扫描成像光谱仪和地物光谱仪在单叶尺度上的对比研究. 中国农业科学, 2010, 43(11): 2239-2245. |
| ZHANG D Y, SONG X Y, MA Z H, YANG G J, HUANG W J, WANG J H. Assessment of the developed pushbroom imaging spectrometer in single leaf scale. Scientia Agricultura Sinica, 2010, 43(11): 2239-2245. (in Chinese) | |
| [15] | 唐普恩, 丁建丽, 葛翔宇, 张振华. 基于Sentinel-2A影像干旱区棉花叶片SPAD数字制图. 生态学报, 2020, 40(22): 8326-8335. |
| TANG P E, DING J L, GE X Y, ZHANG Z H. SPAD digital mapping of cotton leaves in arid area based on Sentinel-2A image. Acta Ecologica Sinica, 2020, 40(22): 8326-8335. (in Chinese) | |
| [16] |
MALHI R K M, KIRAN G S. Empirical modelling for retrieval of foliar traits in cotton crop using spatial data. Current Science, 2019, 116(12): 2089-2096.
doi: 10.18520/cs/v116/i12/2089-2096 |
| [17] |
BALLESTEROS R, ORTEGA J F, HERNANDEZ D. Onion biomass monitoring using UAV based RGB imaging. Precision Agriculture, 2018, 19(5): 840-857.
doi: 10.1007/s11119-018-9560-y |
| [18] | 奚雪, 赵庚星, 高鹏, 崔昆, 李涛. 基于Sentinel卫星及无人机多光谱的滨海冬小麦种植区土壤盐分反演研究——以黄三角垦利区为例. 中国农业科学, 2020, 53(24): 5005-5016. |
| XI X, ZHAO G X, GAO P, CUI K, LI T. Inversion of soil salinity in coastal winter wheat growing area based on sentinel satellite and unmanned aerial vehicle multi-spectrum—A case study in Kenli District of the Yellow River Delta. Scientia Agricultura Sinica, 2020, 53(24): 5005-5016. (in Chinese) | |
| [19] |
史舟, 徐冬云, 滕洪芬, 胡月明, 潘贤章, 张甘霖. 土壤星地传感技术现状与发展趋势. 地理科学进展, 2018, 37(1): 79-92.
doi: 10.18306/dlkxjz.2018.01.009 |
|
SHI Z, XU D Y, TENG H F, HU Y M, PAN X Z, ZHANG G L. Soil information acquisition based on remote sensing and proximal soil sensing: Current status and prospect. Progress in Geography, 2018, 37(1): 79-92. (in Chinese)
doi: 10.18306/dlkxjz.2018.01.009 |
|
| [20] | 陈俊英, 王新涛, 张智韬, 韩佳, 姚志华, 魏广飞. 基于无人机-卫星遥感尺度的土壤盐渍化监测方法. 农业机械学报, 2019, 50(12): 161-169. |
| CHEN J Y, WANG X T, ZHANG Z T, HAN J, YAO Z H, WEI G F. Soil salinization monitoring method based on UAV satellite remote sensing scale up. Transactions of the Chinese Society for Agricultural Machinery, 2019, 50(12): 161-169. (in Chinese) | |
| [21] | 田明璐, 班松涛, 常庆瑞, 马文君, 殷紫, 王力. 基于无人机成像光谱仪数据的棉花叶绿素含量反演. 农业机械学报, 2016, 47(11): 285-293. |
| TIAN M L, BAN S T, CHANG Q R, MA W J, YIN Z, WANG L. Estimation of SPAD value of cotton leaf using hyperspectral images from UAV based imaging spectroradiometer. Transactions of the Chinese Society for Agricultural Machinery, 2016, 47(11): 285-293. (in Chinese) | |
| [22] | 毛智慧, 邓磊, 孙杰, 张爱武, 陈向阳, 赵云. 无人机多光谱遥感在玉米冠层叶绿素预测中的应用研究. 光谱学与光谱分析, 2018, 38(9): 2923-2931. |
| MAO Z H, DENG L, SUN J, ZHANG A W, CHEN X Y, ZHAO Y. Research on the application of UAV multispectral remote sensing in the maize chlorophyll prediction. Spectroscopy and Spectral Analysis, 2018, 38(9): 2923-2931. (in Chinese) | |
| [23] | CHEN H Y, MA Y, ZHU A X, WANG Z R, GENG X Z, WEI Y N. Soil salinity inversion based on differentiated fusion of satellite image and ground spectra. International Journal of Applied Eaeth Observation and Geoinformation, 2021, 101(2): 1-11. |
| [24] | 齐小玲, 吴健平. 多源遥感影像融合及其关键技术探讨. 现代测绘, 2003, 26(3): 20-22. |
| QI X L, WU J P. Study on multi-source RS images fusion and its key techniques. Modern Surveying and Mapping, 2003, 26(3): 20-22. (in Chinese) | |
| [25] |
PENG Y, NGUY-ROBERTSON A, ARKEBAUER T, GITELSON A A. Assessment of canopy chlorophyll content retrieval in maize and soybean: Implications of hysteresis on the development of generic algorithms. Remote Sensing, 2017, 9(3): 226.
doi: 10.3390/rs9030226 |
| [26] | 贾博中. 基于MODIS与无人机的内蒙古沿黄平原区玉米信息反演与产量估测[D]. 内蒙古: 内蒙古农业大学, 2021. |
| JIA B Z. Maize information inversion and yield estimation a plain along the Yellow River in Inner Mongolia based on MODIS and UAV[D]. Inner Mongolia: Inner Mongolia Agricultural University, 2021. (in Chinese) | |
| [27] |
JIN X L, LI Z H, FENG H K, XU X G, YANG G J. Newly combined spectral indices to improve estimation of total leaf chlorophyll content in cotton. IEEE Journal of Selected Topics in Applied Earth Observations and Remote Sensing, 2014, 7(11): 4589-4600.
doi: 10.1109/JSTARS.2014.2360069 |
| [28] | 易秋香. 基于Sentinel-2多光谱数据的棉花叶面积指数估算. 农业工程学报, 2019, 35(16): 189-197. |
| YI Q X. Remote estimation of cotton LAI using Sentinel-2 multispectral data. Transactions of the Chinese Society of Agricultural Engineering, 2019, 35(16): 189-197. (in Chinese) | |
| [29] | 刘金然. 基于无人机遥感影像的棉花主要生长参数反演[D]. 济南: 山东师范大学, 2019. |
| LIU J R. Inversion of cotton main growth parameters based on UAV sensing image[D]. Ji’nan: Shandong Normal University, 2019. (in Chinese) | |
| [30] | 张卓然. 棉花高光谱特征及其农学参数遥感反演研究[D]. 杨凌: 西北农林科技大学, 2018. |
| ZHANG Z R. Research on hyperspecrtal characteristic of cotton and remote sensing inversion about cotton agronomic parameters[D]. Yangling: Northwest A&F University, 2018. (in Chinese) | |
| [31] |
ZHANG S M, ZHAO G X, LANG K, SU B W, CHEN X N, XI X, ZHANG H B. Integrated satellite, unmanned aerial vehicle (UAV) and ground inversion of the SPAD of winter wheat in the reviving stage. Sensors, 2019, 19(7): 1485.
doi: 10.3390/s19071485 |
| [32] | 李敏. 基于RS和GIS的县域棉花信息提取及分区管理研究——以山东省夏津县为例[D]. 泰安: 山东农业大学, 2012. |
| LI M. Cotton information extraction and management zoning based on RS and GIS at county scale—A case study in Xiajin county, Shandong province[D]. Taian: Shandong Agricultural University, 2012. (in Chinese) | |
| [33] | 张同瑞, 赵庚星, 高明秀, 常春艳, 王卓然. 基于近地多光谱和OLI影像的黄河三角洲冬小麦种植区盐分估算及遥感反演——以山东省垦利县和无棣县为例. 自然资源学报, 2016, 31(6): 1051-1060. |
| ZHANG T R, ZHAO G X, GAO M X, CHANG C Y, WANG Z R. Soil salinity estimation and remote sensing inversion based on near-ground multispectral and TM imagery in winter wheat growing area in the Yellow River Delta—Case study in Kenli county and Wudi county, Shandong province. Journal of Natural Resources, 2016, 31(6): 1051-1060. (in Chinese) | |
| [34] | 梁亮, 杨敏华, 张连蓬, 林卉, 周兴东. 基于SVR算法的小麦冠层叶绿素含量高光谱反演. 农业工程学报, 2012, 28(20): 163-172. |
| LIANG L, YANG M H, ZHANG L P, LIN H, ZHOU X D. Chlorophyll content inversion with hyperspectral technology for wheat canopy based on support vector regression algorithm. Transactions of the Chinese Society of Agricultural Engineering, 2012, 28(20): 163-172. (in Chinese) | |
| [35] | 李粉玲, 王力, 刘京, 常庆瑞. 基于高分一号卫星数据的冬小麦叶片SPAD值遥感估算. 农业机械学报, 2015, 46(9): 273-281. |
| LI F L, WANG L, LIU J, CHANG Q R. Remote sensing estimation of SPAD value for wheat leaf based on GF-1 data. Transactions of the Chinese Society for Agricultural Machinery, 2015, 46(9): 273-281. (in Chinese) | |
| [36] |
CAO Q, MIAO Y X, SHEN J N, YU W F, YUAN F, CHENG S S, HUANG S Y, WANG H Y, YANG W, LIU F Y. Improving in-season estimation of rice yield potential and responsiveness to topdressing nitrogen application with crop circle actice crop canopy sensor. Precision Agriculture, 2016, 17: 136-154.
doi: 10.1007/s11119-015-9412-y |
| [37] |
HABOUSANE D, MILLER J R, PATTEY E, ZARCO-TEJADA P J, STRACHAN I B. Hyperspectra vegetation indices and novel algorithms for predicting green LAI of crop canopies: Modeling and validation in the context of precision agriculture. Remote Sensing of Environment, 2004, 90(3): 337-352.
doi: 10.1016/j.rse.2003.12.013 |
| [38] | 纪伟帅, 陈红艳, 王淑婷, 张玉婷. 基于无人机多光谱的华北平原花岭期棉花叶片SPAD建模方法研究. 中国农学通报, 2021, 37(22): 143-150. |
| JI W S, CHEN H Y, WANG S T, ZHANG Y T. Modeling method of cotton leaves SPAD at flowering and boll stage in North China Plain based on UAV multispectrum. Chinese Agricultural Science Bulletin, 2021, 37(22): 143-150. (in Chinese) | |
| [39] | 王丹阳, 陈红艳, 王桂峰, 丛津桥, 王向峰, 魏学文. 无人机多光谱反演黄河口重度盐渍土盐分的研究. 中国农业科学, 2019, 52(10): 1698-1709. |
| WANG D Y, CHEN H Y, WANG G F, CONG J Q, WANG X F, WEI X W. Salinity inversion of severe soil in the Yellow River estuary based on UAV multi-spectral. Scientia Agricultura Sinica, 2019, 52(10): 1698-1709. (in Chinese) | |
| [40] |
MIURA T, HUETE A, YOSHIOKA H. An empirical investigation of cross sensor relationships of NDVI and red/near infrared reflectance using EO-1 hyperion data. Remote Sensing of Environment, 2006, 100(2): 223-236.
doi: 10.1016/j.rse.2005.10.010 |
| [41] |
TRISHCHENKO A P. Effects of spectral response function on surface reflectance and NDVI measured with moderate resolution satellite sensors: Extension to AVHRR NOAA-17 and METOP-A. Remote Sensing of Environment, 2009, 113(2): 335-341.
doi: 10.1016/j.rse.2008.10.002 |
| [42] | 陈文娇, 翁永玲, 范兴旺, 曹一茹. 基于光谱转换的土壤盐分反演与动态分析. 东南大学学报(自然科学版), 2017. 47(6): 1233-1238. |
| CHEN W J, WENG Y L, FAN X W, CAO Y R. Soil salinity retrieval and dynamic analysis based on spectral band inter-calibration. Journal of Southeast University (Natural Science Edition), 2017, 47(6): 1233-1238. (in Chinese) | |
| [43] |
MA Y, CHEN H Y, ZHAO G X, WANG Z R, WANG D Y. Spectral index fusion for salinized soil salinity inversion using Sentinel-2A and UAV images in a coastal area. IEEE Access, 2020, 8: 159595-159608.
doi: 10.1109/ACCESS.2020.3020325 |
| [44] | 刘爽, 吴永波. 城市土壤压实对树木叶片叶绿素及光合生理特性的影响. 生态环境学报, 2010, 19(1): 172-176. |
| LIU S, WU Y B. The impact of soil compaction on chlorophyll and photosynthetic characteristics of trees. Ecology and Environmental Sciences, 2010, 19(1): 172-176. (in Chinese) | |
| [45] | 李美平, 朱宇恩, 尚晋伟, 郑国璋. 城市路口差异对行道树叶片叶绿素含量的影响研究. 环境污染与防治, 2010, 32(9): 37-40, 49. |
| LI M P, ZHU Y E, SHANG J W, ZHENG G Z. Influence of road intersection difference on chlorophyll content of roadside tree. Environmental Pollution & Control, 2010, 32(9): 37-40, 49. (in Chinese) | |
| [46] | 李萍, 赵庚星, 高明秀, 常春燕, 王卓然, 张同瑞, 安德玉, 贾吉超. 黄河三角洲土壤含水量状况的高光谱估测与遥感反演. 土壤学报, 2015, 52(6): 1262-1272. |
| LI P, ZHAO G X, GAO M X, CHANG C Y, WANG Z R, ZHANG T R, AN D Y, JIA J C. Hyperspectral estimation and remote sensing reteieval of soil water regime in the Yellow River Delta. Acta Pedologica Sinica, 2015, 52(6): 1262-1272. (in Chinese) | |
| [47] | FAN X W, WENG Y L, TAO J M. Towards decadal soil salinity mapping using Landsat time series data. Internationl Journal of Applied Earth Observation and Geoinformation, 2016, 52: 32-41. |
| [48] |
依尔夏提·阿不来提, 买买提·沙吾提, 白灯莎·买买提艾力, 安申群, 马春玥. 基于随机森林算法的棉花叶片叶绿素含量估算. 作物学报, 2019, 45(1): 81-90.
doi: 10.3724/SP.J.1006.2019.84058 |
|
ABLET E, SAWUT M, MAIMAITIAILI B, AN S Q, MA C Y. Estimation of leaf chlorophyll content in cotton based on the random forest approach. Acta Agronomica Sinica, 2019, 45(1): 81-90. (in Chinese)
doi: 10.3724/SP.J.1006.2019.84058 |
|
| [49] | 王烁, 常庆瑞, 刘梦云, 严林, 李媛媛, 刘秀英. 基于高光谱遥感的棉花叶片叶绿素含量估算. 中国农业大学学报, 2017, 22(4): 16-27. |
| WANG S, CHANG Q R, LIU M Y, YAN L, LI Y Y, LIU X Y. Estimation on chlorophyll content of cotton based on optimized spectral index. Journal of China Agricultural University, 2017, 22(4): 16-27. (in Chinese) | |
| [50] | 黄春燕. 基于高光谱数据的北疆棉花遥感监测研究[D]. 石河子: 石河子大学, 2005. |
| HUANG C Y. Study on monitoring of remote sensing of cotton in north of XinJiang with hyperspectral data[D]. Shihezi: Shihezi University, 2005. (in Chinese) |
| [1] | 魏永康, 杨天聪, 臧少龙, 贺利, 段剑钊, 谢迎新, 王晨阳, 冯伟. 基于无人机多光谱影像特征融合的小麦倒伏监测[J]. 中国农业科学, 2023, 56(9): 1670-1685. |
| [2] | 郭燕, 井宇航, 王来刚, 黄竞毅, 贺佳, 冯伟, 郑国清. 基于无人机影像特征的冬小麦植株氮含量预测及模型迁移能力分析[J]. 中国农业科学, 2023, 56(5): 850-865. |
| [3] | 冯子恒,宋莉,张少华,井宇航,段剑钊,贺利,尹飞,冯伟. 基于无人机多光谱和热红外影像信息融合的小麦白粉病监测[J]. 中国农业科学, 2022, 55(5): 890-906. |
| [4] | 马啸,陈鹏飞. 基于无人机多光谱影像的小麦封垄前种植行识别方法改进[J]. 中国农业科学, 2022, 55(20): 3926-3938. |
| [5] | 李美炫,朱西存,白雪源,彭玉凤,田中宇,姜远茂. 基于无人机影像阴影去除的苹果树冠层氮素含量遥感反演[J]. 中国农业科学, 2021, 54(10): 2084-2094. |
| [6] | 史丰智,王瑞燕,李玉环,闫宏,张晓鑫. LAI无人机多光谱遥感估测及其在盐渍土改良中的应用[J]. 中国农业科学, 2020, 53(9): 1795-1805. |
| [7] | 赵静,李志铭,鲁力群,贾鹏,杨焕波,兰玉彬. 基于无人机多光谱遥感图像的玉米田间杂草识别[J]. 中国农业科学, 2020, 53(8): 1545-1555. |
| [8] | 奚雪,赵庚星,高鹏,崔昆,李涛. 基于Sentinel卫星及无人机多光谱的滨海冬小麦种植区土壤盐分反演研究——以黄三角垦利区为例[J]. 中国农业科学, 2020, 53(24): 5005-5016. |
| [9] | 石雅娇,陈鹏飞. 一种面向农业无人机影像分割的尺度参数自动确定方法[J]. 中国农业科学, 2020, 53(17): 3496-3508. |
| [10] | 陈鹏飞, 梁飞. 基于低空无人机影像光谱和纹理特征的棉花氮素营养诊断研究[J]. 中国农业科学, 2019, 52(13): 2220-2229. |
| [11] | 王丹阳,陈红艳,王桂峰,丛津桥,王向锋,魏学文. 无人机多光谱反演黄河口重度盐渍土盐分的研究[J]. 中国农业科学, 2019, 52(10): 1698-1709. |
| [12] | 陈鹏飞,李刚,石雅娇,徐志涛,杨粉团,曹庆军. 一款无人机高光谱传感器的验证及其在玉米叶面积指数反演中的应用[J]. 中国农业科学, 2018, 51(8): 1464-1474. |
| [13] | 张春兰,杨贵军,李贺丽,汤伏全,刘畅,张丽妍. 基于随机森林算法的冬小麦叶面积指数遥感反演研究[J]. 中国农业科学, 2018, 51(5): 855-867. |
| [14] | 贺英,邓磊,毛智慧,孙杰. 基于数码相机的玉米冠层SPAD遥感估算[J]. 中国农业科学, 2018, 51(15): 2886-2897. |
| [15] | 李杰,冯跃华,牟桂婷,许桂玲,罗强鑫,罗康杰,黄世凤,石欣,管正策,叶勇,黄佑岗. 基于SPAD值的水稻施氮叶值模型构建及应用效果[J]. 中国农业科学, 2017, 50(24): 4714-4724. |
|
||