


中国农业科学 ›› 2022, Vol. 55 ›› Issue (4): 692-706.doi: 10.3864/j.issn.0578-1752.2022.04.006
熊淑萍1( ),高明1,张志勇1,秦步坛1,徐赛俊1,付新露1,王小纯2,马新明1()
收稿日期:2021-04-25
接受日期:2021-10-27
出版日期:2022-02-16
发布日期:2022-02-23
联系方式:
熊淑萍,E-mail: shupxiong@163.com。
基金资助:
XIONG ShuPing1(),GAO Ming1,ZHANG ZhiYong1,QIN BuTan1,XU SaiJun1,FU XinLu1,WANG XiaoChun2,MA XinMing1()
Received:2021-04-25
Accepted:2021-10-27
Published:2022-02-16
Online:2022-02-23
摘要:
【目的】分析河南省不同产区小麦籽粒产量和产量构成要素的时空差异,明确不同产区进一步提高小麦籽粒产量的主攻方向。【方法】选用河南省小麦固定监测站点实地监测数据,利用地理信息系统(GIS)选择最优模型,绘制2017—2020年河南省4个小麦生产区产量与产量构成要素空间分布图,分析产量和产量构成要素在不同小麦产区的差异及其相互关系。【结果】小麦产量及产量构成要素在不同产区间存在差异,其中,产量和穗数均表现为豫北和豫中产区显著高于豫南和豫西产区,以豫北产区最高,豫西产区最低。而穗粒数表现为豫中、豫南和豫北产区显著高于豫西产区,豫中产区最高,豫西产区最低。千粒重表现为豫北产区最高,豫南产区最低。小麦产量、穗数、穗粒数、千粒重多在豫中和豫南交汇处(漯河、周口、驻马店等地)表现较高且在年际间稳定。相关分析表明,不同小麦产区产量构成三要素与产量的关系不一致。其中,豫北和豫中产区以穗数和穗粒数与产量的相关性最大,而豫西和豫南产区产量构成三要素与产量的相关性则表现为穗数最高,千粒重次之,穗粒数最低。通径分析进一步表明,4个小麦产区间产量构成要素对产量的贡献不同,其中,豫北产区以穗数、穗粒数对产量贡献最大,直接通径系数均为0.67;豫中和豫南产区产量构成三要素对产量的贡献依次为穗数>穗粒数>千粒重;而豫西产区则为穗数最大,千粒重次之,穗粒数最低,直接通径系数分别为0.69、0.45、0.39。同时,间接通径系数显示,豫北、豫中、豫南产区提高千粒重的增产效果优于提高穗粒数,而豫西产区则为提高穗粒数更优。【结论】河南省小麦产量及产量构成要素在不同小麦产间区及年际间存在较大差距,同时,不同小麦产区小麦产量构成三要素对产量的贡献不同,因此,河南省在进一步挖掘小麦生产潜力方面,应分区域、分年型精准分类进行。就本试验条件而言,河南省各小麦产区在稳定穗数的基础上,豫北、豫中、豫南产区应着力进一步挖掘千粒重的潜力,而豫西产区提高穗粒数的增产效果优于千粒重。
熊淑萍, 高明, 张志勇, 秦步坛, 徐赛俊, 付新露, 王小纯, 马新明. 基于GIS的河南省小麦产量及产量构成要素时空差异分析[J]. 中国农业科学, 2022, 55(4): 692-706.
XIONG ShuPing, GAO Ming, ZHANG ZhiYong, QIN BuTan, XU SaiJun, FU XinLu, WANG XiaoChun, MA XinMing. Spatial and Temporal Difference Analysis of Wheat Yield and Yield Components in Henan Province Based on GIS[J]. Scientia Agricultura Sinica, 2022, 55(4): 692-706.
表1
研究区域概况及监测点分布情况"
| 小麦产区 Wheat region | 产区概况 Region overview | 监测点分布 Monitoring points distribution | 监测点数量 Monitoring points number |
|---|---|---|---|
| 豫北灌区 Irrigated region of North Henan | 河南北部,太行山东麓、南麓,与山西省毗邻,地处黄河北部及沿黄两岸地区,主要包括安阳市,新乡市,鹤壁市,焦作市,济源市,洛阳市的孟津、偃师等部分市(县)和濮阳市等。土壤多属于褐土类的不同土种,土质以中壤土或重壤土为主,小麦生育期内总降水量为160—250 mm The north of Henan, the eastern and southern foothills of Taihang mountain, is located in the northern part of the Yellow River and along the both sides of the Yellow River, mainly including Anyang city, Xinxiang city, Hebi city, Jiaozuo city, Jiyuan city, Mengjin, Yanshi and other cities (counties) of Luoyang city and Puyang city. The soil mostly belongs to different soil varieties of cinnamon soil, and the soil is mainly medium loam or heavy loam. The total precipitation during the growth period of wheat is 160-250 mm | 濮阳县、范县、南乐县、清丰县、安阳县、内黄县、汤阴县、滑县、孟州市、获嘉县、修武县、博爱县、山阳区、济源市、浚县、淇县、长垣县、延津县、原阳县 Puyang county, Fan county, Nanle county. Qingfeng county, Anyang county, Neihuang county, Tangyin county, Hua county, Mengzhou city, Huojia county, Xiuwu county, Boai county, Shanyang district, Jiyuan city, Xun county,Qi county, Changyuan county, Yanjing county, Yuanyang county | 23 |
| 豫中补灌区 Supplementary irrigation region of Central Henan | 河南的中部平原,主要包括郑州市、开封市、商丘市、周口市、许昌市、漯河市部分市(县)。主要土壤类型为黏质潮土与两合土,小麦生育期内总降水量为200—300 mm The central plain of Henan mainly includes some cities (counties) of Zhengzhou city, Kaifeng city, Shangqiu city, Zhoukou city, Xuchang city and Luohe city. The main soil varieties are clay-fluvo-aquic soil and mixed soil. The total precipitation during wheat growth period is 200-300 mm | 新郑市、巩义市、祥符区、杞县、通许县、尉氏县、兰考县、长葛市、禹州市、建安区、舞阳县、临颍县、郾城区、川汇区、商水县、鹿邑县、梁园区、柘城县、夏邑县、虞城县、永城市、舞钢市、叶县、宝丰县、汝州市 Xinzheng city, Gongyi city, Xiangfu district, Qi county, Tongxu county, Weishi county, Lankao county, Changge city, Yuzhou city, Jian'an district, Wuyang county, Linying county, Yicheng district, Chuanhui district, Shangshui county, Luyi county, Liangyuan district, Zhecheng county, Xiayi county, Yucheng county, Yongcheng city, Wugang city, Ye county, Baofeng county, Ruzhou city | 33 |
| 豫西旱作区 Dry farming region of West Henan | 河南省西部,豫西黄土塬坡区和豫北部分浅山丘陵区,太行山余脉和山前丘陵及熊耳山和肴山山脉的缓坡地带,海拔在200-500米,主要包括洛阳市、三门峡市等市县及焦作、新乡市等西部的缓冲丘陵地区。土壤以褐土和黄土为主,土壤质地普遍较黏,多为重壤,部分为中壤,小麦生育期内总降水仅为180—200 mm The west of Henan, the loess plateau slope area in the west of Henan and some shallow mountain and hilly areas in the north of Henan, the remaining veins of Taihang mountain, the hills in front of the mountain, the gentle slope of Xionger mountain and Yao mountain range, with an altitude of 200-500 m, mainly including cities and counties such as Luoyang city and Sanmenxia city, and the buffer hilly areas in the west such as Jiaozuo city and Xinxiang city. The soil is mainly cinnamon soil and loess. The soil texture is generally sticky, mostly heavy soil and some medium soil. The total precipitation during the growth period of wheat is only 180-200 mm | 洛宁县、汝阳县、宜阳县、新安县、渑池县、灵宝市、郏县、渑池县 Luoning county, Ruyang county, Yiyang county, Xin'an county, Mianchi county, Lingbao city, Jiaxian county, Mianchi county | 12 |
| 豫南雨养区 Rain-fed region of South Henan | 河南南部,分布于北纬33度线两侧,主要包括驻马店市、周口市、南阳市、平顶山市、信阳市的部分县(市)。土壤以砂姜黑土与黄褐土为主要土壤类型,小麦生育期内总降水量为450—600 mm The south of Henan, distributed on both sides of the 33° N latitude line, mainly includes some counties (cities) of Zhumadian city, Zhoukou city, Nanyang city, Pingdingshan city and Xinyang city. The main soil types are lime concretion black soi and yellow cinnamon soil. The total precipitation during the growth period of wheat is 450-600 mm | 西平县、平舆县、正阳县、驿城区、上蔡县、固始县、方城县、社旗县、唐河县、邓州市 Xiping county, Pingyu county, Zhengyang county, Yicheng district, Shangcai county, Gushi county, Fangcheng county, Sheqi county, Tanghe county and Dengzhou city | 16 |
表2
河南省不同小麦产区小麦生育期降水量与积温情况"
| 小麦产区 Wheat region | 年份 Year | 降水量 Precipitation (mm) | ≥0℃积温 ≥0℃ accumulated temperature |
|---|---|---|---|
| 豫北 North Henan | 2017 | 216 | 2345 |
| 2018 | 230 | 2269 | |
| 2019 | 73 | 2260 | |
| 2020 | 189 | 2404 | |
| 豫中 Central Henan | 2017 | 353 | 2479 |
| 2018 | 335 | 2404 | |
| 2019 | 158 | 2375 | |
| 2020 | 255 | 2552 | |
| 豫西 West Henan | 2017 | 260 | 2341 |
| 2018 | 328 | 2253 | |
| 2019 | 96 | 2324 | |
| 2020 | 256 | 2425 | |
| 豫南 South Henan | 2017 | 458 | 2251 |
| 2018 | 428 | 2154 | |
| 2019 | 271 | 2150 | |
| 2020 | 264 | 2354 |
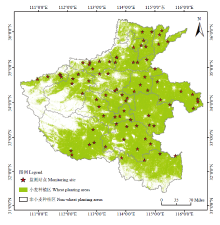
图1
84个监测点分布情况"
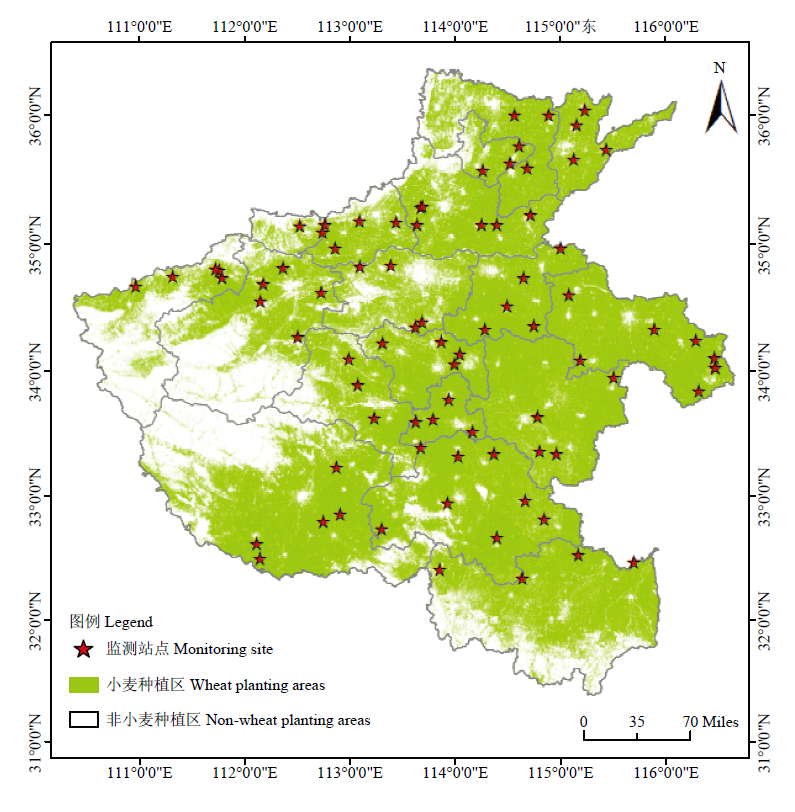

图2
河南省不同小麦产区2017—2020年产量差异情况 不同字母表示(P=0.05)差异显著。下同"
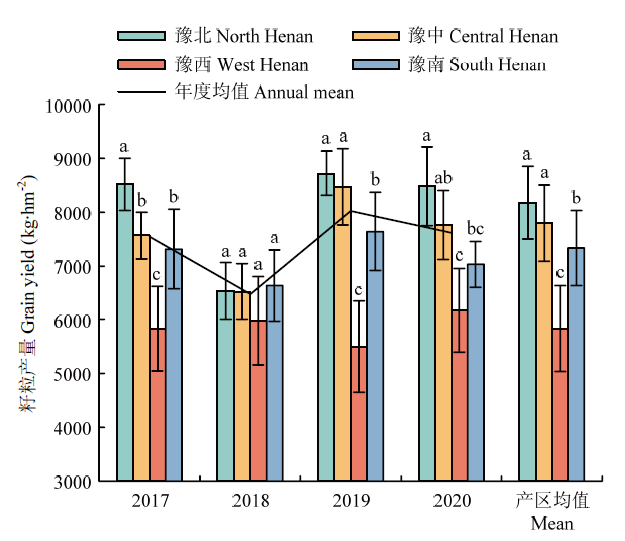

图3
河南省不同小麦产区2017—2020年穗数差异情况"
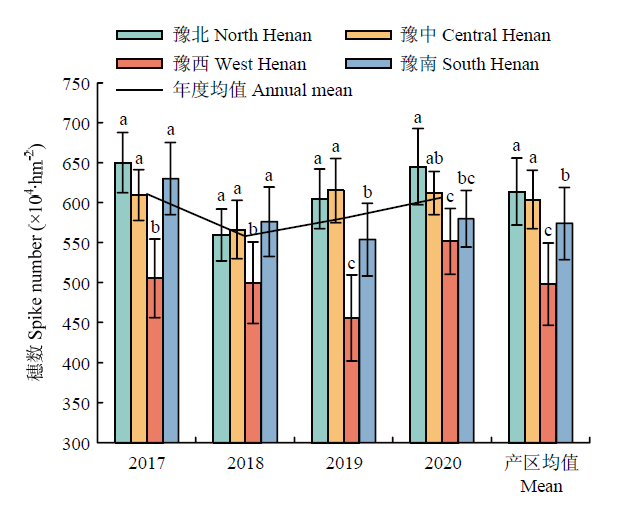

图4
河南省不同小麦产区2017—2020年穗粒数差异情况"
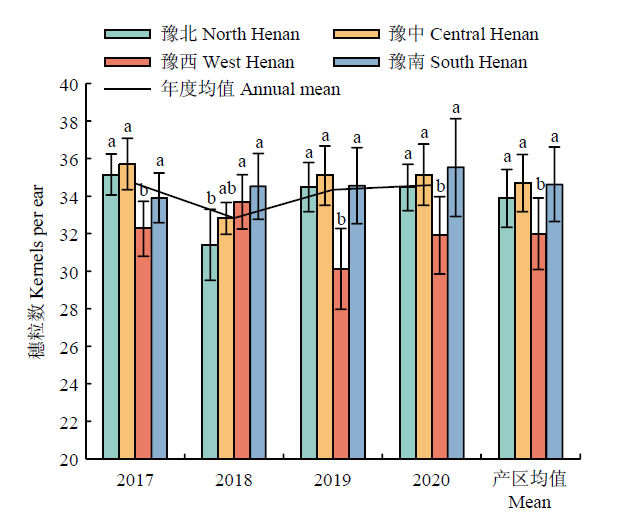
图5
河南省不同小麦产区2017—2020年千粒重差异情况"
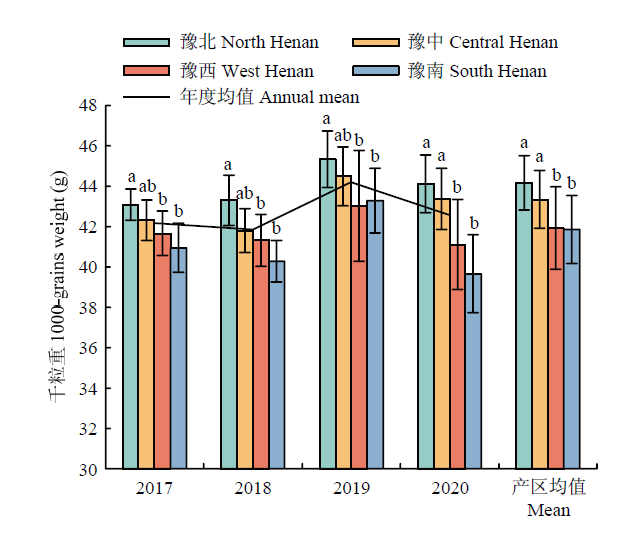
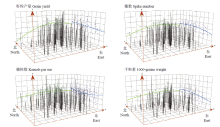
图6
2017—2020年小麦产量及产量构成要素趋势分析 图中黑色柱体表示监测点量的高低,绿色曲线为径向的变化趋势,蓝色为纬向"
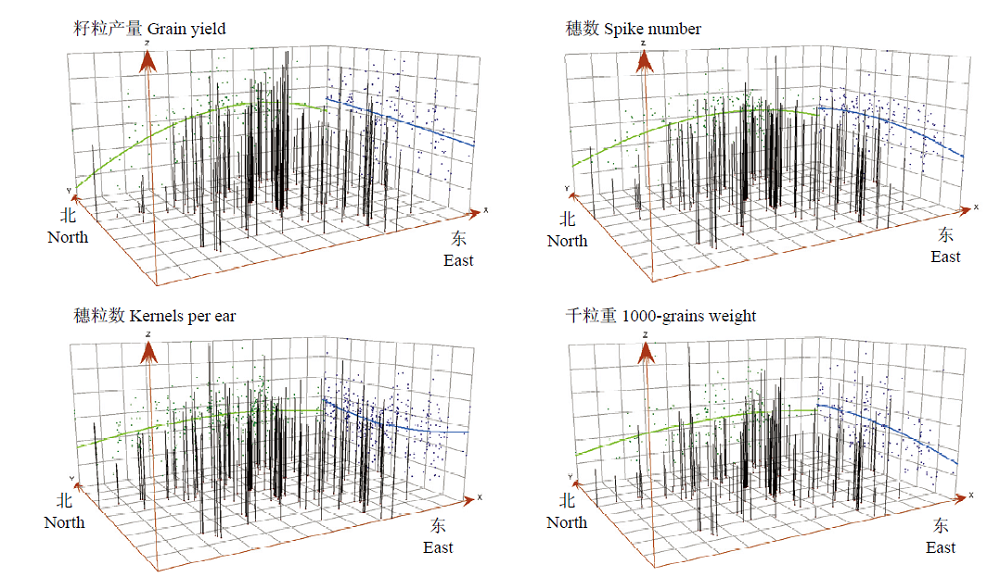

图7
2017—2020产量空间分布情况"
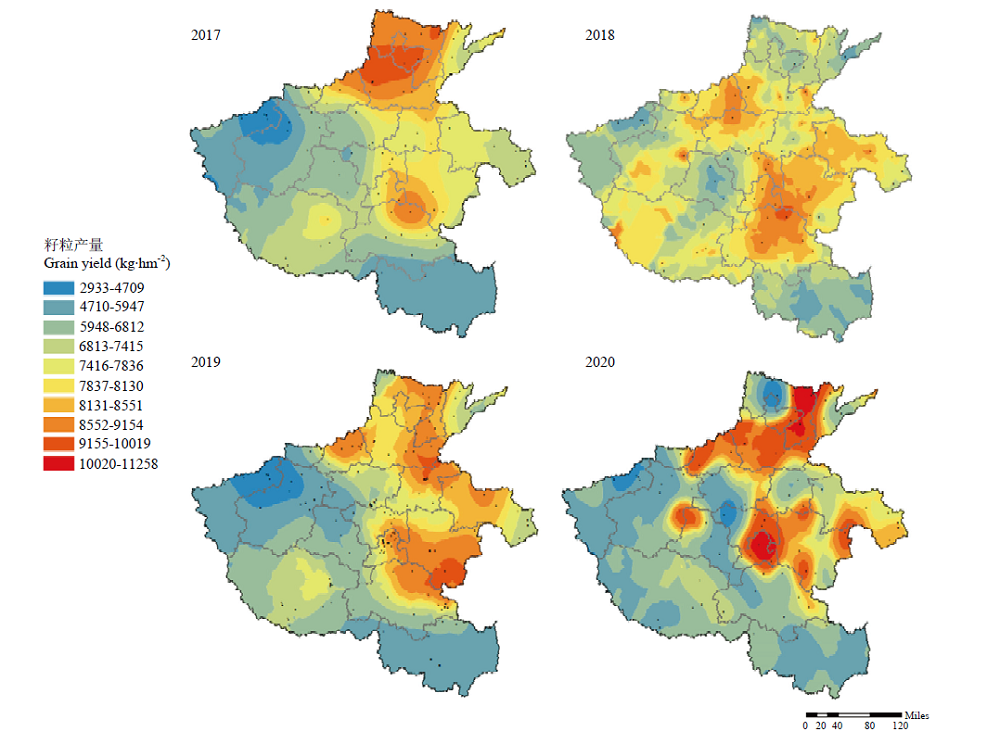
图8
2017—2020穗数空间分布情况"

图9
2017—2020年穗粒数空间分布情况"

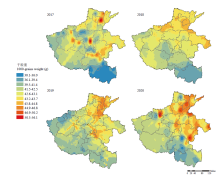
图10
2017—2020千粒重空间分布"

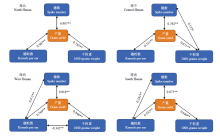
图11
不同产区籽粒产量与构成要素偏相关性分析 ↔表示相关性,其上数字为相关系数,*和**表示0.05、0.01水平上显著相关"

表3
不同产区籽粒产量与产量构成要素通径分析"
| 小麦产区 Wheat region | 自变量 Independent variable | 直接通径系数 Direct path coefficient | 间接通径系数 Indirect path coefficient | ||
|---|---|---|---|---|---|
| X1→y | X2→y | X3→y | |||
| 豫北 North Henan | X1 | 0.67 | — | -0.13 | 0.07 |
| X2 | 0.67 | -0.13 | — | -0.06 | |
| X3 | 0.39 | 0.13 | -0.10 | — | |
| 豫中 Central Henan | X1 | 0.54 | — | 0.00 | 0.07 |
| X2 | 0.48 | 0.00 | — | 0.02 | |
| X3 | 0.42 | 0.09 | 0.02 | — | |
| 豫西 West Henan | X1 | 0.69 | — | 0.15 | -0.01 |
| X2 | 0.39 | 0.28 | — | -0.15 | |
| X3 | 0.45 | -0.01 | -0.12 | — | |
| 豫南 South Henan | X1 | 0.60 | — | -0.14 | 0.00 |
| X2 | 0.52 | -0.19 | — | -0.04 | |
| X3 | 0.43 | 0.00 | -0.03 | — | |
| [1] | 中华人民共和国国家统计局. 中国统计年鉴. 北京: 中国统计出版社, 2019. |
| National Bureau of Statistics of the People's Republic of China. China Statistical Yearbook. Beijing: China Statistics Press, 2019. (in Chinese) | |
| [2] | 任思洋, 张青松, 李婷玉, 张福锁. 华北平原五省冬小麦产量和氮素管理的时空变异. 中国农业科学, 2019, 52(24):4527-4539. |
| REN S Y, ZHANG Q S, LI T Y, ZHANG F S. Spatiotemporal variation of winter wheat yield and nitrogen management in five provinces of North China Plain. Scientia Agricultura Sinica, 2019, 52(24):4527-4539. (in Chinese) | |
| [3] | 朱云集, 崔金梅, 郭天财, 王晨阳, 王永华. 河南省小麦生产发展中几个关键技术问题的商榷. 河南农业科学, 2011, 40(8):54-57. |
| ZHU Y J, CUI J M, GUO T C, WANG C Y, WANG Y H. Discussion of key technique problems in development of wheat production in Henan province. Journal of Henan Agricultural Sciences, 2011, 40(8):54-57. (in Chinese) | |
| [4] | 熊淑萍, 卢中民, 吴克远, 王严峰, 王静, 马新明. 河南省小麦和玉米产量及其有关气候因子分析. 河南农业大学学报, 2014, 48(2):123-129. |
| XIONG S P, LU Z M, WU K Y, WANG Y F, WANG J, MA X M. Analysis on yield of wheat and maize and related climate factors in Henan province. Journal of Henan Agricultural University, 2014, 48(2):123-129. (in Chinese) | |
| [5] | 李巧云, 年力, 刘万代, 李磊, 周苏玫, 尹钧. 冬前积温对河南省小麦冬生长发育的影响. 中国农业气象, 2010, 31(4):563-569. |
| LI Q Y, NIAN L, LIU W D, LI L, ZHOU S M, YIN J. Effects of accumulated temperature before winter on growth and development of wheat in Henan province. Chinese Journal of Agrometeorology, 2010, 31(4):563-569. (in Chinese) | |
| [6] | 朱艳, 汤亮, 刘蕾蕾, 刘兵, 张小虎, 邱小雷, 田永超, 曹卫星. 作物生长模型(CropGrow)研究进展. 中国农业科学, 2020, 53(16):3235-3256. |
| ZHU Y, TANG L, LIU L L, LIU B, ZHANG X H, QIU X L, TAIN Y C, CAO W X. Research progress on the crop growth model CropGrow. Scientia Agricultura Sinica, 2020, 53(16):3235-3256. (in Chinese) | |
| [35] | WANG R, TIAN Z G, QIU Z S, YU B Z. The effect of shanding on the number of grains per spike at different stages of floret development in wheat. Acta Agronomica Sinica, 1981, 7(3):157-163. (in Chinese) |
| [36] |
郭翠花, 高志强, 苗果园. 花后遮阴对小麦旗叶光合特性及籽粒产量和品质的影响. 作物学报, 2010, 36(4):673-679.
doi: 10.3724/SP.J.1006.2010.00673 |
|
GUO C H, GAO Z Q, MIAO G Y. Effect of shading at post flowering on photosynthetic characteristics of flag leaf and response of grain yield and quality to shading in wheat. Acta Agronomica Sinica, 2010, 36(4):673-679. (in Chinese)
doi: 10.3724/SP.J.1006.2010.00673 |
|
| [37] |
BRUCKNER P L, FROHBERG R C. Stress tolerance and adaptation in spring wheat. Crop Science, 1987, 27(1):31-36.
doi: 10.2135/cropsci1987.0011183X002700010008x |
| [7] | 阎守邕, 肖春生, 田青, 周艺, 王世新. 中国农业统计地理信息系统及其应用研究. 遥感学报, 1997, 1(2):152-156,162. |
| YAN S Y, XIAO C S, TIAN Q, ZHOU Y, WANG S X. Chinese agricultural statistical geographic information system and its application. Journal of Remote Sensing, 1997, 1(2):152-156, 162. (in Chinese) | |
| [38] | 王万里, 林芝萍, 章秀英, 吴亚华. 灌浆—成熟期间土壤干旱对小麦籽粒充实和物质运转的影响. 植物生理学报, 1982, 8(1):67-80. |
| WANG W L, LIN Z P, ZHANG X Y, WU Y H. On the effect of soil drought during the period from the end of flowering to ripening on the grain filling and matter translocation in the wheat plant. Physiology and Molecular Biology of Plants, 1982, 8(1):67-80. (in Chinese) | |
| [39] | 郭星宇, 王浩, 于琦, 王瑞, 王小利, 李军. 耕作对渭北旱塬小麦-玉米轮作田土壤水分和产量的影响. 中国农业科学, 2021, 54(14):2977-2990. |
| GUI X Y, WANG H, YU Q, WANG R, WANG X L, LI J. Effects of tillage on soil moisture and yield of wheat-maize rotation field in Weibei Upland Plateau. Scientia Agricultura Sinica, 2021, 54(14):2977-2990. (in Chinese) | |
| [8] | 潘学标. 基于GIS的中国作物生产信息系统研究. 中国农业科学, 2000, 33(2):110. |
| PAN X B. Research on the China 's crop production information system based on GIS. Scientia Agricultura Sinica, 2000, 33(2):110. (in Chinese) | |
| [9] | 党安荣, 阎守邕, 肖春生. 地理信息系统在中国粮食总产空间变化研究中的应用. 遥感学报, 1998, 2(3):228-233. |
| DANG A R, YAN S Y, XIAO C S. Application of geographic information system in the study of spatial change of total grain yield in China. Journal of Remote Sensing, 1998, 2(3):228-233. (in Chinese) | |
| [40] | 黄明, 吴金芝, 李友军, 姚宇卿, 张灿军, 蔡典雄, 金轲. 不同耕作方式对旱作冬小麦旗叶衰老和籽粒产量的影响. 应用生态学报, 2009, 20(6):1355-1361. |
| HUANG M, WU J Z, LI Y J, YAO Y Q, ZHANG C J CAI D X, JIN K. Effects of tillage pattern on the flag leaf senescence and grain yield of winter wheat under dry farming. Chinese Journal of Applied Ecology, 2009, 20(6):1355-1361. (in Chinese) | |
| [41] | 谢迎新, 靳海洋, 孟庆阳, 王永华, 王晨阳, 贺德先, 郭天财. 深耕改善砂姜黑土理化性状提高小麦产量. 农业工程学报, 2015, 31(10):167-173. |
| XIE Y X, JIN H Y, MENG Q Y, WANG Y H, WANG C Y, HE D X, GUO T C. Deep tillage improving physical and chemical properties of soil and increasing grain yield of winter wheat in lime concretion black soil farmland. Transactions of the Chinese Society of Agricultural Engineering, 2015, 31(10):167-173. (in Chinese) | |
| [42] | 于振文. 小麦产量与品质生理及栽培技术, 北京: 中国农业出版社, 2006: 13-57. |
| YU Z W. Physiological and Cultivation Techniques of Wheat Yield and Quality. Beijing: China Agriculture Press, 2006: 13-57. (in Chinese) | |
| [43] | 张娟, 崔党群, 范平, 宋保谦. 小麦冠层结构与产量及其构成因素的典范相关分析. 华北农学报, 2000, 15(3):39-44. |
| ZHANG J, CUI D Q, FAN P, SONG B Q. Canonical correlations analysis between the canopy structures and yield with its components in wheat. Acta Agriculturae Boreali-Sinica, 2000, 15(3):39-44. (in Chinese) | |
| [44] | 张明响. 黄淮麦区不同小麦品种的产量及其相关因素分析[D]. 中国农业科学院, 2013. |
| ZHANG M X. Analysis of different wheat varieties yield and its related factors in Huanghuai wheat area[D]. Chinese Academy of Agricultural Sciences, 2013. (in Chinese) | |
| [45] | 王绍中, 赵虹, 王西成, 范和君, 田云峰. 小麦超高产品种筛选的研究初报. 作物学报, 1998, 24(6):870-875. |
| WANG S Z, ZHAO H, WANG X C, FAN H J, TIAN Y F. The preliminary research report on screening of new wheat varieties with super-high-yield. Acta Agronomica Sinica, 1998, 24(6):870-875. (in Chinese) | |
| [46] | 周延辉, 朱新开, 郭文善, 封超年. 稻茬小麦中高产水平下产量及其构成因素分析. 麦类作物学报, 2018, 38(3):293-297. |
| ZHOU Y H, ZHU X K, GUO W S, FENG C N. Analysis of yield and yield components of wheat after rice on medium-high- yielding level. Journal of Triticeae Crops, 2018, 38(3):293-297. (in Chinese) | |
| [10] | 马新明, 张浩, 熊淑萍, 许鑫, 赵巧梅. 基于GIS技术的河南粮食核心区小麦玉米区域潜力研究. 农业工程学报, 2010, 26(s1):162-168. |
| MA X M, ZHANG H, XIONG S P, XU X, ZHAO Q M. Potential productivity of wheat and maize in grain production center of Henan province based on GIS. Transactions of the Chinese Society of Agricultural Engineering, 2010, 26(s1):162-168. (in Chinese) | |
| [11] |
ARA SAARIKKO. Applying a site based crop model to estimate regional yields under current and changed climates. Ecological Modelling, 2000, 131(2/3):191-206.
doi: 10.1016/S0304-3800(00)00257-X |
| [12] | 张浩, 席磊, 许鑫, 高瑞, 马新明, 尹钧. 基于GIS的县域小麦自然生产潜力评价系统. 农业工程学报, 2009, 25(12):198-205, 402. |
| ZHANG H, XI L, XU X, GAO R, MA X M, YIN J. Evaluation system of wheat natural potential productivity at county scale based on GIS. Transactions of the Chinese Society of Agricultural Engineering, 2009, 25(12):198-205, 402. (in Chinese) | |
| [13] |
WU D R, YU Q, LU C H, HUI B. Quantifying production potentials of winter wheat in the North China Plain. European Journal of Agronomy, 2006, 24(3):226-235.
doi: 10.1016/j.eja.2005.06.001 |
| [14] | 孙丽娟, 胡学旭, 陆伟, 王步军. 基于GIS的小麦籽粒品质空间分布特征和影响因子分析. 中国农业科学, 2018, 51(5):999-1011. |
| SUN L J, HU X X, LU W, WANG B J. Spatial distribution characteristics of wheat grain quality and analysis of factors based on GIS. Scientia Agricultura Sinica, 2018, 51(5):999-1011. (in Chinese) | |
| [15] | 石晓燕, 汤亮, 刘小军, 曹卫星, 朱艳. 基于模型和GIS的小麦空间生产力预测研究. 中国农业科学, 2009, 42(11):3828-3835. |
| SHI X Y, TANG L, LIU X J, CAO W X, ZHU Y. Predicting spatial productivity in wheat based on model and GIS. Scientia Agricultura Sinica, 2009, 42(11):3828-3835. (in Chinese) | |
| [16] | 黄芬, 朱艳, 姜东, 荆奇, 曹卫星. 基于模型与GIS的小麦籽粒品质空间差异分析. 中国农业科学, 2009, 42(9):3087-3095. |
| HUANG F, ZHU Y, JIANG D, JING Q, CAO W X. Spatial variation analysis of wheat grain quality based on model and GIS. Scientia Agricultura Sinica, 2009, 42(9):3087-3095. (in Chinese) | |
| [17] | 熊宗伟, 顾生浩, 毛丽丽, 王雪姣, 张立祯, 周治国. 中国棉花纤维品质和气候因子的空间分布特征. 应用生态学报, 2012, 23(12):3385-3392. |
| XIONG Z W, GU S H, MAO L L, WANG X J, ZHANG L Z, ZHOU Z G. Spatial distribution characteristics of China cotton fiber quality and climatic factors based on GIS. Chinese Journal of Applied Ecology, 2012, 23(12):3385-3392. (in Chinese) | |
| [18] | 卢洋洋, 张影全, 刘锐, 赵酒林, 杨春玲, 盛坤, 董昀, 侯军红, 魏益民. 豫北小麦籽粒质量性状空间变异特征. 麦类作物学报, 2014, 34(4):495-501. |
| LU Y Y, ZHANG Y Q, LIU R, ZHAO J L, YANG C L, SEHNG K, DONG J, HOU J H, WEI Y M. Spatial variation analysis of grain quality parments of wheat grown in north Henan. Journal of Triticeae Crops, 2014, 34(4):495-501. (in Chinese) | |
| [19] | 郭洪海, 杨丽萍, 李新华, 杨萍, 万书波. 黄淮海区域花生生产与品质特征的研究. 中国生态农业学报, 2010, 18(6):1233-1238. |
| GUO H M, YANG L P, LI X H, YANG P, WANG S B. Characteristics of production and quality of peanut in Huang-Huai-Hai region. Chinese Journal of Eco-Agriculture, 2010, 18(6):1233-1238. (in Chinese) | |
| [20] | WANG S Z. Suitable planting density for wheat dultivation from the donsideration of yield components. Journal of Integrative Plant Biology, 1973(1):83-94. |
| [21] | 王之杰, 郭天财, 王化岑, 王永华. 种植密度对超高产小麦生育后期光合特性及产量的影响. 麦类作物学报, 2001, 21(3):64-67. |
| WANG Z J, GUO T C, WANG H C, WANG Y H. Effect of planting density on photosynthetic charactertics and grain yield of super-high- yield winter wheat at late growth stages. Journal of Triticeae Crops, 2001, 21(3):64-67. (in Chinese) | |
| [22] | 韩雪冰. 不同小麦新品系(品种)主要农艺性状与产量的研究[D]. 杨凌: 西北农林科技大学, 2017. |
| HAN X B. The studies on the main agronomic characters and yield of the new wheat lines[D]. Yangling: Northwest A & F University, 2017. (in Chinese) | |
| [23] | 田纪春, 邓志英, 胡瑞波, 王延训. 不同类型超级小麦产量构成因素及籽粒产量的通径分析. 作物学报, 2006, 32(11):1699-1705. |
| TIAN J C, DENG Z Y, HU R B, WANG Y X. Yield components of super wheat cultivars with different types and the path coefficient analysis on grain yield. Acta Agronomica Sinica, 2006, 32(11):1699-1705. (in Chinese) | |
| [24] | 金艳, 宋佳静, 朱统泉, 陈杰, 赵立尚. 2001-2015年河南省审定小麦品种产量构成分析. 中国种业, 2016(4):41-44. |
| JIN Y, SONG J J, ZHU T Q, CHEN J, ZHAO L S. Yield composition analysis of certified wheat varieties in Henan province from 2001 to 2015. China Seed Industry, 2016(4):41-44. (in Chinese) | |
| [25] | 冯素伟, 姜小苓, 胡铁柱, 丁位华, 茹振钢, 王科翰. 超高产小麦品种产量构成因素及增产途径分析. 河南科技学院学报(自然科学版), 2013, 41(3):1-5. |
| FENG S W, JIANG X L, HU T Z, DING W H, RU Z G, WANG K H. Analysis on yield components and yield increasing ways of supper-high yield winter wheat. Journal of Henan Institute of Science and Technology, 2013, 41(3):1-5. (in Chinese) | |
| [26] | 杨程, 李向东, 张德奇, 王汉芳, 邵运辉, 方保停, 岳俊芹, 马富举, 秦峰. 小麦产量三要素与产量的通径和灰色关联度分析. 河南农业科学, 2016, 45(10):19-23. |
| YANG C, LI X D, ZHANG D Q, WANG H F, SHAO Y H, FANG B T, YU J Q, MA F J, QIN F. Grey relational analysis and path analysis on wheat yield and its three key factors. Journal of Henan Agricultural Sciences, 2016, 45(10):19-23. (in Chinese) | |
| [27] | 胡廷积, 尹钧. 小麦生态栽培, 北京: 科学出版社, 2014: 193-235. |
| HU T J, YIN J. Ecological Cultivation of Wheat. Beijing: Science Press, 2014: 193-235. (in Chinese) | |
| [28] | 杜家菊, 陈志伟. 使用SPSS线性回归实现通径分析的方法. 生物学通报, 2010, 45(2):4-6. |
| DU J J, CHEN Z W. Using SPSS linear regression to achieve path analysis method. Biological Bulletin, 2010, 45(2):4-6. (in Chinese) | |
| [29] | 唐启义, 冯明光. 实用统计分析及DPS数据处理系统. 北京: 科学出版社, 2002. |
| TANG Q Y, FENG M G. Practical Statistical Analysis and DPS Data Processing System. Beijing: Science Press, 2002. (in Chinese) | |
| [30] | 汤国安, 杨昕. ArcGIS地理信息系统空间分布实验教程.2版. 北京: 科学出版社, 2012: 448-472. |
| TANG G A, YANG X. ArcGIS Geographic Information System Spatial Analysis Experimentation. 2nd edition. Beijing: Science Press, 2012: 448-472. (in Chinese) | |
| [31] | 卢洋洋. 区域小麦籽粒质量及空间变异研究[D]. 中国农业科学院, 2014. |
| LU Y Y. Studies on the wheat kernel quality and its spatial variability in district level[D]. Chinese Academy of Agricultural Sciences, 2014. (in Chinese) | |
| [32] | 王连喜, 卢媛媛, 李琪, 胡正华, 吴东丽, 张阳, 王田. 基于AEZ模型的河南省冬小麦产量差时空特征分析. 中国生态农业学报, 2018, 26(4):547-558. |
| WANG L X, LU Y Y, LI Q, HU Z H, WU D L, ZHANG Y, WANG T. Spatio-temporal analysis of winter wheat yield gaps in Henan province using AEZ model. Chinese Journal of Eco-Agriculture, 2018, 26(4):547-558. (in Chinese) | |
| [33] | 李巧云, 李磊, 刘万代, 周苏梅, 尹钧. 河南省小麦产量及其构成因素变化规律分析. 河南农业科学, 2011, 40(4):38-40. |
| LI Q Y, LI L, LIU W D, ZHOU S M, YIN J. Analyses of yield and its composition property of wheat in Henan province. Journal of Henan Agricultural Sciences, 2011, 40(4):38-40. (in Chinese) | |
| [34] | 马新明, 张浩, 熊淑萍, 许鑫, 赵巧梅. 基于GIS技术的河南粮食核心区小麦玉米区域潜力研究. 农业工程学报, 2010, 26(S1):162-168. |
| MA X M, ZHANG H, XIONG S P, XU X, ZHAO Q M, Potential productivity of wheat and maize in grain production center of Henan province based on GIS. Transactions of the Chinese Society of Agricultural Engineering, 2010, 26(S1):162-168. (in Chinese) | |
| [35] | 王沅, 田正国, 邱泽生, 余蓓珍. 小麦小花发育不同时期遮光对穗粒数的影响. 作物学报, 1981, 7(3):157-163. |
| [1] | 韩紫璇, 房静静, 武雪萍, 姜宇, 宋霄君, 刘晓彤. 长期秸秆配施化肥下土壤团聚体碳氮分布、微生物量与小麦产量的协同效应[J]. 中国农业科学, 2023, 56(8): 1503-1514. |
| [2] | 严艳鸽, 张水勤, 李燕婷, 赵秉强, 袁亮. 葡聚糖改性尿素对冬小麦产量和肥料氮去向的影响[J]. 中国农业科学, 2023, 56(2): 287-299. |
| [3] | 徐久凯, 袁亮, 温延臣, 张水勤, 李燕婷, 李海燕, 赵秉强. 畜禽有机肥氮在冬小麦季对化肥氮的相对替代当量[J]. 中国农业科学, 2023, 56(2): 300-313. |
| [4] | 严艳鸽, 张水勤, 李燕婷, 赵秉强, 袁亮. 葡聚糖改性磷肥对冬小麦产量和肥料利用率的影响[J]. 中国农业科学, 2023, 56(12): 2317-2328. |
| [5] | 郑凤君, 王雪, 李生平, 刘晓彤, 刘志平, 卢晋晶, 武雪萍, 席吉龙, 张建诚, 李永山. 免耕覆盖下土壤水分、团聚体稳定性及其有机碳分布对小麦产量的协同效应[J]. 中国农业科学, 2021, 54(3): 596-607. |
| [6] | 王新媛,赵思达,郑险峰,王朝辉,何刚. 秸秆还田和氮肥用量对冬小麦产量和氮素利用的影响[J]. 中国农业科学, 2021, 54(23): 5043-5053. |
| [7] | 徐久凯,袁亮,温延臣,张水勤,林治安,李燕婷,李海燕,赵秉强. 畜禽有机肥磷素在冬小麦上替代化肥磷当量研究[J]. 中国农业科学, 2021, 54(22): 4826-4839. |
| [8] | 王钧,李广,闫丽娟,刘强,聂志刚. 旱地春小麦产量对不同生育阶段温度变化的响应模拟[J]. 中国农业科学, 2020, 53(5): 904-916. |
| [9] | 李世景, 徐萍, 张正斌, 卫云宗. 黄淮旱地冬小麦农艺性状与生育期气象因子的时空分布特征及互作关系[J]. 中国农业科学, 2019, 52(10): 1686-1697. |
| [10] | 金修宽,马茂亭,赵同科,安志装,姜玲玲. 测墒补灌和施氮对冬小麦产量及水分、氮素利用效率的影响[J]. 中国农业科学, 2018, 51(7): 1334-1344. |
| [11] | 高美玲,张旭博,孙志刚,孙楠,李仕冀,高永华,张崇玉. 中国不同气候区小麦产量及发育期持续时间对田间增温的响应[J]. 中国农业科学, 2018, 51(2): 386-400. |
| [12] | 郭尔静,杨晓光,王晓煜,张天一,黄晚华,刘子琪,Tao Li. 湖南省双季稻产量差时空分布特征[J]. 中国农业科学, 2017, 50(2): 399-412. |
| [13] | 李超,刘文兆,林文,韩晓阳,周玲,王亚萍. 黄土塬区冬小麦产量及水分利用效率对播前底墒变化与生育期差别供水的响应[J]. 中国农业科学, 2017, 50(18): 3549-3560. |
| [14] | 安婷婷,侯小畔,周亚男,刘卫玲,王群,李潮海,张学林. 氮肥用量对小麦开花后根际土壤特性和产量的影响[J]. 中国农业科学, 2017, 50(17): 3352-3364. |
| [15] | 杨绚1, 汤绪2, 陈葆德3, 田展4, 赵思健5. 利用CMIP5多模式集合模拟气候变化对中国小麦产量的影响[J]. 中国农业科学, 2014, 47(15): 3009-3024. |
|
||