


中国农业科学 ›› 2020, Vol. 53 ›› Issue (18): 3679-3692.doi: 10.3864/j.issn.0578-1752.2020.18.005
项方林( ),李鑫格,马吉锋,刘小军,田永超,朱艳,曹卫星,曹强()
收稿日期:2019-12-09
接受日期:2020-03-12
出版日期:2020-09-16
发布日期:2020-09-25
联系方式:
项方林,E-mail: 2017101003@njau.edu.cn。
基金资助:
XIANG FangLin(),LI XinGe,MA JiFeng,LIU XiaoJun,TIAN YongChao,ZHU Yan,CAO WeiXing,CAO Qiang()
Received:2019-12-09
Accepted:2020-03-12
Published:2020-09-16
Online:2020-09-25
摘要:
【目的】研究冬小麦冠层时序植被指数的动态变化规律并基于其构建单产预测模型,为田间实时、准确获取作物单产信息提供有效的技术手段。【方法】本研究于2017—2019年在江苏省兴化市万亩粮食产业园开展不同品种及氮肥水平的田间小区试验,利用主动传感器RapidSCAN CS-45获取冠层归一化红边植被指数(normalized difference red edge,NDRE)和归一化植被指数(normalized difference vegetation index,NDVI),基于双Logistic函数拟合时序植被指数并提取曲线特征参数,进而分析各特征参数与单产的相关关系,并以独立试验数据对单产预测模型进行验证。【结果】NDRE在孕穗期和抽穗期与单产关系最好,R2达到0.84以上;通过多元逐步线性回归法发现,利用2个或多个时期NDRE预测单产的效果较单生育时期有所提高,且第一和第二被选择的时期分别为拔节期和孕穗期。基于全生育时期相对NDRE(relative NDRE,RNDRE)和相对NDVI(relative NDVI,RNDVI)构建时序曲线,并利用曲线特征参数建立单产预测模型,其中RNDRE和RNDVI的最大值、累积值及增长速率与单产关系较好。利用独立试验数据对上述单产预测模型进行检验,结果表明基于RNDRE时序曲线最大值和累积值所构建的单产模型验证效果较好,R2大于0.80,相对均方根误差和相对误差均小于10%,其验证效果优于单时期或多时期基于NDRE的预测模型,且优于基于NDVI构建的单产模型。【结论】基于冠层时序植被指数提取的特征参数RNDRE最大值和累积RNDRE具有良好估测单产的潜力,研究结果为田间进行实时、准确预测冬小麦单产提供了技术支持。
项方林,李鑫格,马吉锋,刘小军,田永超,朱艳,曹卫星,曹强. 基于冠层时序植被指数的冬小麦单产预测[J]. 中国农业科学, 2020, 53(18): 3679-3692.
XIANG FangLin,LI XinGe,MA JiFeng,LIU XiaoJun,TIAN YongChao,ZHU Yan,CAO WeiXing,CAO Qiang. Using Canopy Time-Series Vegetation Index to Predict Yield of Winter Wheat[J]. Scientia Agricultura Sinica, 2020, 53(18): 3679-3692.
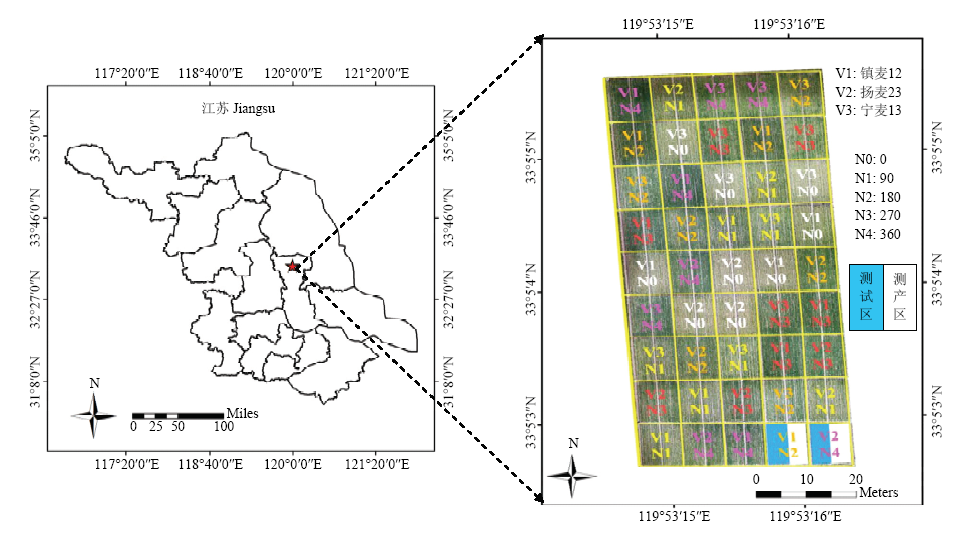
图1
试验1田块分布图"
表1
不同生育时期植被指数与冬小麦单产的相关关系"
| 植被指数 Vegetation index | 品种 Variety | 样本 Sample | 拔节期 Jointing stage | 孕穗期 Booting stage | 抽穗期 Heading stage | 开花期 Flowering stage | 灌浆期 Filling stage |
|---|---|---|---|---|---|---|---|
| NDRE | 镇麦12 Zhenmai 12 | 30 | 0.66 | 0.89 | 0.88 | 0.86 | 0.89 |
| 扬麦23 Yangmai 23 | 30 | 0.46 | 0.83 | 0.82 | 0.75 | 0.84 | |
| 宁麦13 Ningmai 13 | 30 | 0.72 | 0.92 | 0.92 | 0.91 | 0.91 | |
| 所有品种 All | 90 | 0.60 | 0.86 | 0.85 | 0.81 | 0.81 | |
| NDVI | 镇麦12 Zhenmai 12 | 30 | 0.62 | 0.79 | 0.81 | 0.84 | 0.83 |
| 扬麦23 Yangmai 23 | 30 | 0.54 | 0.79 | 0.75 | 0.77 | 0.75 | |
| 宁麦13 Ningmai 13 | 30 | 0.81 | 0.86 | 0.81 | 0.84 | 0.85 | |
| 所有品种 All | 90 | 0.63 | 0.79 | 0.77 | 0.80 | 0.76 |
表2
基于多元逐步线性回归基的不同生育时期植被指数单产预测模型"
| 植被指数 Vegetation index | 回归方程 Regression equation | 决定系数 R2 | 相对均方根误差 RRMSE (%) | 相对误差 RE (%) | 赤池信息准则 AIC |
|---|---|---|---|---|---|
| NDRE | y= -2.16x1+16.83x2+9.15x3-4.40x4-2.35x5-0.75 | 0.86 | 8.98 | 9.82 | -97.95 |
| y= -2.85x1+17.69x2+5.67x3-3.23x5-0.90 | 0.86 | 8.99 | 9.84 | -99.74 | |
| y= -2.54x1+21.94x2-2.14x5-0.81 | 0.86 | 9.02 | 9.82 | -101.37 | |
| y= -2.53x1+19.90x2-0.75 | 0.86 | 9.02 | 9.84 | -103.01 | |
| NDVI | y=0.14x1+11.23x2-13.22x3+23.12x4-3.57x5-8.31 | 0.81 | 10.41 | 11.70 | -71.45 |
| y=11.25x2-13.36x3+23.27x4-3.38x5-8.36 | 0.81 | 10.40 | 11.76 | -73.44 | |
| y=12.21x2-14.79x3+19.45x4-7.45 | 0.81 | 10.43 | 11.62 | -74.96 |
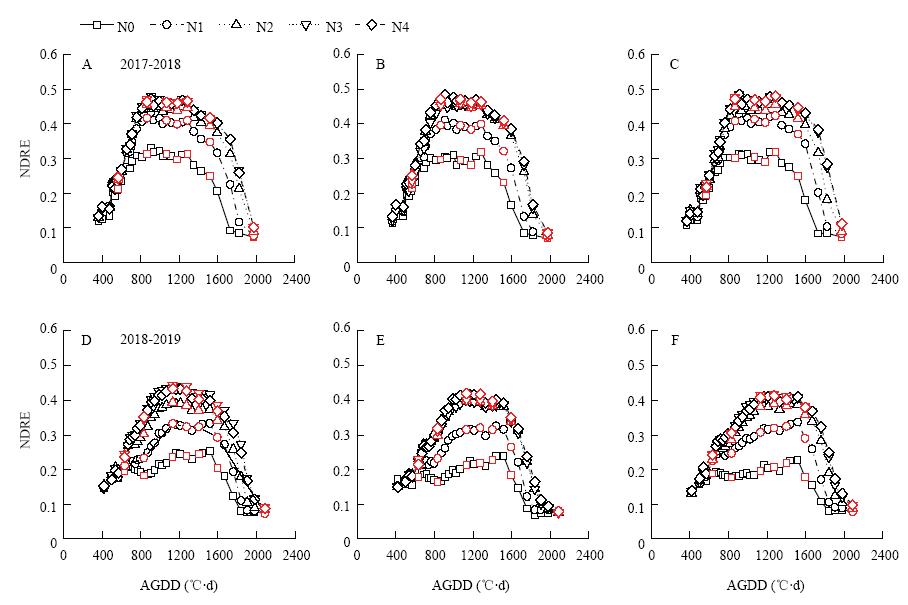
图2
不同氮素水平下基于AGDD的NDRE变化动态 红色的点表示返青期、拔节期、孕穗期、抽穗期、开花期、灌浆期和成熟期的测试。A:镇麦12;B:扬麦23;C:宁麦13;D:镇麦12;E:扬麦23;F:宁麦13。下同"
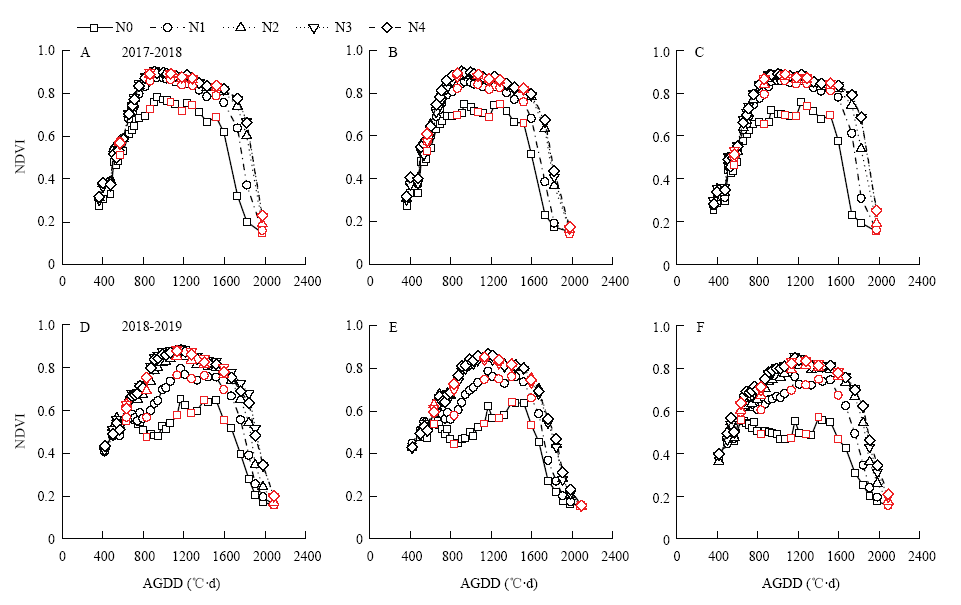
图3
不同氮素水平下基于AGDD的NDVI变化动态"
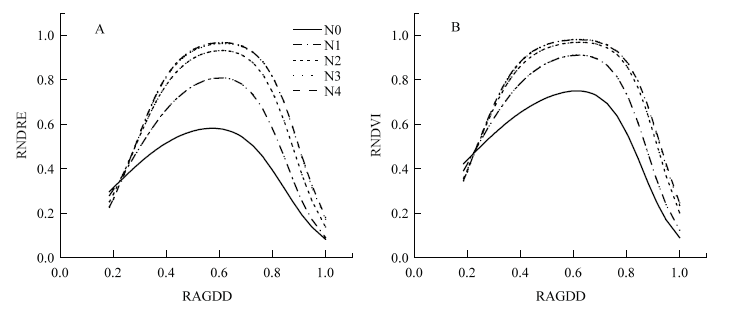
图4
不同氮素水平下RNDRE(A)和RNDVI(B)时序曲线变化动态"
表3
不同氮处理下基于RAGDD的时序RNDRE和RNDVI曲线拟合参数"
| 植被指数 Vegetation index | 氮处理 N treatment | 曲线参数 Parameters of curves | 决定系数 R2 | 均方根误差 RMSE | |||||
|---|---|---|---|---|---|---|---|---|---|
| A1 | A2 | a | b | c | d | ||||
| RNDRE | N0 | 0.655 | 0.506 | 7.10 | 0.21 | 11.84 | 0.84 | 0.78 | 0.066 |
| N1 | 0.876 | 0.714 | 8.97 | 0.27 | 14.25 | 0.85 | 0.91 | 0.063 | |
| N2 | 0.969 | 0.791 | 11.42 | 0.28 | 15.04 | 0.88 | 0.96 | 0.047 | |
| N3 | 0.988 | 0.786 | 12.74 | 0.28 | 15.51 | 0.90 | 0.97 | 0.043 | |
| N4 | 0.995 | 0.788 | 12.70 | 0.28 | 15.10 | 0.90 | 0.97 | 0.043 | |
| RNDVI | N0 | 0.837 | 0.668 | 5.85 | 0.18 | 14.29 | 0.86 | 0.79 | 0.082 |
| N1 | 0.956 | 0.785 | 8.80 | 0.23 | 15.70 | 0.88 | 0.91 | 0.062 | |
| N2 | 0.987 | 0.776 | 11.59 | 0.23 | 16.60 | 0.92 | 0.94 | 0.053 | |
| N3 | 0.997 | 0.760 | 12.29 | 0.24 | 16.22 | 0.93 | 0.96 | 0.044 | |
| N4 | 0.996 | 0.754 | 12.46 | 0.24 | 15.84 | 0.93 | 0.95 | 0.045 | |
表4
不同氮素水平下RNDRE和RNDVI时序曲线特征参数"
| 氮处理 N treatment | RNDRE | RNDVI | |||||||
|---|---|---|---|---|---|---|---|---|---|
| 最大值 Maximum | 累积值 Accumulative value | 增长速率 Increase rate | 下降速率 Decrease rate | 最大值 Maximum | 累积值 Accumulative value | 增长速率 Increase rate | 下降速率 Decrease rate | ||
| N0 | 0.582 | 0.349 | 0.721 | 1.187 | 0.750 | 0.456 | 0.772 | 1.693 | |
| N1 | 0.809 | 0.464 | 1.245 | 1.841 | 0.911 | 0.558 | 1.186 | 2.091 | |
| N2 | 0.931 | 0.550 | 1.598 | 2.037 | 0.968 | 0.623 | 1.396 | 2.039 | |
| N3 | 0.963 | 0.580 | 1.731 | 2.028 | 0.981 | 0.637 | 1.452 | 1.983 | |
| N4 | 0.968 | 0.583 | 1.737 | 2.018 | 0.980 | 0.639 | 1.488 | 1.885 | |
表5
基于RNDRE和RNDVI时序曲线特征参数的冬小麦单产预测模型"
| 植被指数 Vegetation index | 特征参数 Characteristic parameter | 单产预测模型 Yield prediction model | R2 | RRMSE (%) | RE (%) | AIC |
|---|---|---|---|---|---|---|
| RNDRE | 最大值 Maximum | y = 8.72x - 1.37 | 0.80 | 10.2 | 12.9 | 62.29 |
| 累积值 Accumulative value | y = 14.39x - 1.22 | 0.82 | 9.9 | 12.9 | 60.41 | |
| 增长速率 Increase rate | y = 3.32x + 1.38 | 0.82 | 9.9 | 12.8 | 60.35 | |
| 下降速率 Decrease rate | y = 3.73x - 0.75 | 0.73 | 12.0 | 14.3 | 71.98 | |
| RNDVI | 最大值 Maximum | y = 14.24x - 7.03 | 0.77 | 11.0 | 13.4 | 66.48 |
| 累积值 Accumulative value | y = 18.24x - 4.58 | 0.80 | 10.2 | 12.9 | 62.18 | |
| 增长速率 Increase rate | y = 4.82x - 0.02 | 0.81 | 10.2 | 12.8 | 61.84 | |
| 下降速率 Decrease rate | y = 5.04x - 3.72 | 0.22 | 20.3 | 25.6 | 103.41 |
表6
基于NDRE和NDVI的冬小麦单产预测模型验证结果"
| 植被指数 Vegetation index | 模型 Model | 单产预测模型 Yield prediction model | R2 | RRMSE (%) | RE (%) |
|---|---|---|---|---|---|
| RNDRE | 单生育时期线性回归单产模型 Yield model based on linear regression in single growth stage | 拔节期 Jointing y=12.47x+1.67 | 0.59 | 24.3 | 23.5 |
| 孕穗期 Booting y =17.34x-0.65 | 0.79 | 18.7 | 18.2 | ||
| 抽穗期 Heading y =17.46x-0.73 | 0.77 | 17.4 | 16.6 | ||
| 开花期 Flowering y =17.97x-0.87 | 0.79 | 17.7 | 16.7 | ||
| 灌浆期 Filling y =17.46x+0.13 | 0.71 | 15.5 | 14.4 | ||
| 多元逐步线性回归模型 Yield model based on stepwise multiple linear regression | y= -2.16x1+16.83x2+9.15x3-4.40x4-2.35x5-0.75 | 0.81 | 17.6 | 17.3 | |
| y= -2.85x1+17.69x2+5.67x3-3.23x5-0.90 | 0.80 | 17.8 | 17.6 | ||
| y= -2.54x1+21.94x2-2.14x5-0.81 | 0.78 | 18.3 | 18.2 | ||
| y= -2.53x1+19.90x2-0.75 | 0.79 | 17.7 | 17.4 | ||
| RNDVI | 单生育时期线性回归单产模型 Yield model based on linear regression in single growth stage | 拔节期 Jointing y = 8.8027x - 0.4221 | 0.56 | 14.2 | 17.2 |
| 孕穗期 Booting y = 11.822x - 3.4517 | 0.73 | 13.6 | 14.4 | ||
| 抽穗期 Heading y = 12.877x - 4.3125 | 0.68 | 16.1 | 17.4 | ||
| 开花期 Flowering y = 17.707x - 8.1348 | 0.73 | 17.5 | 19.5 | ||
| 灌浆期 Filling y = 13.383x - 3.9326 | 0.75 | 16.4 | 15.3 | ||
| 多元逐步线性回归模型 Yield model based on stepwise multiple linear regression | y=0.14x1+11.23x2-13.22x3+23.12x4-3.57x5-8.31 | 0.69 | 16.6 | 19.6 | |
| y=11.25x2-13.36x3+23.27x4-3.38x5-8.36 | 0.69 | 16.7 | 19.7 | ||
| y=12.21x2-14.79x3+19.45x4-7.45 | 0.68 | 16.3 | 18.2 |
表7
基于RNDRE和RNDVI时序曲线特征参数的冬小麦单产模型验证结果"
| 特征参数 Characteristic parameter | RNDRE | RNDVI | |||||
|---|---|---|---|---|---|---|---|
| R2 | RRMSE (%) | RE (%) | R2 | RRMSE (%) | RE (%) | ||
| 最大值 Maximum | 0.81 | 8.0 | 8.4 | 0.65 | 12.1 | 15.1 | |
| 累积值 Accumulative value | 0.80 | 9.6 | 9.9 | 0.72 | 16.9 | 15.9 | |
| 增长速率 Increase rate | 0.36 | 19.8 | 20.8 | 0.01 | 78.1 | 90.8 | |
| 下降速率 Decrease rate | 0.44 | 24.3 | 23.7 | 0.07 | 46.0 | 44.8 | |
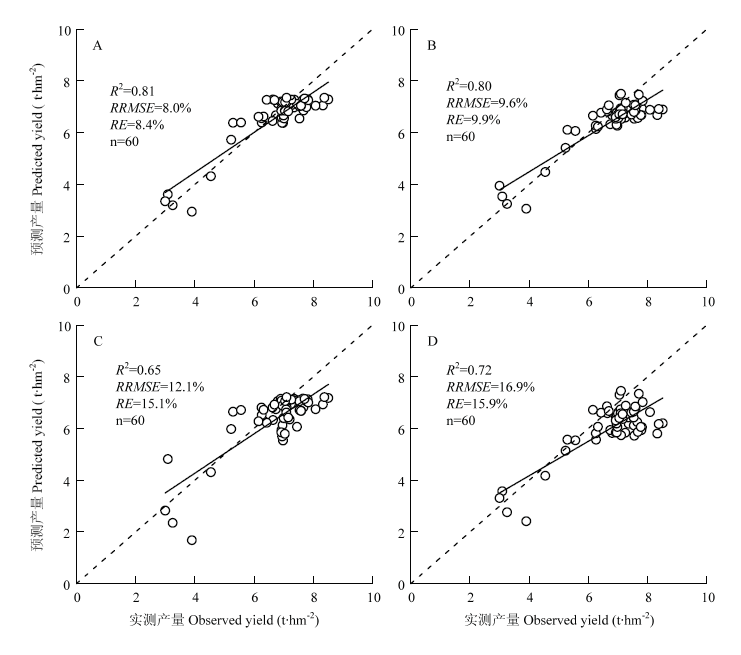
图5
基于RNDRE(A:最大值;B:累积值)和RNDVI(C:最大值;D:累积值)时序曲线特征的单产预测模型验证结果"
| [1] |
谭昌伟, 杜颖, 童璐, 周健, 罗明, 颜伟伟, 陈菲. 基于开花期卫星遥感数据的大田小麦估产方法比较. 中国农业科学, 2017,50(16):3101-3109.
doi: 10.3864/j.issn.0578-1752.2017.16.005 |
|
TAN C W, DU Y, TONG L, ZHOU J, LUO M, YAN W W, CHEN F. Comparison of the methods for predicting wheat yield based on satellite remote sensing data at anthesis. Scientia Agricultura Sinica, 2017,50(16):3101-3109. (in Chinese)
doi: 10.3864/j.issn.0578-1752.2017.16.005 |
|
| [2] | 侯学会, 牛铮, 高帅, 黄妮. 基于SPOT-VGT NDVI时间序列的农牧交错带植被物候监测. 农业工程学报, 2013,29(1):142-150. |
| HOU X H, NIU Z, GAO S, HUANG N. Monitoring vegetation phenology in farming-pastoral zone using SPOT-VGT NDVI data. Transactions of the Chinese Society of Agricultural Engineering, 2013,29(1):142-150. (in Chinese) | |
| [3] | 冯美臣, 杨武德, 张东彦, 曹亮亮, 王慧芳, 王芊. 基于TM和MODIS数据的水旱地冬小麦面积提取和长势监测. 农业工程学报, 2009,25(3):103-109. |
| FENG M C, YANG W D, ZHANG D Y, CAO L L, WANG H F, WANG Q. Monitoring planting area and growth situation of irrigation-land and dry-land winter wheat based on TM and MODIS data. Transactions of the Chinese Society of Agricultural Engineering, 2009,25(3):103-109. (in Chinese) | |
| [4] | 任建强, 陈仲新, 周清波, 刘佳, 唐华俊. MODIS植被指数的美国玉米单产遥感估测. 遥感学报, 2015,19(4):568-577. |
| REN J Q, CHEN Z X, ZHOU Q B, LIU J, TANG H J. MODIS vegetation index data used for estimating corn yield in USA. Journal of Remote Sensing, 2015,19(4):568-577. (in Chinese) | |
| [5] | 苏腾飞, 刘全明, 苏秀川. 基于多种植被指数时间序列与机器学习的作物遥感分类研究. 江苏农业科学, 2017,45(16):219-224. |
| SU T F, LIU Q M, SU X C. Remote sensing classification of crops based on time series of multiple vegetation indices and machine learning. Jiangsu Agricultural Sciences, 2017,45(16):219-224. (in Chinese) | |
| [6] | WARDLOW B D, EGBERT S L, KASTENS J H. Analysis of time-series MODIS 250 m vegetation index data for crop classification in the U.S. central great plains. Remote Sensing of Environment, 2007,108(3):290-310. |
| [7] | ZHENG H B, CHENG T, YAO X, DENG X Q, TIAN Y C, CAO W X, ZHU Y. Detection of rice phenology through time series analysis of ground-based spectral index data. Field Crops Research, 2016,198:131-139. |
| [8] |
PAN Y Z, LI L, ZHANG J S, LIANG S L, ZHU X F, SULLA-MENASHE D. Winter wheat area estimation from MODIS-EVI time series data using the crop proportion phenology index. Remote Sensing of Environment, 2012,119:232-242.
doi: 10.1016/j.rse.2011.10.011 |
| [9] | 陈鹏飞, 杨飞, 杜佳. 基于环境减灾卫星时序归一化植被指数的冬小麦单产估测. 农业工程学报, 2013,29(11):124-131. |
| CHEN P F, YANG F, DU J. Yield forecasting for winter wheat using time series NDVI from HJ satellite. Transactions of the Chinese Society of Agricultural Engineering, 2013,29(11):124-131. (in Chinese) | |
| [10] |
ANTHONY N R, ANATOLY G, YI P, ELIZABETH W S, BRYAN L, TIMOTHY A. Continuous monitoring of crop reflectance, vegetation fraction, and identification of developmental stages using a four band radiometer. Agronomy Journal, 2013,105(6):1769.
doi: 10.2134/agronj2013.0242 |
| [11] | LIU X J, FERGUSON R, ZHENG H B, CAO Q, TIAN Y C, CAO W X, ZHU Y. Using an active-optical sensor to develop an optimal NDVI dynamic model for high-yield rice production (Yangtze, China). Sensors, 2017,17(4):672. |
| [12] |
MAGNEY T S, EITEL J U H, HUGGINS D R, VIERLING L A. Proximal NDVI derived phenology improves in-season predictions of wheat quantity and quality. Agricultural and Forest Meteorology, 2016,217:46-60.
doi: 10.1016/j.agrformet.2015.11.009 |
| [13] | SHAVER T M, KHOSLA R, WESTFALL D G. Evaluation of two ground-based active crop canopy sensors in maize: growth stage, row spacing, and sensor movement speed. Soil Science Society of America Journal, 2010,74(6):2101-2108. |
| [14] | TANAKA S, KAWAMURA K, MAKI M, MURAMOTO Y, YOSHIDA K, AKIYAMA T. Spectral Index for quantifying leaf area index of winter wheat by field hyperspectral measurements: A case study in Gifu prefecture, central Japan. Remote Sensing, 2015,7(5):5329-5346. |
| [15] | THOMPSON L J, FERGUSON R B, KITCHEN N, FRAZEN D W, MAMO M, YANG H, SCHEPERS J S. Model and sensor-based recommendation approaches for in-season nitrogen management in corn. Agronomy Journal, 2015,107(6):2020-2030. |
| [16] | 王仁红, 宋晓宇, 李振海, 杨贵军, 郭文善, 谭昌伟, 陈立平. 基于高光谱的冬小麦氮素营养指数估测. 农业工程学报, 2014,30(19):191-198. |
| WANG R H, SONG X Y, LI Z H, YANG G J, GUO W S, TAN C W, CHEN L P. Estimation of winter wheat nitrogen nutrition index using hyperspectral remote sensing. Transactions of the Chinese Society of Agricultural Engineering, 2014,30(19):191-198. (in Chinese) | |
| [17] | ZHOU X, ZHENG H B, XU X Q, HE J Y, GE X K, YAO X, CHENG T, ZHU Y, CAO W X, TIAN Y C. Predicting grain yield in rice using multi-temporal vegetation indices from UAV-based multispectral and digital imagery. ISPRS Journal of Photogrammetry and Remote Sensing, 2017,130:246-255. |
| [18] |
LU J J, MIAO Y X, SHI W, LI J X, YUAN F. Evaluating different approaches to non-destructive nitrogen status diagnosis of rice using portable RapidSCAN active canopy sensor. Scientific Reports, 2017,7(1):14073.
doi: 10.1038/s41598-017-14597-1 pmid: 29074943 |
| [19] |
LI S Y, DING X Z, KUANG Q L, ATA-UI-KARIM S T, CHENG T, LIU X J, TIAN Y C, ZHU Y, CAO W X, CAO Q. Potential of UAV-based active sensing for monitoring rice leaf nitrogen status. Frontiers in Plant Science, 2018,9:1834.
doi: 10.3389/fpls.2018.01834 pmid: 30619407 |
| [20] | BONFIL D J. Wheat phenomics in the field by RapidScan NDVI vs. NDRE. Israel Journal of Plant Sciences, 2016,64:41-45. |
| [21] |
RUSSELLE M P, WILHELM W W, OLSON R A, POWER J F. Growth analysis based on degree days. Crop Science, 1984,24:28-32.
doi: 10.2135/cropsci1984.0011183X002400010007x |
| [22] |
FRANCH B, VERMOTE E F, BECKER-RESHEF I, CLAVERIE M, HUANG J, ZHANG J, JUSTICE C, SOBRINO J A. Improving the timeliness of winter wheat production forecast in the United States of America, Ukraine and China using MODIS data and NCAR growing degree day information. Remote Sensing of Environment, 2015,161:131-148.
doi: 10.1016/j.rse.2015.02.014 |
| [23] | MCMASTER G S, SMIKA D E. Estimation and evaluation of winter wheat phenology in the central great plains. Agricultural and Forest Meteorology, 1988,43(1):1-18. |
| [24] |
WANG X X, WANG Q J, FAN J, SU L J, SHEN X L. Logistic model analysis of winter wheat growth on China's loess plateau. Canadian Journal of Plant Science, 2014,94(8):1471-1479.
doi: 10.4141/CJPS2013-293 |
| [25] |
FISCHER A. A model for the seasonal variations of vegetation indices in coarse resolution data and its inversion to extract crop parameters. Remote Sensing of Environment, 1994,48(2):220-230.
doi: 10.1016/0034-4257(94)90143-0 |
| [26] |
SHMUELI G. To explain or to predict? Statistical Science, 2010,25(3):289-310.
doi: 10.1214/10-STS330 |
| [27] | AKAIKE H. A new look at the statistical model identification. IEEE Transactions on Automatic Control, 1974,19(6):716-723. |
| [28] | BOZDOGAN H. Model selection and Akaike's information criterion (AIC): the general theory and its analytical extensions. Psychometrika, 1987,52(3):345-370. |
| [29] |
MKHABELA M S, BULLOCK P, RAJ S, WANG S, YANG Y. Crop yield forecasting on the Canadian prairies using MODIS NDVI data. Agricultural and Forest Meteorology, 2011,151(3):385-393.
doi: 10.1016/j.agrformet.2010.11.012 |
| [30] | 王长耀, 林文鹏. 基于MODIS EVI的冬小麦单产遥感预测研究. 农业工程学报, 2005,21(10):90-94. |
| WANG C Y, LIN W P. Winter wheat yield estimation based on MODIS EVI. Transactions of the Chinese Society of Agricultural Engineering, 2005,21(10):90-94. (in Chinese) | |
| [31] |
HASSAN M A, YANG M J, RASHEED A, YANG G J, REYNOLDS M, XIA X C, XIAO Y G, HE Z H. A rapid monitoring of NDVI across the wheat growth cycle for grain yield prediction using a multi-spectral UAV platform. Plant Science, 2019,282:95-103.
doi: 10.1016/j.plantsci.2018.10.022 pmid: 31003615 |
| [32] | KANKE Y TUBAÑA B, DALEN M, HARRELL D. Evaluation of red and red-edge reflectance-based vegetation indices for rice biomass and grain yield prediction models in paddy fields. Precision Agriculture, 2016,17(5):507-530. |
| [33] |
DEMPEWOLF J, ADUSEI B, BECKER R I, HANSEN M, POTAPOV P, KHAN A, BARKER B. Wheat yield forecasting for Punjab province from vegetation index time series and historic crop statistics. Remote Sensing, 2014,6:9653-9675.
doi: 10.3390/rs6109653 |
| [34] |
MENG L H, ZHANG X L, LIU H J, GUO D, YAN Y, QIN L L, PAN Y. Estimation of cotton yield using the reconstructed time-series vegetation index of Landsat Data. Canadian Journal of Remote Sensing, 2017,43(3):244-255.
doi: 10.1080/07038992.2017.1317206 |
| [35] | ZHANG K, GE X K, SHEN P C, LI W Y, LIU X J, CAO Q, ZHU Y, CAO W X, TIAN Y C. Predicting rice grain yield based on dynamic changes in vegetation indexes during early to mid-growth stages. Remote Sensing, 2019,11(4):387. |
| [36] |
WARDLOW B D, EGBERT S L. Large-area crop mapping using time-series MODIS 250 m NDVI data: An assessment for the U.S. central great plains. Remote Sensing of Environment, 2008,112(3):1096-1116.
doi: 10.1016/j.rse.2007.07.019 |
| [37] |
CHU L, LIU Q S, HUANG C, LIU G H. Monitoring of winter wheat distribution and phenological phases based on MODIS time-series: A case study in the Yellow River Delta, China. Journal of Integrative Agriculture, 2016,15(10):2403-2416.
doi: 10.1016/S2095-3119(15)61319-3 |
| [38] |
JOHNSON D M. An assessment of pre- and within-season remotely sensed variables for forecasting corn and soybean yields in the United States. Remote Sensing of Environment, 2014,141:116-128.
doi: 10.1016/j.rse.2013.10.027 |
| [39] |
HUANG J X, TIAN L Y, LIANG S L, MA H Y, BECKER-RESHEF I, HUANG Y B, SU W, ZHANG X D, ZHU D H, WU W B. Improving winter wheat yield estimation by assimilation of the leaf area index from Landsat TM and MODIS data into the WOFOST model. Agricultural and Forest Meteorology, 2015,204:106-121.
doi: 10.1016/j.agrformet.2015.02.001 |
| [40] |
MA H Y, HUANG J X, ZHU D H, LIU J M, SU W, ZHANG C, FAN J L. Estimating regional winter wheat yield by assimilation of time series of HJ-1 CCD NDVI into WOFOST-ACRM model with Ensemble Kalman filter. Mathematical and Computer Modelling, 2013,58(3/4):759-770.
doi: 10.1016/j.mcm.2012.12.028 |
| [41] |
TAO J B, WU W B, ZHOU Y, WANG Y, JIANG Y. Mapping winter wheat using phenological feature of peak before winter on the north China plain based on time-series MODIS data. Journal of Integrative Agriculture, 2017,16(2):348-359.
doi: 10.1016/S2095-3119(15)61304-1 |
| [42] |
DUVEILLER G, LOPEZ-LOZANO R, CESCATTI A. Exploiting the multi-angularity of the MODIS temporal signal to identify spatially homogeneous vegetation cover: A demonstration for agricultural monitoring applications. Remote Sensing of Environment, 2015,166:61-77.
doi: 10.1016/j.rse.2015.06.001 |
| [1] | 朱琦, 贾振鹏, Tahir SHAH, 徐晨晟, 李芷琦, 吕会帅, 朱鹏超, 韦小敏, 黄冬琳, 孙艳妮, 曹卫东, 高亚军, 王朝辉, 张达斌. 绿肥配施增效产品降低旱地麦田温室气体排放及碳足迹[J]. 中国农业科学, 2026, 59(7): 1507-1522. |
| [2] | 钱瑾, 李映雪, 吴芳, 邹晓晨. 集成光谱降维的冬小麦叶片磷含量估算[J]. 中国农业科学, 2026, 59(4): 781-792. |
| [3] | 孔媛, 崔沙沙, 李美, 李健, 杨思雨, 房锋, 刘帅帅, 刘明平, 曾艳, 高兴祥, 柏连阳. 黄淮海冬小麦田多花黑麦草等5种禾本科杂草时空分布变化规律[J]. 中国农业科学, 2026, 59(4): 807-823. |
| [4] | 咸青林, 肖鉴珂, 高阿庆, 郜利闯, 刘杨. 种植方式结合测墒补灌下冬小麦产量及水分利用效率[J]. 中国农业科学, 2026, 59(3): 589-601. |
| [5] | 吕旭东, 孙世媛, 李亚楠, 刘玉龙, 王艳群, 付鑫, 张佳英, 宁鹏, 彭正萍. 智能机械化分层施肥对麦田根-土养分分布和小麦产量的影响[J]. 中国农业科学, 2026, 59(1): 129-146. |
| [6] | 蒲丽霞, 张佳芮, 叶建萍, 黄秀兰, 樊高琼, 杨洪坤. 二氢赤霉素与秸秆覆盖对旱地小麦分蘖成穗与产量的影响[J]. 中国农业科学, 2025, 58(9): 1735-1748. |
| [7] | 杨国昌, 郑月, 包向男, 代迎春, 王金刚, 白雪峰, 孙伟, 李喜和, 张淑君. 中红外光谱分析技术在奶牛甲烷排放预测中的应用研究进展[J]. 中国农业科学, 2025, 58(9): 1856-1866. |
| [8] | 田立文, 娄善伟, 张鹏忠, 杜明伟, 罗宏海, 李杰, 帕尔哈提·买买提, 马腾飞, 张立祯. 绿色高效生产模式下新疆棉花单产提升面临问题与途径分析[J]. 中国农业科学, 2025, 58(6): 1102-1115. |
| [9] | 史帆, 李文广, 易树生, 杨娜, 陈玉萌, 郑伟, 张雪辰, 李紫燕, 翟丙年. 有机无机肥配施下旱地麦田土壤有机碳组分含量的变化特征[J]. 中国农业科学, 2025, 58(4): 719-732. |
| [10] | 房康睿, 丁世杰, 陈雨珊, 杨秉庚, 郭腾飞, 徐新朋, 赵士诚, 王秀斌, 黄绍敏, 仇少君, 何萍, 周卫. 有机无机肥配施下典型潮土小麦季有机肥氮磷的当季释放率[J]. 中国农业科学, 2025, 58(24): 5234-5246. |
| [11] | 佘映军, 周子哲, 伍明, 郭魏, 师昌健, 胡超, 李平. 地下水埋深和施氮对土壤水盐分布及冬小麦养分吸收利用的影响[J]. 中国农业科学, 2025, 58(20): 4285-4304. |
| [12] | 王荣荣, 徐宁璐, 黄修利, 赵凯男, 黄明, 王贺正, 付国占, 吴金芝, 李友军. 一次灌溉和氮肥运筹对旱地小麦籽粒产量和品质的影响[J]. 中国农业科学, 2025, 58(1): 43-57. |
| [13] | 高兴祥, 孔媛, 张耀中, 李美, 李健, 金岩, 张国福, 刘帅帅, 刘明平, 曾艳, 柏连阳. 河南省冬小麦田杂草群落分布现状及其变化原因分析[J]. 中国农业科学, 2025, 58(1): 91-100. |
| [14] | 臧少龙, 刘淋茹, 高越之, 吴珂, 贺利, 段剑钊, 宋晓, 冯伟. 基于无人机影像多时相的小麦品种氮效率分类识别[J]. 中国农业科学, 2024, 57(9): 1687-1708. |
| [15] | 高晨凯, 刘水苗, 李煜铭, 赵志恒, 邵京, 于昊琳, 吴鹏年, 王艳丽, 关小康, 王同朝, 温鹏飞. 冬小麦水分利用效率相关驱动因子及其预测模型构建[J]. 中国农业科学, 2024, 57(7): 1281-1294. |
|
||