






中国农业科学 ›› 2026, Vol. 59 ›› Issue (20): 4617-4629.doi: 10.3864/j.issn.0578-1752.2026.20.014
• 专题:农食系统低碳转型与反刍动物甲烷减排的理论、技术与实践 • 上一篇 下一篇
年雪妍1,2( ), 张庆2, 张建国2, 屠焰1()
收稿日期:2025-11-26
接受日期:2026-05-06
出版日期:2026-10-16
发布日期:2026-10-21
通信作者:
联系方式:
年雪妍,E-mail:1377606830@qq.com。
基金资助:
NIAN XueYan1,2(), ZHANG Qing2, ZHANG JianGuo2, TU Yan1()
Received:2025-11-26
Accepted:2026-05-06
Published:2026-10-16
Online:2026-10-21
摘要:
【目的】大豆及豆粕在中国的饲料工业中举足轻重。通过系统评估中国大豆产业的碳足迹特征,明确中国主产区大豆及豆粕生产的碳足迹,分析其时空演变规律与关键排放源构成,以期为从饲料源头制定减排策略提供依据,进而,为推进动物生产系统的低碳转型提供关键的基础数据与科学支撑。【方法】基于生命周期评价法,核算2014—2023年中国大豆主产省生产的碳足迹,采用经济价值分配法核算豆粕碳足迹并分析其构成,系统识别关键排放源与区域分异特征。【结果】(1)中国大豆生产碳足迹呈现明显的时空分异与下降趋势。2014—2023年中国主要产区大豆单位面积碳足迹均值为1 011.23 kg CO2-eq/hm2,单位产量碳足迹均值为0.222 kg CO2-eq/kg。空间上,华北地区单位面积碳足迹高,河北省最高(1 674.58 kg CO2-eq/hm2);单位产量碳足迹则在东北与华北部分地区偏高,山西省最高(0.38 kg CO2-eq/kg)。时序上,全国大部分产区碳足迹呈下降趋势,山西(单位产量碳足迹年均降0.028 kg CO2-eq/kg)和河北(单位面积碳足迹年均降59.13 kg CO2-eq/hm2)降幅最大。(2)豆粕碳足迹主要源于种植阶段,且省级差异明显。全国豆粕碳足迹平均值为0.129 kg CO2-eq/kg,各省范围在0.049—0.379 kg CO2-eq/kg之间。大豆种植阶段贡献了豆粕全生命周期95%以上的碳排放。(3)碳足迹构成具有鲜明地域特征,关键排放源明确。全国碳排放构成中,农田N2O直接排放(19.96%)与复合肥生产(17.81%)是前两大贡献源。区域分异明显,东北及内蒙古地区以农机柴油(10.00%—17.19%)和复合肥生产(20.47%—28.31%)为主;河北、山东地区灌溉电力消耗占比最高(20.14%—36.54%);安徽、河南等地农药生产排放突出(27.09%—30.15%)。运输与加工环节合计贡献不足5%。【结论】优化大豆田间管理是降低豆粕碳足迹的关键。为实现全产业链协同减排,需推动以化肥增效、节水灌溉、绿色防控为核心的农业生产系统转型,并同步构建低碳供应链,从源头引导减排。在具体实施中,应结合不同地区的排放结构特征进行精准侧重,在东北及内蒙古地区,可重点推广新能源农机与缓控释肥;在河北、山东等地,优先发展节水灌溉技术;在安徽、河南等农药排放较高的区域,着力强化病虫害绿色防控体系。推动大豆产业绿色转型,需构建从“田间生产”到“饲料消费”的全链条低碳路径,也为从饲料源头降低动物生产碳排放提供明确方向。
年雪妍, 张庆, 张建国, 屠焰. 基于生命周期评价法的中国大豆及豆粕生产碳足迹(2014—2023年)[J]. 中国农业科学, 2026, 59(20): 4617-4629.
NIAN XueYan, ZHANG Qing, ZHANG JianGuo, TU Yan. Carbon Footprint of Soybean and Soybean Meal Production in China Based on Life Cycle Assessment (2014—2023)[J]. Scientia Agricultura Sinica, 2026, 59(20): 4617-4629.
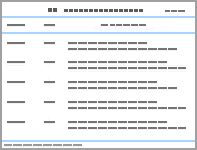
表1
2014—2023年中国主要大豆产区各省(自治区)的种植面积和产量"
| 省(自治区)Provinces (Autonomous Regions) | 2014 | 2015 | 2016 | 2017 | 2018 | 2019 | 2020 | 2021 | 2022 | 2023 |
|---|---|---|---|---|---|---|---|---|---|---|
| 河北Hebei | 12.2/25.0 | 11.6/22.6 | 6.9/16.0 | 7.0/17.1 | 8.8/20.9 | 9.4/22.6 | 9.0/21.5 | 6.7/16.3 | 9.8/23.0 | 11.4/24.5 |
| 山西Shanxi | 19.2/20.7 | 13.7/20.2 | 19.2/23.9 | 13.1/17.1 | 15.1/23.6 | 12.9/21.5 | 12.0/20.8 | 9.2/14.4 | 11.2/18.9 | 11.7/20.1 |
| 内蒙古Inner Mongolia | 74.5/115.0 | 81.3/126.7 | 92.3/150.8 | 98.9/162.6 | 109.4/179.4 | 119.0/226.0 | 120.2/234.7 | 89.3/168.5 | 122.2/245.4 | 123.5/244.4 |
| 辽宁Liaoning | 6.4/13.3 | 6.0/13.4 | 7.0/14.8 | 7.4/19.3 | 7.4/18.0 | 8.4/21.3 | 10.3/23.9 | 10.4/25.1 | 11.5/27.0 | 12.3/28.0 |
| 吉林Jilin | 21.4/37.4 | 18.2/31.5 | 18.8/37.3 | 22.0/50.2 | 27.9/55.1 | 34.5/70.1 | 32.1/64.2 | 25.3/54.7 | 31.0/70.0 | 32.9/74.4 |
| 黑龙江Heilongjiang | 279.3/514.0 | 266.1/498.8 | 322.3/562.8 | 373.5/689.4 | 356.8/657.8 | 427.9/780.8 | 483.2/920.3 | 388.8/718.8 | 493.2/953.4 | 488.7/927.8 |
| 安徽Anhui | 85.2/115.0 | 82.1/126.8 | 83.0/125.3 | 85.9/130.2 | 65.0/97.5 | 63.6/95.7 | 60.5/92.9 | 58.7/90.9 | 61.1/94.2 | 63.2/97.8 |
| 山东Shandong | 15.0/36.7 | 13.7/34.8 | 13.3/35.7 | 12.0/32.1 | 15.4/43.3 | 18.4/52.4 | 18.9/55.5 | 18.3/53.5 | 21.5/58.1 | 23.2/64.0 |
| 河南Henan | 38.2/51.5 | 34.4/46.8 | 34.1/46.9 | 34.5/50.4 | 38.6/95.6 | 39.5/98.2 | 37.5/93.4 | 33.3/74.8 | 36.4/84.9 | 38.1/92.7 |
| 陕西Shaanxi | 14.4/23.1 | 14.3/15.8 | 15.1/24.3 | 15.2/23.9 | 15.2/23.9 | 15.1/23.4 | 15.1/23.6 | 15.1/25.1 | 17.4/30.5 | 17.7/31.7 |

图1
碳足迹计算系统边界"
表2
大豆系统主副产品分配参数[22-23]"
| 作物产出 Crop yield | 质量分数 Mass fraction (%) | 价格(元/t) Price (Yuan/t) |
|---|---|---|
| 豆粕Soybean meal | 32.94 | 4303.25 |
| 豆油Soybean oil | 7.23 | 8780.00 |
| 大豆秸秆Soybean straw | 59.82 | 860.00 |
表3
碳排放因子及参数"
| 项目 Project | 排放因子 Emission factor | 单位 Unit | 排放因子来源 Sources of emission factors |
|---|---|---|---|
| 大豆种子Soybean seeds | 1.18 | kg CO2-eq/kg | [ |
| 除草剂Herbicide | 10.15 | kg CO2-eq/kg | [ |
| 杀虫剂Insecticide | 16.61 | kg CO2-eq/kg | [ |
| 杀菌剂Fungicide | 10.57 | kg CO2-eq/kg | [ |
| 氮肥Nitrogen fertilizer | 1.53 | kg CO2-eq/kg | [ |
| 磷肥Phosphate fertilizer | 1.63 | kg CO2-eq/kg | [ |
| 钾肥Potash fertilizer | 0.65 | kg CO2-eq/kg | [ |
| 复合肥Compound fertilizer | 1.77 | kg CO2-eq/kg | [ |
| 氮肥田间施用的N2O直接排放因子 Direct N2O emission factor for nitrogen fertilizers applied in the field | 按区域划分 By region | kg N2O-N/(kg N) | [ |
| 大气氮沉降排放N2O排放因子 Atmospheric nitrogen deposition emission N2O emission factor | 0.01 | kg N2O-N/(kg N) | [ |
| 渗漏或径流损失的N的N2O排放因子 N2O emission factor for nitrogen losses from seepage or runoff | 0.0075 | kg N2O-N/(kg N) | [ |
| 以NH3和NOx形式挥发的化肥氮比例 The proportion of nitrogen volatilised from fertilizers in the form of NH3 and NOx | 0.1 | [ | |
| 氮肥以淋溶和径流损失比例 The proportion of nitrogen fertilizer lost through leaching and runoff | 0.2 | [ | |
| 电力 Electricity | 按省份划分 By province | kg CO2-eq/kWh | [ |
| 柴油Diesel | 3.10 | kg CO2-eq/kg | [ |
表4
2014—2023年中国大豆种植碳足迹时空变化"
| 省(自治区) Provinces (Autonomous Regions) | 单位面积碳足迹 Carbon footprint per unit area (kg CO2-eq/hm2) | 单位面积碳足迹年际变化率 Carbon footprint trend per unit area (kg CO2-eq/hm2) | 单位产量碳足迹 Carbon footprint per unit production (kg CO2-eq/kg) | 单位产量碳足迹年际变化率 Carbon footprint trend per unit production (kg CO2-eq/kg) |
|---|---|---|---|---|
| 安徽Anhui | 681.21 | -1.06 | 0.17 | -0.002 |
| 河北Hebei | 1674.58 | -59.13 | 0.29 | -0.014 |
| 河南Henan | 655.88 | -18.61 | 0.14 | -0.017 |
| 黑龙江Heilongjiang | 1012.43 | -2.91 | 0.26 | -0.002 |
| 吉林Jilin | 1185.62 | 14.41 | 0.20 | -0.003 |
| 辽宁Liaoning | 1105.13 | -9.21 | 0.18 | -0.003 |
| 内蒙古Inner Mongolia | 734.42 | 5.11 | 0.16 | -0.004 |
| 山东Shandong | 958.67 | 31.03 | 0.14 | 0.003 |
| 山西Shanxi | 1121.45 | -1.80 | 0.38 | -0.028 |
| 陕西Shaanxi | 982.90 | 19.39 | 0.30 | -0.002 |
表5
2014—2023年中国主要大豆产地省(自治区)豆粕的碳足迹"
| 省(自治区) Provinces (Autonomous Regions) | 碳足迹Carbon footprint (kg CO2-eq·kg-1) | |||
|---|---|---|---|---|
| 最大值Max | 平均值Mean | 最小值Min | 标准差SD | |
| 安徽Anhui | 0.124 | 0.099 | 0.073 | 0.015 |
| 河北Hebei | 0.218 | 0.165 | 0.123 | 0.029 |
| 河南Henan | 0.179 | 0.084 | 0.049 | 0.040 |
| 黑龙江Heilongjiang | 0.158 | 0.148 | 0.137 | 0.006 |
| 吉林Jilin | 0.155 | 0.117 | 0.106 | 0.014 |
| 辽宁Liaoning | 0.124 | 0.102 | 0.084 | 0.013 |
| 内蒙古Inner Mongolia | 0.112 | 0.096 | 0.087 | 0.009 |
| 山东Shandong | 0.099 | 0.081 | 0.071 | 0.009 |
| 山西Shanxi | 0.379 | 0.228 | 0.162 | 0.074 |
| 陕西Shaanxi | 0.241 | 0.175 | 0.139 | 0.032 |
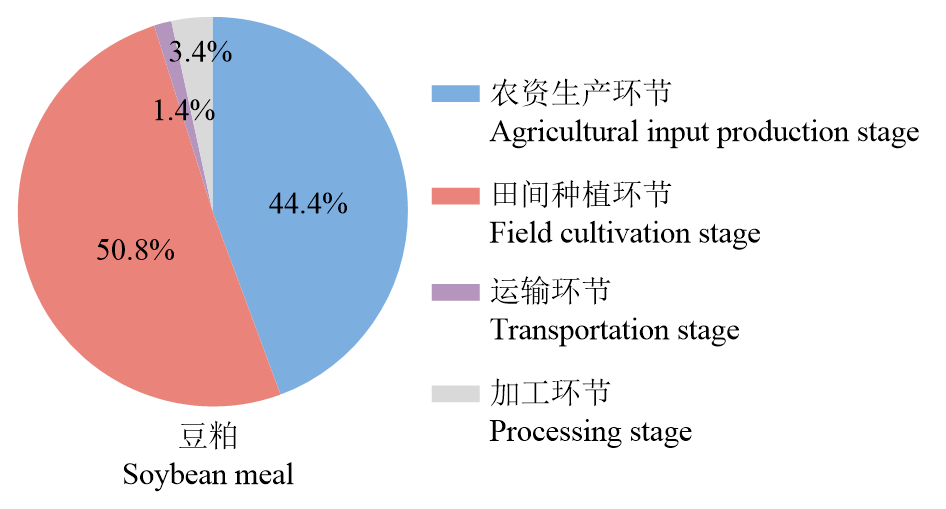
图2
农资生产、田间种植、运输和加工环节的碳排放占比"
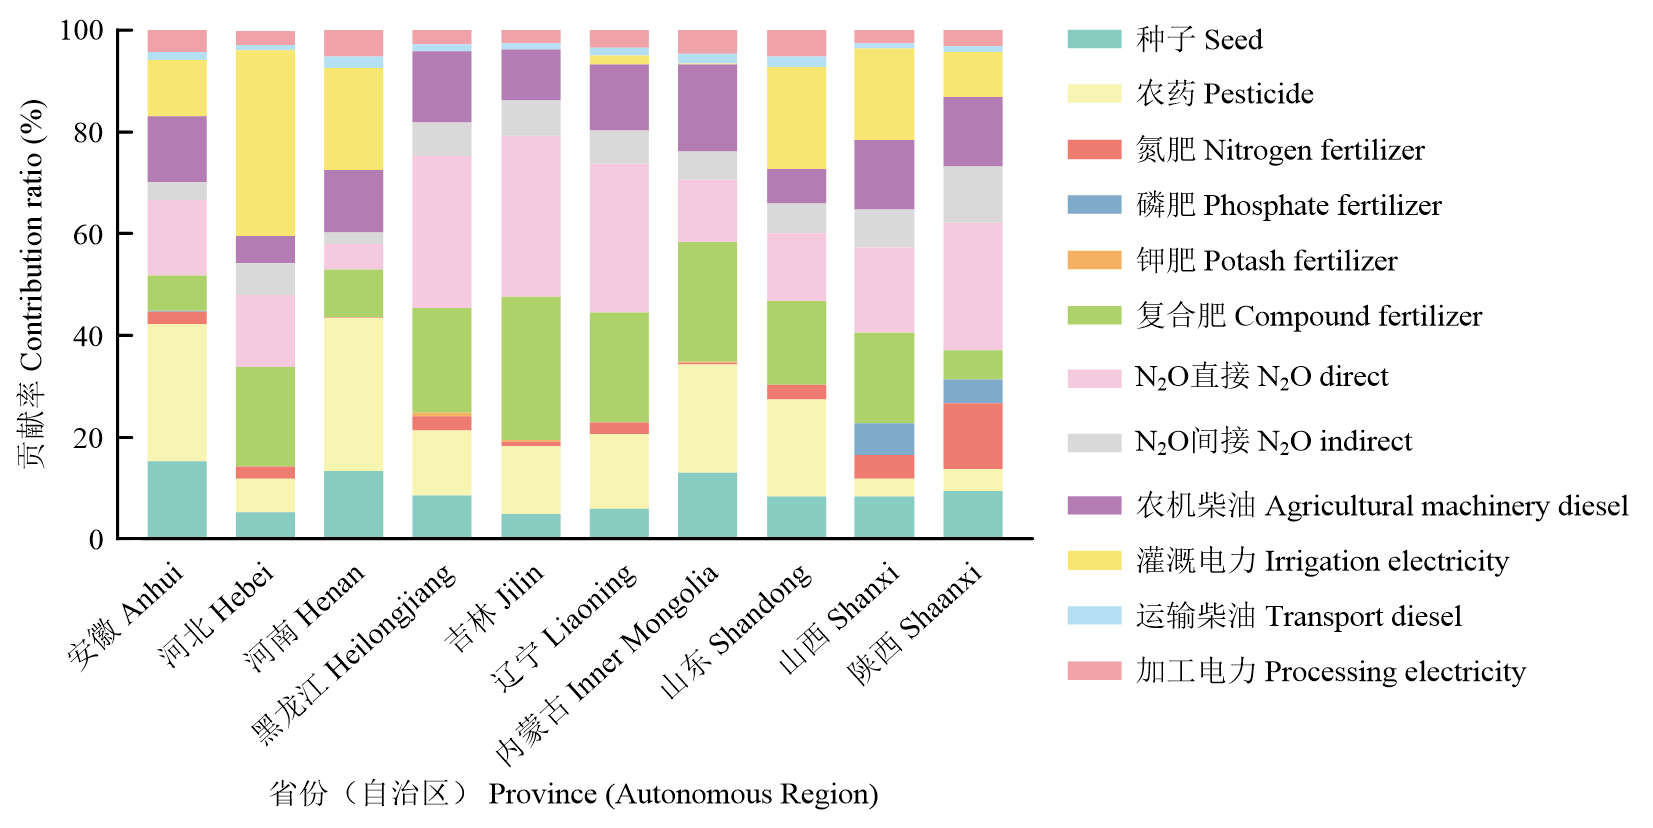
图3
豆粕的碳足迹构成"
表6
排放因子及分配系数对豆粕单位产量碳足迹的影响"
| 参数 Parameter | 变化范围 Range of variation | 变化率 Rate of change | 单位产量豆粕碳足迹 Carbon footprint per unit of soybean meal produced |
|---|---|---|---|
| 田间N2O直接排放因子 Direct N2O emission factor from cropland | +50% | +9.98% | 0.142 |
| -50% | -9.98% | 0.116 | |
| 农药生产排放因子 Pesticide production emission factors | +20% | +2.71% | 0.133 |
| -20% | -2.71% | 0.126 | |
| 复合肥生产排放因子 Emissions factor for compound fertilizer production | +20% | +3.56% | 0.134 |
| -20% | -3.56% | 0.125 | |
| 经济价值分配系数 Economic value distribution coefficient | +10% | +10.00% | 0.142 |
| -10% | -10.00% | 0.116 |
| [1] |
|
| [2] |
何可, 李凡略, 刘颖. “双碳” 目标下的畜禽养殖业绿色发展[J]. 环境保护, 2022, 50(16): 28-33.
|
|
|
|
| [3] |
|
| [4] |
|
| [5] |
中华人民共和国中央人民政府. 中共中央国务院关于进一步深化农村改革扎实推进乡村全面振兴的意见[Z]. (2025-02-24) [2026-01-13]. https://www.moa.gov.cn/ztzl/2025yhwj/zxgz_29966/202502/t20250224_6470398.htm.
|
|
The Central People's Government of the People's Republic of China. Opinion of the Central Committee of the Communist Party of China and the State Council on Further Deepening Rural Reform and Solidly Advancing the Comprehensive Revitalisation of Rural Areas[Z]. (2025-02-24)[2026-01-13]. https://www.moa.gov.cn/ztzl/2025yhwj/zxgz_29966/202502/t20250224_6470398.htm. (in Chinese)
|
|
| [6] |
|
| [7] |
doi: 10.1111/jiec.2008.12.issue-1 |
| [8] |
doi: 10.3390/su12166570 |
| [9] |
温桂香, 姚金哲, 韩晴, 李鸽子, 王志勇, 张丛光, 李岚涛, 刘世亮, 王宜伦, 介晓磊, 柳海涛. 河南省小麦玉米生产体系碳氮足迹时空变化特征及驱动因素分析[J]. 环境科学, 2025, 46(2): 1002-1015.
|
|
|
|
| [10] |
张传红, 韩露, 谢佳男, 靳浩, 刘翠英, 樊建凌. 江苏省主要农作物碳足迹动态及其构成研究[J]. 南京信息工程大学学报(自然科学版), 2022, 14(1): 110-119.
|
|
|
|
| [11] |
陈晗奕, 陈一灵, 洪志坤, 游璐萍, 郑先鑫, 王琳, 许章华. 黑龙江省大豆生产的碳足迹时空分布特征及生态优化研究[J]. 环境监测管理与技术, 2024, 36(3): 21-26.
|
|
|
|
| [12] |
侯相成, 李涵, 董思奇, 于清军, 冯国忠, 李晓宇, 高强. 东北地区玉米种植系统碳足迹及氮足迹研究[J]. 吉林农业大学学报, 2024, 46(5): 911-922.
|
|
|
|
| [13] |
肖广敏, 茹淑华, 侯利敏, 王策, 赵欧亚, 孙世友, 王凌, 刘蕾, 张国印. 河北省小麦玉米生产体系碳足迹分析[J]. 生态与农村环境学报, 2022, 38(11): 1388-1395.
|
|
|
|
| [14] |
王效琴, 梁东丽, 王旭东, 彭莎, 郑金正. 运用生命周期评价方法评估奶牛养殖系统温室气体排放量[J]. 农业工程学报, 2012, 28(13): 179-184.
|
|
|
|
| [15] |
中华人民共和国国家统计局. 中国统计年鉴2023[M]. 北京: 中国统计出版社, 2023.
|
|
National Bureau of Statistics of the People's Republic of China. China Statistical Yearbook 2023[M]. Beijing: China Statistics Press, 2023. (in Chinese)
|
|
| [16] |
国家发展和改革委员会价格司. 全国农产品成本收益资料汇编2014[M]. 北京: 中国统计出版社, 2014.
|
|
Price Department of the National Development and Reform Commission. Compilation of National Agricultural Products Cost- Benefit Data in 2014[M]. Beijing: China Statistics Press, 2014. (in Chinese)
|
|
| [17] |
中国物价年鉴编委会. 中国物价年鉴2014- 2023[M]. 北京: 人民出版社, 2023.
|
|
Editorial Board of the China Price Yearbook. China Price Yearbook 2014-2023[M]. Beijing: People’s Publishing House, 2023. (in Chinese)
|
|
| [18] |
黄文强. 规模化养殖场牛奶生产碳足迹评估方法与案例分析[D]. 北京: 中国农业科学院, 2015.
|
|
|
|
| [19] |
|
| [20] |
谢光辉, 王晓玉, 韩东倩, 薛帅. 中国非禾谷类大田作物收获指数和秸秆系数[J]. 中国农业大学学报, 2011(1): 9-17.
|
|
|
|
| [21] |
中华人民共和国中央人民政府. 农业农村部办公厅关于做好农作物秸秆秸秆资源台账建设工作的通知[EB/OL]. (2019-10-28)[2025- 10-08]. https://www.gov.cn/zhengce/zhengceku/2019-10/28/content_5445951.htm.
|
|
Central People's Government of the People's Republic of China. Notice from the general office of the ministry of agriculture and rural affairs on establishing resource ledgers for crop straw[EB/OL]. (2019-10-28)[2025-10-08]. in Chinese)
|
|
| [22] |
国家统计局农村社会经济调查司. 中国农产品价格调查年鉴-2023[M]. 北京: 中国统计出版社, 2023.
|
|
Department of Rural Socio-economic Surveys, National Bureau of Statistics. China Yearbook of Agricultural Price Survey[M]. Beijing: China Statistics Press, 2023. (in Chinese)
|
|
| [23] |
农业农村部畜牧兽医局监测信息处, 全国畜牧总站统计信息处. 2023年1月全国畜产品和饲料价格情况[J]. 中国畜牧业, 2023(5): 23-25.
|
|
Monitoring Information Division Bureau of Animal Husbandry and Veterinary Medicine Ministry of Agriculture and Rural Affairs. Price analysis of national animal products and feed in January 2023[J]. China Animal Industry, 2023(5): 23-25. (in Chinese)
|
|
| [24] |
IPCC. 2019 Refinement to the 2006 IPCC Guidelines for National Greenhouse Gas Inventories Volume 4 Agriculture, Forestry and Other Land Use[Z]. (2019)[2025-10-08]. https://www.ipcc-nggip.iges.or.jp/public/2019rf/vol4.html.
|
| [25] |
Ecoinvent Database [Z]. (2011-05-11)[2025-10-15]. http://www.ecoinvent.ch.
|
| [26] |
刘夏璐, 王洪涛, 陈建, 何琴, 张浩, 姜睿, 陈雪雪, 侯萍. 中国生命周期参考数据库的建立方法与基础模型[J]. 环境科学学报, 2010, 30(10): 2136-2144.
|
|
|
|
| [27] |
省级温室气体清单编制指南编写组. 省级温室气体清单编制指南(试行)[Z]. 北京: 国家发展和改革委员会, 2011.
|
|
Provincial Greenhouse Gas Inventory Compilation Guidelines Drafting Group. Guidelines for the Preparation of Provincial Greenhouse Gas Inventories (Trial Version)[Z]. Beijing: National Development and Reform Commission, 2011. (in Chinese)
|
|
| [28] |
中华人民共和国生态环境部. 关于发布2022年电力二氧化碳排放因子的公告[EB/OL]. (2024-12-26)[2025-10-15]. https://www.mee.gov.cn/xxgk2018/xxgk/xxgk01/202412/t20241226_1099413.html.
|
|
Ministry of Ecology and Environment of the People's Republic of China. Notice on the Publication of the 2022 Carbon Dioxide Emission Factor for Electricity[EB/OL]. (2024-12-26)[2025-10-15]. https://www.mee.gov.cn/xxgk2018/xxgk/xxgk01/202412/t20241226_1099413.html. (in Chinese)
|
|
| [29] |
生态环境部大气环境司. 大气污染物与温室气体融合排放清单编制技术指南(试行)[Z]. 北京: 生态环境部, 2024.
|
|
Department of Atmospheric Environment Ministry of Ecology and Environment. Technical guidelines for the preparation of integrated emission inventories for air pollutants and greenhouse gases (Trial Version) [Z]. Beijing: Ministry of Ecology and Environment, 2024. (in Chinese)
|
|
| [30] |
张振华, 胡凯, 曾德源. 基于LCA的江西省典型生猪供应链的碳排放测算[J]. 家畜生态学报, 2022, 43(10): 78-85.
doi: 10.3969/j.issn.1673-1182.2022.10.013 |
|
|
|
| [31] |
Life Cycle Assessment - steps- Blonk Consultants[Z].(2017-11-11) [2026-01-13] https://www.blonkconsultants.nl/wp-content/uploads/2017/11/Life-Cycle-Assessment-steps.pdf.
|
| [32] |
Empresa Brasileira De Pesquisa Agropecuaria[Z].(2024-02-05)[2026- 01-13] https://sbc.cnpso.embrapa.br/en/.
|
| [33] |
任科宇, 徐明岗, 张露, 段英华, 王伯仁. 我国不同区域粮食作物产量对有机肥施用的响应差异[J]. 农业资源与环境学报, 2021, 38(1): 143-150.
|
|
|
|
| [34] |
doi: 10.1016/j.jclepro.2014.11.072 |
| [35] |
修圣智, 李艳, 魏丹, 刘康萌, 李硕, 胡钰, 金梁, 丁建莉, 杨振国. 东北三省主要粮食作物生产碳足迹动态变化及其影响因子研究[J]. 土壤通报, 2025, 56(1): 27-36.
|
|
|
|
| [36] |
中华人民共和国农业部. 到2020年化肥使用量零增长行动方案[Z]. (2015-03-18)[2025-10-28]. http://jiuban.moa.gov.cn/zwllm/tzgg/tz/201503/t20150318_4444765.htm.
|
|
Ministry of Agriculture of the People's Republic of China. Action plan for zero growth in fertilizer use by 2020 [Z]. (2015-03-18)[2025-10-28]. http://jiuban.moa.gov.cn/zwllm/tzgg/tz/201503/t20150318_4444765.htm. (in Chinese)
|
|
| [37] |
王钰乔, 濮超, 赵鑫, 王兴, 刘胜利, 张海林. 中国小麦、玉米碳足迹历史动态及未来趋势[J]. 资源科学, 2018, 40(9): 1800-1811.
doi: 10.18402/resci.2018.09.10 |
|
doi: 10.18402/resci.2018.09.10 |
|
| [38] |
doi: 10.5194/bg-13-4569-2016 |
| [39] |
谭鑫, 李昊儒, 王子健, 巩娟弟, 郝卫平. 2015-2020年不同省份小麦生命周期碳足迹变化分析[J]. 中国农业气象, 2024, 45(8): 809-821.
|
|
|
|
| [40] |
吕沛颖, 任红阳, 王红亮. 我国生猪饲料原料农田生产过程碳氮足迹空间变异与分析[J]. 中国农业大学学报, 2024, 29(12): 127-140.
|
|
|
|
| [41] |
doi: 10.1016/j.agee.2024.109168 |
| [42] |
doi: 10.1016/j.fcr.2023.108862 |
| [43] |
doi: 10.1016/j.gfs.2020.100444 |
| [44] |
杜岳峰, 傅生辉, 毛恩荣, 朱忠祥, 李臻. 农业机械智能化设计技术发展现状与展望[J]. 农业机械学报, 2019, 50(9): 1-17.
|
|
|
|
| [45] |
刘玮琪, 钟太洋. 农药零增长政策对农药施用总量和强度的影响[J]. 农业资源与环境学报, 2024, 41(4): 964-975.
|
|
|
| [1] | 姚治榛, 杨紫洪, 张英楠, 尹昌斌. 中国水稻绿色全要素生产率增长的时空分异与演进规律[J]. 中国农业科学, 2026, 59(9): 1937-1954. |
| [2] | 陈宣伊, 郭星星, 张向前, 路战远, 刘凌悦, 罗方, 李金龙, 张传玲, 张志青, 车曼青. 间作行比对玉米冠层光环境异质性和光合物质生产的影响[J]. 中国农业科学, 2026, 59(8): 1653-1671. |
| [3] | 朱琦, 贾振鹏, Tahir SHAH, 徐晨晟, 李芷琦, 吕会帅, 朱鹏超, 韦小敏, 黄冬琳, 孙艳妮, 曹卫东, 高亚军, 王朝辉, 张达斌. 绿肥配施增效产品降低旱地麦田温室气体排放及碳足迹[J]. 中国农业科学, 2026, 59(7): 1507-1522. |
| [4] | 李永娟, 张悦彤, 王艺博, 赵长江, 宋洁, 陈雪丽, 姚钦. 生物炭施用对大豆轮连作系统土壤固氮微生物nifH基因丰度及群落组成的影响[J]. 中国农业科学, 2026, 59(6): 1272-1285. |
| [5] | 刘方东, 孙磊, 王吴彬, 赵晋铭, 盖钧镒. 我国大豆种植制度的变更和生态栽培区划调整的建议[J]. 中国农业科学, 2026, 59(3): 486-498. |
| [6] | 申跃宇, 陈少侃, 马亚东, 刘建业, 张亚一, 陈桐, 赵鑫, 张歆, 屠焰. 低豆粕日粮对奶牛生产性能和甲烷排放量的影响[J]. 中国农业科学, 2026, 59(20): 4673-4683. |
| [7] | 刘丹丹, 丁文涛, 程起灿, 张瑜, 邢爱双, 郭祥龙, 邢邯, 郭娜, 赵晋铭. 大豆R6期籽粒氨基酸含量的遗传多样性与全基因组关联分析[J]. 中国农业科学, 2026, 59(20): 4461-4475. |
| [8] | 蔡廷阳, 朱玉鹏, 李瑞东, 吴宗声, 徐一帆, 宋雯雯, 徐彩龙, 吴存祥. 苗期叶损伤对黄淮海夏大豆光合特性、荚果分布及产量形成的影响[J]. 中国农业科学, 2026, 59(2): 292-304. |
| [9] | 王柯, 宫浩然, 王玉斌, 张彦威, 王彩洁, 刘鑫, 徐冉. 大豆品种产量源流库指标相互关系分析[J]. 中国农业科学, 2026, 59(16): 3519-3540. |
| [10] | 宋可心, 张茜南, 章金益, 孔影, 刘建, 兰青阔, 王永, 吴疆, 赵新. 转基因大豆WYN341GmC数字PCR精准定量检测方法的建立[J]. 中国农业科学, 2026, 59(14): 3022-3037. |
| [11] | 张新博, 范震, 吴昱霖, 王嘉豪, 罗璇, 林延荣, 强斌斌, 任小龙, 陈小莉. 玉米-大豆垄沟间作对半干旱地区作物产量和水分利用的影响[J]. 中国农业科学, 2026, 59(14): 3056-3069. |
| [12] | 柯丹霞, 侯仕博, 周兆源, 林佳诺, 宋晓莉, 张可馨. GmBI-1互作蛋白的筛选及GmNod44在大豆结瘤固氮过程中的功能[J]. 中国农业科学, 2026, 59(11): 2314-2324. |
| [13] | 刘芝妤, 陈伊洁, 于欢, 申茂廷, 邱丽娟, 王俊. 大豆持绿QTL定位及全基因组选择[J]. 中国农业科学, 2026, 59(10): 2075-2087. |
| [14] | 吴琼, 谢香庭, 王磊, 牟勇, 李进伟. 转基因大豆DBN8205转化体特异性定量PCR方法的研发和验证[J]. 中国农业科学, 2026, 59(1): 29-40. |
| [15] | 严孙辉, 罗程, 陈银基, 庄昕波. 细菌纤维素协同pH偏移处理对大豆分离蛋白凝胶特性与微观结构的影响[J]. 中国农业科学, 2025, 58(6): 1210-1222. |
|
||
