


中国农业科学 ›› 2019, Vol. 52 ›› Issue (12): 2128-2139.doi: 10.3864/j.issn.0578-1752.2019.12.010
张佳,聂继云( ),张惠,李静,李也
收稿日期:2019-01-29
接受日期:2019-03-30
出版日期:2019-06-16
发布日期:2019-06-22
通讯作者:
聂继云
作者简介:张佳,E-mail: zhangjia208@126.com。
基金资助:
ZHANG Jia,NIE JiYun(),ZHANG Hui,LI Jing,LI Ye
Received:2019-01-29
Accepted:2019-03-30
Online:2019-06-16
Published:2019-06-22
Contact:
JiYun NIE
摘要:
【目的】 探讨越橘品质指标间的相互关系,构建和完善越橘品质性状的综合评价体系,为合理评价越橘品质提供理论参考。【方法】 以92份越橘果实为材料,测定单果重、果形指数、果实硬度、维生素C含量、可溶性固形物含量、可滴定酸含量、固酸比7项品质指标,运用相关分析揭示指标间的相互关系,运用正态分布理论进行品质指标概率分级,利用因子分析确定越橘品质评价指标,运用层次分析确立评价指标的权重并建立指标评分标准。【结果】 越橘品质指标间离散程度差异很大,其变异系数分别为67.12%(固酸比)、45.46%(可滴定酸含量)、35.28%(单果重)、23.48%(维生素C含量)、18.23%(可溶性固形物含量)、18.05%(果实硬度)和6.05%(果形指数)。可滴定酸含量和维生素C含量均服从正态分布,概率值P均大于0.05,果形指数、果实硬度和可溶性固形物含量去掉个别极端值后,也服从正态分布,单果重的概率值P为0.0494,接近0.05,视为符合正态分布,固酸比呈偏态分布。可滴定酸含量和固酸比之间呈极显著的负相关,相关系数为-0.81742,二者间存在极显著的幂函数变化趋势,决定系数R 2为0.9005。筛选出4项越橘品质代表性指标,包括可溶性固形物含量(甜味指标)、可滴定酸含量(酸味指标)、维生素C含量(营养指标)和果实硬度(质地指标),4项代表性指标划分为5个等级,即极低、低、中、高和极高。建立4项代表性指标评分标准,将92份越橘果实划分为3个等级,即优等、中等和差等。 【结论】 越橘品质代表性指标包括可溶性固形物含量、可滴定酸含量、维生素C含量和果实硬度,建立的4项品质指标评分标准可用于越橘品质的科学评价与分类。
张佳, 聂继云, 张惠, 李静, 李也. 越橘品质指标评价[J]. 中国农业科学, 2019, 52(12): 2128-2139.
ZHANG Jia, NIE JiYun, ZHANG Hui, LI Jing, LI Ye. Evaluation Indexes for Blueberry Quality[J]. Scientia Agricultura Sinica, 2019, 52(12): 2128-2139.
表1
样品一览表"
| 编号 No. | 品种 Cultivar | 来源 Region | 品种群 Varieties | 编号 No. | 品种 Cultivar | 来源 Region | 品种群 Varieties | |
|---|---|---|---|---|---|---|---|---|
| 1 | 密斯蒂 Misty | 青岛 Qingdao | 南高丛 Southern highbush | 47 | 托柔 Turo | 营口 Yingkou | 北高丛 Northern highbush | |
| 2 | 蓝丰 Bluecrop | 青岛 Qingdao | 北高丛 Northern highbush | 48 | 奥尼尔 O'Neal | 营口 Yingkou | 南高丛 Southern highbush | |
| 3 | 北陆 Northland | 青岛 Qingdao | 半高丛 Half-high | 49 | 蓝金 Bluegold | 营口 Yingkou | 北高丛 Northern highbush | |
| 4 | 都克 Duke | 威海 Weihai | 北高丛 Northern highbush | 50 | 日升 Sunrise | 营口 Yingkou | 北高丛 Northern highbush | |
| 5 | 蓝天 Bluehaven | 威海 Weihai | 北高丛 Northern highbush | 51 | 布里吉塔 Brigitta | 营口 Yingkou | 北高丛 Northern highbush | |
| 6 | 哈迪蓝 Hardyblue | 威海 Weihai | 北高丛 Northern highbush | 52 | 达柔 Darrow | 营口 Yingkou | 北高丛 Northern highbush | |
| 7 | 普鲁 Puru | 威海 Weihai | 北高丛 Northern highbush | 53 | 康维尔 Coville | 营口 Yingkou | 北高丛 Northern highbush | |
| 8 | 瑞卡 Reka | 威海 Weihai | 北高丛 Northern highbush | 54 | 早蓝 Earliblue | 营口 Yingkou | 北高丛 Northern highbush | |
| 9 | 艾玛蓝 Amblue | 威海 Weihai | 北高丛 Northern highbush | 55 | 北卫 Patriot | 营口 Yingkou | 北高丛 Northern highbush | |
| 10 | 博吉塔蓝Briteblue | 威海 Weihai | 北高丛 Northern highbush | 56 | 奴依Nui | 营口 Yingkou | 北高丛 Northern highbush | |
| 11 | 奥林匹亚 Olimpia | 威海 Weihai | 北高丛 Northern highbush | 57 | 喜莱 Serria | 营口 Yingkou | 北高丛 Northern highbush | |
| 12 | 早蓝 Earliblue | 威海 Weihai | 北高丛 Northern highbush | 58 | 晚蓝 Lateblue | 营口 Yingkou | 北高丛 Northern highbush | |
| 13 | 蓝丰 Bluecrop | 威海 Weihai | 北高丛 Northern highbush | 59 | 达柔 Darrow | 营口 Yingkou | 北高丛 Northern highbush | |
| 14 | 蓝乐 Bluejay | 威海 Weihai | 北高丛 Northern highbush | 60 | 埃利奥特 Elliott | 营口 Yingkou | 北高丛 Northern highbush | |
| 15 | 久比力 Jubilee | 威海 Weihai | 北高丛 Northern highbush | 61 | 蓝丰Bluecrop | 丹东 Dandong | 北高丛 Northern highbush | |
| 16 | 蓝筹 Bluechip | 威海 Weihai | 北高丛 Northern highbush | 62 | 都克 Duke | 丹东 Dandong | 北高丛 Northern highbush | |
| 17 | 博尼法西Bonifacy | 威海 Weihai | 北高丛 Northern highbush | 63 | 奥林匹亚 Olimpia | 丹东 Dandong | 北高丛 Northern highbush | |
| 18 | 日升 Sunrise | 威海 Weihai | 北高丛 Northern highbush | 64 | 钱德勒 Chandler | 丹东 Dandong | 北高丛 Northern highbush | |
| 19 | 北陆 Northland | 威海 Weihai | 半高丛Half-high | 65 | 瑞卡 Reka | 丹东 Dandong | 北高丛 Northern highbush | |
| 20 | 蓝金 Bluegold | 威海 Weihai | 北高丛 Northern highbush | 66 | 泽西 Jersey | 丹东 Dandong | 北高丛 Northern highbush | |
| 21 | 奥尼尔 O'Neal | 威海 Weihai | 南高丛 Southern highbush | 67 | 普鲁 Puru | 丹东 Dandong | 北高丛 Northern highbush | |
| 22 | 密斯蒂 Misty | 威海 Weihai | 南高丛 Southern highbush | 68 | 布里吉塔 Brigitta | 丹东 Dandong | 北高丛 Northern highbush | |
| 23 | 北卫 Patriot | 威海 Weihai | 北高丛 Northern highbush | 69 | 伯克利 Berkeley | 丹东 Dandong | 北高丛 Northern highbush | |
| 24 | 双丰 Sweetheart | 威海 Weihai | 北高丛 Northern highbush | 70 | 达柔 Darrow | 丹东 Dandong | 北高丛 Northern highbush | |
| 25 | 康维尔 Coville | 威海 Weihai | 北高丛 Northern highbush | 71 | 赫伯特 Herberd | 丹东 Dandong | 北高丛 Northern highbush | |
| 26 | 斯巴坦 Spartan | 威海 Weihai | 北高丛 Northern highbush | 72 | 北村Northcountry | 丹东 Dandong | 半高丛Half-high | |
| 27 | 蓝塔 Bluetta | 威海 Weihai | 北高丛 Northern highbush | 73 | 蓝金 Bluegold | 大连 Dalian | 北高丛 Northern highbush | |
| 28 | 晚蓝 Lateblue | 威海 Weihai | 北高丛 Northern highbush | 74 | 伯克利 Berkeley | 大连 Dalian | 北高丛 Northern highbush | |
| 29 | 埃利奥特 Elliott | 威海 Weihai | 北高丛 Northern highbush | 75 | 北陆 Northland | 大连 Dalian | 半高丛Half-high | |
| 30 | 泽西 Jersey | 威海 Weihai | 北高丛 Northern highbush | 76 | 普特 Putte | 长春 Changchun | 矮丛 Lowbush | |
| 31 | 都克 Duke | 连云港 Lianyungang | 北高丛 Northern highbush | 77 | 蓝金 Bluegold | 长春 Changchun | 北高丛 Northern highbush | |
| 32 | 达柔 Darrow | 连云港 Lianyungang | 北高丛 Northern highbush | 78 | 奥若拉 Aurora | 长春 Changchun | 北高丛 Northern highbush | |
| 33 | 双丰 Sweetheart | 连云港 Lianyungang | 北高丛 Northern highbush | 79 | 都克 Duke | 长春 Changchun | 北高丛 Northern highbush | |
| 34 | 北陆 Northland | 连云港 Lianyungang | 半高丛Half-high | 80 | AF4 | 长春 Changchun | 北高丛 Northern highbush | |
| 35 | 奥尼尔 O'Neal | 连云港 Lianyungang | 南高丛 Southern highbush | 81 | HL11 | 长春 Changchun | 北高丛 Northern highbush | |
| 36 | 布里吉塔 Brigitta | 连云港 Lianyungang | 北高丛 Northern highbush | 82 | 伯克利 Berkeley | 长春 Changchun | 北高丛 Northern highbush | |
| 37 | 蓝丰 Bluecrop | 连云港 Lianyungang | 北高丛 Northern highbush | 83 | 种植者 Grower | 长春 Changchun | 北高丛 Northern highbush | |
| 38 | 瑞卡 Reka | 连云港 Lianyungang | 北高丛 Northern highbush | 84 | 雷戈西 Legacy | 长春 Changchun | 北高丛 Northern highbush | |
| 39 | 泽西 Jersey | 营口 Yingkou | 北高丛 Northern highbush | 85 | AF1 | 长春 Changchun | 北高丛 Northern highbush | |
| 40 | 伯克利 Berkeley | 营口 Yingkou | 北高丛 Northern highbush | 86 | 蓝丰 Bluecrop | 通化 Tonghua | 北高丛 Northern highbush | |
| 41 | 齐佩瓦 Chippewa | 营口 Yingkou | 半高丛Half-high | 87 | 蓝金 Bluegold | 通化 Tonghua | 北高丛 Northern highbush | |
| 42 | 北陆 Northland | 营口 Yingkou | 半高丛Half-high | 88 | 北蓝 Northblue | 通化 Tonghua | 半高丛Half-high | |
| 43 | 斯巴坦 Spartan | 营口 Yingkou | 北高丛 Northern highbush | 89 | 北陆 Northland | 通化 Tonghua | 北高丛 Northern highbush | |
| 44 | 黑珍珠 Blackpearl | 营口 Yingkou | 北高丛 Northern highbush | 90 | 都克 Duke | 通化 Tonghua | 北高丛 Northern highbush | |
| 45 | 蓝丰 Bluecrop | 营口 Yingkou | 北高丛 Northern highbush | 91 | 伯克利 Berkeley | 通化 Tonghua | 北高丛 Northern highbush | |
| 46 | 瑞卡 Reka | 营口 Yingkou | 北高丛 Northern highbush | 92 | 埃利奥特 Elliott | 通化 Tonghua | 北高丛 Northern highbush |
表2
7 项品质指标的变异情况"
| 指标 Index | 变幅 Range | 平均数 Mean | 标准差 Standard deviation | 变异系数 CV (%) |
|---|---|---|---|---|
| 单果重Fruit weight (g) | 0.68—5.21 | 1.99 | 0.70 | 35.28 |
| 果实硬度Fruit firmness (g·mm-1) | 73.7—200.1 | 148.4 | 26.78 | 18.05 |
| 果形指数Fruit shape | 0.65—0.88 | 0.73 | 0.04 | 6.05 |
| 维生素C含量Vitamin C (mg/100 g) | 6.6—18.9 | 10.9 | 2.56 | 23.48 |
| 可溶性固形物含量Total soluble solid (%) | 8.3—20 | 12.4 | 2.26 | 18.23 |
| 可滴定酸含量Titratable acidity (%) | 0.15—1.54 | 0.7 | 0.34 | 45.46 |
| 固酸比Total soluble solid/Titratable acidity | 6.7—89.5 | 22.1 | 14.81 | 67.12 |
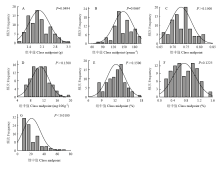
图1
7项品质指标频次分布图A:单果重;B:果实硬度;C:果形指数;D:维生素C含量;E:可溶性固形物含量;F:可滴定酸含量;G:固酸比"
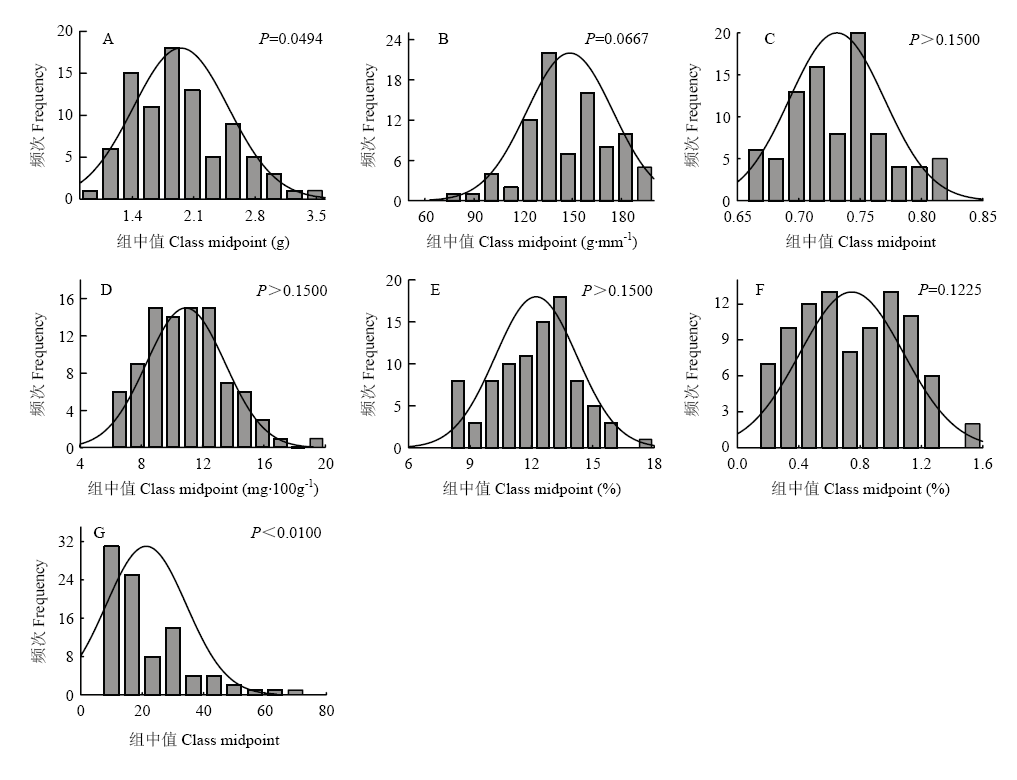
表3
7 项品质指标的相关系数"
| 指标 Index | 单果重 Fruit weight | 果实硬度 Fruit firmness | 果形指数 Fruit shape index | 维生素C含量 Vitamin C | 可溶性固形物含量 Total soluble solid | 可滴定酸含量 Titratable acidity |
|---|---|---|---|---|---|---|
| 果实硬度Fruit firmness | 0.0890 | |||||
| 果形指数Fruit shape index | -0.6044** | 0.0443 | ||||
| 维生素C含量Vitamin C | -0.4590** | 0.2394 | 0.2824 | |||
| 可溶性固形物含量Total soluble solid | -0.4100** | 0.1609 | 0.0441 | 0.4588** | ||
| 可滴定酸含量Titratable acidity | 0.3439 | 0.0971 | -0.4427** | -0.3919 | -0.1052 | |
| 固酸比Total soluble solid/titratable acidity | -0.3443 | -0.0099 | 0.4210** | 0.4784** | 0.2846 | -0.8174** |
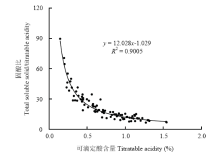
图2
固酸比与可滴定酸含量之间的幂函数回归曲线"

图3
92份越橘样品聚类结果"

表4
7项品质指标因子分析结果"
| 指标 Index | 因子权重 Component weight | |||
|---|---|---|---|---|
| 因子1 Component 1 | 因子2 Component 2 | 因子3 Component 3 | 因子4 Component 4 | |
| 单果重Fruit weight | -0.072 | 0.583 | 0.694 | -0.264 |
| 果实硬度Fruit firmness | -0.104 | -0.180 | -0.024 | -0.949 |
| 果形指数Fruit shape index | 0.325 | -0.054 | -0.187 | -0.081 |
| 维生素C含量Vitamin C | 0.369 | -0.669 | -0.872 | -0.247 |
| 可溶性固形物Total soluble solid | 0.080 | -0.860 | 0.173 | -0.137 |
| 可滴定酸含量Titratable acidity | -0.934 | 0.063 | 0.186 | -0.067 |
| 固酸比Total soluble solid/ titratable acidity | 0.824 | -0.254 | -0.075 | 0.059 |
| 贡献率 Variance contribution | 28.4% | 25.3% | 16.5% | 15.2% |
| 累积贡献率Percent of variance | 28.4% | 53.7% | 70.2% | 85.4% |
表5
4项品质指标的分级结果"
| 指标 Index | 样本量 Sample size | 等级 Grade | 极低 Lower | 低 Low | 中 Medium | 高 High | 极高 Higher |
|---|---|---|---|---|---|---|---|
| 果实硬度Fruit firmness | 88 | 标准Standard (g·mm-1) | <114.8 | 114.8—134.7 | 134.8—162.4 | 162.5—182.3 | >182.3 |
| 分布Distribution (%) | 8 | 24 | 36 | 18 | 14 | ||
| 维生素C含量Vitamin C | 92 | 标准Standard (mg/100 g) | <7.6 | 7.6—9.5 | 9.6—12.2 | 12.3—14.2 | >14.2 |
| 分布Distribution (%) | 8 | 28 | 34 | 18 | 12 | ||
| 可溶性固形物含量Total soluble solid | 90 | 标准Standard (%) | <9.7 | 9.7—11.2 | 11.3—13.3 | 13.4—14.8 | >14.8 |
| 分布Distribution (%) | 12 | 19 | 39 | 22 | 8 | ||
| 可滴定酸含量Titratable acidity | 92 | 标准Standard (%) | <0.31 | 0.31—0.57 | 0.58—0.92 | 0.93—1.18 | >1.18 |
| 分布Distribution (%) | 11 | 23 | 32 | 26 | 9 |
表6
越橘品质指标判别矩阵"
| 指标 Index | 果实硬度 Fruit firmness | 维生素C含量 Vitamin C | 可溶性固形物含量 Total soluble solid | 可滴定酸含量 Titratable acidity | 指标权重 Index weight (%) |
|---|---|---|---|---|---|
| 果实硬度Fruit firmness | 1 | 1/3 | 1/4 | 1/4 | 8.41 |
| 维生素C含量Vitamin C | 3 | 1 | 1 | 1 | 29.13 |
| 可溶性固形物含量Total soluble solid | 4 | 1 | 1 | 1 | 31.23 |
| 可滴定酸含量Titratable acidity | 4 | 1 | 1 | 1 | 31.23 |
表7
4项品质指标评分标准"
| 指标 Index | 指标值 Index value | 得分 Score | 指标值 Index value | 得分 Score | 指标值 Index value | 得分 Score | 指标值 Index value | 得分 Score | 指标值 Index value | 得分 Score | ||||
|---|---|---|---|---|---|---|---|---|---|---|---|---|---|---|
| 硬度Fruit firmness (g·mm-1) | <114.8 | 1.68 | 114.8—134.7 | 3.36 | 134.8—162.4 | 5.05 | 162.5—182.3 | 6.73 | >182.3 | 8.41 | ||||
| 维生素C Vitamin C (mg·100g-1 ) | <7.6 | 5.83 | 7.6—9.5 | 11.65 | 9.6—12.2 | 17.48 | 12.3—14.2 | 23.30 | >14.2 | 29.13 | ||||
| 可溶性固形物Total soluble solid (%) | <9.7 | 6.25 | 9.7—11.2 | 12.49 | 11.3—13.3 | 18.74 | 13.4—14.8 | 24.98 | >14.8 | 31.23 | ||||
| 可滴定酸Titratable acidity (%) | <0.31 | 31.23 | 0.31—0.57 | 24.98 | 0.58—0.92 | 18.74 | 0.93—1.18 | 12.49 | >1.18 | 6.25 |
表8
越橘样品指标聚类分布情况"
| 等级 Grade | 样品数 Samples | 果实硬度 Fruit firmness (g·mm-1) | 维生素C含量 Vitamin C (mg/100 g) | 可溶性固形物含量 Total soluble solid (%) | 可滴定酸含量 Titratable acidity (%) | ||||||||
|---|---|---|---|---|---|---|---|---|---|---|---|---|---|
| 变幅 Range | 平均值 Mean | 标准差 SD | 变幅 Range | 平均值 Mean | 标准差 SD | 变幅 Range | 平均值 Mean | 标准差 SD | 变幅 Range | 平均值 Mean | 标准差 SD | ||
| 优Superior | 28 | 121.9—196.3 | 153.7 | 20.9 | 9.5—18.9 | 12.8 | 2.3 | 12.3—20.0 | 14.8 | 1.8 | 0.24—1.14 | 0.69 | 0.3 |
| 中Medium | 30 | 73.7—200.1 | 145.6 | 32.1 | 7.7—15.6 | 11.4 | 2.1 | 8.4—13.9 | 11.8 | 1.4 | 0.15—0.88 | 0.46 | 0.2 |
| 差Inferior | 34 | 93.4—194.0 | 146.4 | 26.1 | 6.6—12.3 | 8.9 | 1.6 | 8.3—13.8 | 11.0 | 1.6 | 0.60—1.54 | 1.04 | 0.2 |
表9
92份越橘样品的评价等级"
| 等级 Grade | 样品编号 Sample number |
|---|---|
| 优Superior | 6、9、10、11、12、13、14、18、23、26、27、30、33、39、40、43、44、46、49、50、52、53、54、55、56、57、58、73 |
| 中Medium | 1、2、3、4、16、19、21、31、32、34、35、37、38、41、42、45、47、48、51、59、60、62、72、74、79、82、84、88、90、91 |
| 差Inferior | 5、7、8、15、17、20、22、24、25、28、29、36、61、63、64、65、66、67、68、69、70、71、75、76、77、78、80 、81、83、85、86、87、89、92 |
| [1] | 胡秋丽, 辛秀兰, 孙海悦, 张强, 陈亮, 李亚东 . 越橘植物化学成分研究进展. 特产研究, 2017,39(1):52-63. |
| HU Q L, XIN X L, SUN H Y, ZHANG Q, CHEN L, LI Y D . Research progresses on blueberry of phytochemical constituents. Special Wild Economic Animal and Plant Research, 2017,39(1):52-63. (in Chinese) | |
| [2] | 刘庆忠, 朱东姿, 王甲威, 公庆党, 辛力 . 世界越橘产业发展现状—中国篇. 落叶果树, 2018,50(6):1-4. |
| LIU Q Z, ZHU D Z, WANG J W, GONG Q S, XIN L . The status of world blueberry industry development-China. Deciduous Fruit, 2018,50(6):1-4. (in Chinese) | |
| [3] | 郑红岩, 高梦, 刘建兰, 刘同方, 陈雁梅, 于华忠 . 不同品种越橘果实品质分析. 食品与发酵工业, 2013,39(11):245-249. |
| ZHENG H Y, GAO M, LIU J L, LIU T F, CHEN Y M, YU H Z . Analysis of fruit quality of different varieties of blueberries. Food and Fermentation Industries, 2013,39(11):245-249. (in Chinese) | |
| [4] | 刘丙花, 孙锐, 王开芳, 舒秀阁, 孙蕾 . 不同越橘品种果实品质比较与综合评价. 食品科学, 2019,40(1):70-76. |
| LIU B H, SUN R, WANG K F, SHU X G, SUN L . Comparison and comprehensive evaluation of quality in different blueberry varieties. Food Science, 2019, 40(1):70-76. (in Chinese) | |
| [5] | YANG W Q, HARPOLE J, FINN C E, STRIK B C . Evaluating berry firmness and total soluble solids of newly released highbush blueberry cultivars. Acta Horticulturae, 2009, ( 810):863-868. |
| [6] |
SAFTNER R, POLASHOCK J, EHLENFELDT M, VINYAR B . Instrumental and sensory quality characteristics of blueberry fruit from twelve cultivars. Postharvest Biology and Technology, 2008,49:19-26.
doi: 10.1016/j.postharvbio.2008.01.008 |
| [7] | 谢国芳, 王艳, 罗桥兰, 周笑犁, 刘志刚 . 因子综合法评价贵州不同产地越橘果实品质. 食品与发酵工业, 2018,44(4):248-253. |
| XIE G F, WANG Y, LUO Q L, ZHOU X L, LIU Z G . Comprehensive factor evaluation of blueberry quality from different regions. Food and Fermentation Industry, 2018,44(4):248-253. (in Chinese) | |
| [8] | 谢跃杰, 王仲明, 王强, 张忠明, 熊政委, 吴洪斌 . 不同品种和成熟度越橘理化特性的主成分分析评价. 食品科学, 2017,38(23):94-99. |
| XIE Y J, WANG Z M, WANG Q, ZHANG Z M, XIONG Z W, WU H B . Assessment of the differences in physical, chemical and phytochemical properties of different blueberry cultivars harvested at different dates using principal component analysis. Food Science, 2017,38(23):94-99. (in Chinese) | |
| [9] |
MOGGIA C, GRAELL J, LARA I, SCHMEDA-HIRSCHMANN G ,THOMAS-VALDÉS S, LOBOS G A. Fruit characteristics and cuticle triterpenes as related to postharvest quality of highbush blueberries. Scientia Horticulturae, 2016,211:449-457.
doi: 10.1016/j.scienta.2016.09.018 |
| [10] |
朱诗慧, 孟宪军, 颜廷才, 李斌, 李冬男 . 辽宁主栽越橘品种加工适应性的研究. 食品科学, 2014,35(21):79-83.
doi: 10.7506/spkx1002-6630-201421016 |
|
ZHU S H, MENG X J, YAN T C, LI B, LI D N . Studies on processing adaptability of main blueberry cultivars in Liaoning province. Food Science, 2014,35(21):79-83. (in Chinese)
doi: 10.7506/spkx1002-6630-201421016 |
|
| [11] | 蔡楠, 陈金印, 彭旋, 陈楚英 . 主成分分析法对‘新余蜜橘’果实常温贮藏效果的评价. 中国果树, 2018(6):10-13. |
| CAI N, CHEN J Y, PENG X, CHEN C Y . Evaluation of principle component analysis on postharvest characteristic of ‘Xinyu tangerine’ fruit during ambient temperature storage.China Fruit, 2018(6):10-13. (in Chinese) | |
| [12] | 李雪, 梁叶星, 许晶冰, 刘剑飞, 张雪梅, 杨世雄, 张玲, 张欢欢 . 重庆地区鲜食葡萄品质综合评价. 食品与发酵工业, 2019. doi: 10.13995/j.cnki.11-1802/ts.019358. |
| LI X, LIANG Y X, XU J B, LIU J F, ZHANG X M, YANG S X, ZHANG L, ZHANG H H . Comprehensive evaluation of fruit quality of table grape in Chongqing area. Food and Fermentation Industries, 2019. doi: 10.13995/j.cnki.11-1802/ts.019358. (in Chinese) | |
| [13] | 郑丽静, 聂继云, 李明强, 康艳玲, 匡立学, 叶孟亮 . 苹果风味评价指标的筛选研究. 中国农业科学, 2015,48(14):2796-2805. |
| ZHENG L J, NIE J Y, LI M Q, KANG Y L, KUANG L X, YE M L . Study on screening of taste evaluation indexes for apple. Scientia Agricultura Sinica, 2015,48(14):2796-2805. (in Chinese) | |
| [14] | 赵建华, 述小英, 李浩霞, 郑慧文, 尹跃, 安巍, 王亚军 . 不同果色枸杞鲜果品质性状分析及综合评价. 中国农业科学, 2017,50(12):2338-2348. |
| ZHAO J H, SHU X Y, LI H X, ZHENG H W, YIN Y, AN W, WANG Y J . Analysis and comprehensive evaluation of the quality of wolfberry ( Lycium L.) fresh fruits with different fruit colors. Scientia Agricultura Sinica, 2017,50(12):2338-2348. (in Chinese) | |
| [15] |
聂继云, 李志霞, 李海飞, 李静, 王昆, 毋永龙, 徐国锋, 闫震, 吴锡, 覃兴 . 苹果理化品质评价指标研究. 中国农业科学, 2012,45(14):2895-2903.
doi: 10.3864/j.issn.0578-1752.2012.14.012 |
|
NIE J Y, LI Z X, LI H F, LI J, WANG K, WU Y L, XU G F, YAN Z, WU X, QIN X . Evaluation indices for apple physicochemical quality. Scientia Agricultura Sinica, 2012,45(14):2895-2903. (in Chinese)
doi: 10.3864/j.issn.0578-1752.2012.14.012 |
|
| [16] | 苟小菊, 田由, 郭玉蓉, 杨曦, 侯燕杰, 平嘉欣, 李婷 . 不同成熟期苹果品种非浓缩还原汁品质评价与分析. 中国农业科学, 2018,51(19):3778-3790. |
| GOU X J, TIAN Y , GUO Y R R, YANG X, HOU Y J, PING J X, LI T. Analysis and evaluation on quality of NFC apple juices in different maturation period. Scientia Agricultura Sinica, 2018,51(19):3778-3790. (in Chinese) | |
| [17] | 刘孟军 . 枣树数量性状的概率分级研究. 园艺学报, 1996,23(2):105-109. |
| LIU M J . Studies on the variation and probability grading of major quantitative characters of Chinese jujube. Acta Horticulturae Sinica, 1996,23(2):105-109. (in Chinese) | |
| [18] | 李京璟, 梁丽松, 王贵禧, 张日清, 马庆华 . 平榛种质资源坚果主要数量性状评价与分级研究. 塔里木大学学报, 2016,28(3):96-102. |
| LI J Z, LIANG L S, WANG G Z, ZHANG R Q, MA Q H . Evaluation and probability grading of main nut quantitative traits of Corylus heterophylla fisch. Journal of Tarim University, 2016,28(3):96-102. (in Chinese) | |
| [19] | 李玄, 刘玉林, 刘永红, 王媛 . 杏核仁主要性状变异及概率分级. 北方园艺, 2017(24):33-38. |
| LI X, LIU Y L, LIU Y H, WANG Y . Variation and probability grading of main traits ofArmeniaca vulgaris Lam. Northern Horticulture, 2017(24):33-38. (in Chinese) | |
| [20] | 聂继云 . 果品及其制品质量安全检测·营养品质和功能成分. 北京: 中国质检出版社, 2017: 168-170. |
| NIE J Y. Determining Quality and Safety of Fruits and Derived Products·Nutritional Quality and Functional Components. Beijing: China Quality Inspection Press, 2017: 168-170. (in Chinese) | |
| [21] | 孙小红, 周瑾, 胡绍泉, 吕洪飞, 王国夫 . 香榧籽的品质分级与综合评价. 果树学报, 2018,35(10):1286-1296. |
| SUN X H, ZHOU J, HU S Q, LÜ H F, WANG G F . Quality-based grading system and integrated evaluation for Torreya grandis ‘Merrilli’. Journal of Fruit Science, 2018,35(10):1286-1296. (in Chinese) | |
| [22] | 华中农学院. 果树研究法. 北京: 农业出版社, 1979. |
| Huazhong Agricultural College. Research Methods for Fruit Tree. Beijing: Agricultural Press, 1979. (in Chinese) | |
| [23] | 聂继云, 李海飞, 李静, 王昆, 李志霞, 毋永龙 . 基于159个品种的苹果鲜榨汁风味评价指标研究. 园艺学报, 2012,39(10):1999-2008. |
| NIE J Y, LI H F, LI J, WANG K, LI Z X, WU Y L . Studies on taste evaluation indices for fresh apple juice based on 159 cultivars. Acta Horticulturae Sinica, 2012,39(10):1999-2008. (in Chinese) | |
| [24] | 马之胜, 王越辉, 贾云云, 宣立锋, 王建学 . 桃种质资源果实硬度评价及概率分级. 西南农业学报, 2009,22(1):167-169. |
| MA Z S, WANG Y H, JIA Y Y, XUAN L F, WANG J X . Evaluation and probability classification of fruit hardness of peach germplasm resources. Southwest Journal of Agricultural Science, 2009,22(1):167-169. (in Chinese) | |
| [25] | 刘平, 刘孟军, 周俊义, 毕平 . 枣树数量性状的分布及其概率分级指标体系. 林业科学, 2003,29(6):77-82. |
| LIU P, LIU M J, ZHOU J Y, BI P . Distribution and probability grading index system of quantitative character of Chinese jujube. Scientia Silvae Sinicae, 2003,39(6):77-82. (in Chinese) | |
| [26] | 吴文龙, 李永荣, 方亮, 刘永芝, 翟敏, 李雪 . 薄壳山核桃果实性状的遗传变异与相关性研究. 经济林研究, 2010,28(3):25-30. |
| WU W L, LI Y R, FANG L, LIU Y Z, MIN M, LI X . Correlation between genetic variations of nut characters in pecan. Nonwood Forest Research , 2010,28(3):25-30. (in Chinese) | |
| [27] |
刘青柏, 刘明国, 肖德平, 纪连军, 杨玉玲 . 辽西朝阳地区酸枣种质果实主要性状特征. 林业科学, 2016,52(4):38-47.
doi: 10.11707/j.1001-7488.20160405 |
|
LIU Q B, LIU M G, XIAO D P, JI L J, YANG Y L . Main fruit characteristics of Ziziphus acidojujuba germplasm resources in Chaoyang, Western Liaoning province. Scientia Silvae Sinicae, 2016,52(4):38-47. (in Chinese)
doi: 10.11707/j.1001-7488.20160405 |
|
| [28] | 马小河, 赵旗峰, 董志刚, 唐晓萍, 王敏, 任瑞 . 鲜食葡萄品种资源果实数量性状变异及概率分级. 植物遗传资源学报, 2013,14(6):1185-1189. |
| MA X H, ZHAO Q F, DONG Z G, TANG X P, WANG M, REN R . Variation and probability grading of main quantitative traits of table grape resources. Journal of Plant Genetic Resources, 2013,14(6):1185-1189. (in Chinese) | |
| [29] | 蒲光兰, 肖千文, 蔡利娟, 罗永飞, 邹雪梅 . 四川核桃种质资源坚果的数量性状变异及概率分级. 湖南农业大学学报(自然科学版), 2015,41(6):647-650. |
| PU G L, XIAO Q W, CAI L J, LUO Y F, ZOU X M . Variation and probability grading of main quantitative traits of walnut ( Juglans regia L.) germplasm resources. Journal of Hunan Agricultural University (Natural Sciences Edition), 2015,41(6):647-650. (in Chinese) | |
| [30] | 赵海娟, 刘威生, 刘宁, 张玉萍, 章秋平, 刘硕 . 普通杏种质资源果实主要数量性状变异及概率分级. 果树学报, 2013,30(1):37-42. |
| ZHAO H J, LIU W S, LIU N, ZHANG Y P, ZHANG Q P, LIU S . Variation and probability grading of main quantitative traits of apricot ( Armeniaca vulgaris) germplasm. Journal of Fruit Science, 2013,30(1):37-42. (in Chinese) | |
| [31] | 朱麟, 凌建刚, 尚海涛, 陈曙颖, 崔燕, 康孟利 . 因子分析法综合评价冰温结合1-MCP处理对‘玉露’水蜜桃贮藏品质的影响. 果树学报, 2016,33(9):1164-1172. |
| ZHU L, LING J G, SHANG H T, CHEN S Y, CUI Y, KANG M L . Factor analysis of the effects of controlled freezing-point storage in combination with 1-MCP treatment on quality of ‘Yulu’ juicy peaches during cold storage. Journal of Fruit Science, 2016,33(9):1164-1172. (in Chinese) | |
| [32] | 倪志华, 郭娟华, 辜青青, 黄春辉, 曲雪艳, 徐小彪 . 南丰蜜橘品质评价指标的聚类分析. 江西农业大学学报, 2011,33(4):670-673. |
| NI Z H, GUO J H, GU Q Q, HUANG C H, QU X Y, XU X B . Cluster analysis of fruit quality evaluation indices of Nanfeng tangerine. Acta Agriculturae Universitatis Jiangxiensis, 2011,33(4):670-673. (in Chinese) | |
| [33] | 马庆华, 李永红, 梁丽松, 王海, 许元峰, 孙玉波, 王贵禧 . 冬枣优良单株综合评价体系的建立. 农业系统科学与综合研究, 2011,27(3):321-327. |
| MA Q H, LI Y H, LIANG L S, WANG H, XU Y F, SUN Y B, WANG G X . Establishment of the synthetical evaluation system for Dongzao ( Zizyphus jujuba Mill. Dongzao’) advanced selections. ‘System Sciences and Comprehensive Studies in Agriculture, 2011,27(3):321-327. (in Chinese) | |
| [34] | 聂继云, 毋永龙, 李海飞, 王昆, 李静, 李志霞, 徐国锋 . 苹果品种用于加工鲜榨汁的适宜性评价. 农业工程学报, 2013,29(17):271-278. |
| NIE J Y, WU Y L, LI H F, WANG K, LI J, LI Z X, XU G F . Suitability evaluation of apple cultivars for fresh juice-processing. Transactions of the Chinese Society of Agricultural Engineering, 2013,29(17):271-278. (in Chinese) | |
| [35] | 白世践, 李超, 户金鸽 . 层次-关联分析法在引种鲜食葡萄品质综合评价中的应用. 北方园艺, 2016(16):1-8. |
| BAI S J, LI C, HU J G . Application of Hierarchy-Correlation Analysis in comprehensive evaluation of fresh grape quality.Northern Horticulture, 2016(16):1-8. (in Chinese) | |
| [36] | 黄正金, 卫云丽, 张春红, 闾连飞, 李维林, 吴文龙 . 基于层次分析法的5个黑莓杂交品系的综合评价. 南京林业大学学报(自然科学版), 2019,43(16):135-140. |
| HUANG Z J, WEI Y L, ZHANG C H, LYU L F, LI W L, WU W L . Comprehensive evaluation of five blackberry hybrid strains by Analytic Hierarchy Process (AHP). Journal of Nanjing Forestry University (Natural Sciences Edition), 2019,43(1):135-140. (in Chinese) | |
| [37] |
唐忠厚, 魏猛, 陈晓光, 史新敏, 张爱君, 李洪民, 丁艳锋 . 不同肉色甘薯块根主要营养品质特征与综合评价. 中国农业科学, 2014,47(9):1705-1714.
doi: 10.3864/j.issn.0578-1752.2014.09.005 |
|
TANG Z H, WEI M, CHEN X G, SHI X M, ZHANG A J, LI H M, DING Y F . Characters and comprehensive evaluation of nutrient quality of sweet potato storage root with different flesh colors. Scientia Agricultura Sinica, 2014,47(9):1705-1714. (in Chinese)
doi: 10.3864/j.issn.0578-1752.2014.09.005 |
|
| [38] | 卜凡琼, 杨颖迪, 刘新伟, 彭帮柱 . 不同产地越橘关键品质因子分析及其抗氧化特性. 食品工业科技, 2018,39(21):48-52, 60. |
| BU F Q, YANG Y D, LIU X W, PENG B Z . Analysis of key quality factors and antioxidant activity of blueberry from different producing areas. Food Industry Technology, 2018,39(21):48-52, 60. (in Chinese) | |
| [39] | 刘丽, 尹克林, 刘禹 . 重庆地区不同草莓品种果实品质分析. 中国南方果树, 2012,41(4):102-104. |
| LIU L, YIN K L, LIU Y . Analysis of fruit quality of different strawberry varieties in Chongqing. Journal of South China Fruit Science, 2012,41(4):102-104. (in Chinese) | |
| [40] | 古丽尼沙·卡斯木, 木合塔尔·扎热, 张东亚, 郭靖, 艾吉尔·阿布拉, 盛玮 , 阿布都热西提·热合曼. 基于因子分析的无花果引进品种果实品质性状综合评价. 食品科学, 2018,39(1):99-104. |
| GULNISA Kasim, MUHTAR Zari, ZHANG D Y, GUO J, AJAR Abla, SHENG W, ABUDUREXIT Rahman . Factor analysis and comprehensive evaluation of fruit quality traits of introduced fig cultivars. Food Science, 2018,39(1):99-104. (in Chinese) | |
| [41] | 穆瑞, 樊卫国 . 不同大小的刺梨果实品质特征及重要指标间的相关性. 中国南方果树, 2018,47(5):122-127. |
| MU R, FAN W G . Quality characteristics and correlation between important indexes of different sizes of prickly pear fruits. Journal of South China Fruit Science, 2018,47(5):122-127. (in Chinese) | |
| [42] | 焦艺, 刘璇, 毕金峰, 吴昕烨, 周沫, 曾目成 . 蟠桃品种用于加工鲜榨汁的适宜性评价. 食品科学, 2015,36(1):41-45. |
| JIAO Y, LIU X, BI J F, WU X Y, ZHOU M, ZENG M C . Suitability evaluation of flat peach cultivars for fresh juice processing. Food Science, 2015,36(1):41-45. (in Chinese) | |
| [43] | 王依, 雷靖, 陈成, 徐明, 邴昊阳, 雷玉山 . 美味猕猴桃新品种‘瑞玉’果实品质综合评价. 西北农林科技大学学报(自然科学版), 2018,46(10):101-107, 125. |
| WANG Y, LEI J, CHEN C, XU M, BING H Y, LEI Y S . Comprehensive evaluation of fruit quality of a new delicious kiwifruit variety ‘Ruiyu’. Journal of Northwest A&F University (National Science Edition), 2018,46(10):101-107, 125. (in Chinese) | |
| [44] | 关军锋 . 果品品质研究. 石家庄: 河北科学技术出版社, 2001. |
| GUAN J F. Research on Fruit Quality. Shijiazhuang: Hebei Science and Technology Press, 2001. (in Chinese) | |
| [45] | LOBOS G A, CALLOW P, HANCOCK J F . The effect of delaying harvest date on fruit quality and storage of late highbush blueberry cultivars ( Vaccinium corymbosum L.). Postharvest Biology and Technology, 2014,87:133-139. |
| [46] |
PANGBORN R M . Relative taste of selected sugars and organic acid. Journal of Food Science, 1963,28(6):726-733.
doi: 10.1111/jfds.1963.28.issue-6 |
| [47] | DOTY T E . Fructose sweetness: A new dimension. Cereal Foods World, 1976,21:62-63. |
| [48] | CHANG L T . The sweetness of sugars. Journal of South China University of Technology, 2002,30(1):89-91. |
| [49] | SOUTY M, ANDRÉ P . Composition biochimique et qualité des pêches. Annales De Technologie Agricole, 1975,24:217-236. |
| [1] | 朱大伟,章林平,陈铭学,方长云,于永红,郑小龙,邵雅芳. 中国优质稻品种品质及食味感官评分值的特征[J]. 中国农业科学, 2022, 55(7): 1271-1283. |
| [2] | 冯俊杰,赵文达,张新全,刘英杰,袁帅,董志晓,熊毅,熊艳丽,凌瑶,马啸. 引种日本多花黑麦草标准品种DUS性状变异分析及应用[J]. 中国农业科学, 2022, 55(12): 2447-2460. |
| [3] | 刘有春,刘威生,王兴东,孙斌,刘修丽,杨艳敏,魏鑫,杨玉春,张舵,刘成,李天忠. 基于简化基因组测序的越橘杂交后代鉴定[J]. 中国农业科学, 2021, 54(2): 370-378. |
| [4] | 刘有春,刘威生,王兴东,杨艳敏,魏鑫,孙斌,张舵,杨玉春,刘成,李天忠. 基于越橘南高丛与北高丛正反交群体的果实贮藏相关性状筛选及其遗传倾向[J]. 中国农业科学, 2020, 53(19): 4045-4056. |
| [5] | 匡立学,聂继云,李银萍,程杨,沈友明. 中国不同地区‘富士’苹果品质评价[J]. 中国农业科学, 2020, 53(11): 2253-2263. |
| [6] | 曾祥媛,赵武奇,卢丹,吴妮,孟永宏,高贵田,雷玉山. 超声波对猕猴桃片的渗糖效果及干燥能耗与品质的影响[J]. 中国农业科学, 2019, 52(4): 725-737. |
| [7] | 宋杨,刘红弟,王海波,张红军,刘凤之. 越橘VcNAC072克隆及其促进花青素积累的功能分析[J]. 中国农业科学, 2019, 52(3): 503-511. |
| [8] | 贾梦科,吴忠,赵武奇,卢丹,张清安,张宝善,宋树杰. 气体射流冲击干燥苹果片的响应面试验及多目标优化[J]. 中国农业科学, 2019, 52(15): 2695-2705. |
| [9] | 吴宣毅,曹红霞,王虎兵,郝舒雪. 不同种植行距和灌水量对中国西北地区日光温室短季节栽培番茄品质的交互影响[J]. 中国农业科学, 2018, 51(5): 940-951. |
| [10] | 白永超,卫旭芳,陈露,万如萌,侯智霞. 笃斯越橘果实、叶片矿质元素和土壤肥力因子与果实品质的多元分析[J]. 中国农业科学, 2018, 51(1): 170-181. |
| [11] | 吕健,刘璇,毕金峰,周林燕,吴昕烨. 桃变温压差膨化脆片品质评价研究[J]. 中国农业科学, 2016, 49(4): 802-812. |
| [12] | 魏鑫,魏永祥,郭丹,孙斌,王兴东,刘成. 不同打破休眠方式对‘密斯梯’越橘叶片光合特性及保护酶活性的影响[J]. 中国农业科学, 2015, 48(22): 4517-4528. |
| [13] | 王春青,李侠,张春晖,李学科,杜桂红,李海,谢小雷. 不同品种鸡蒸煮加工适宜性评价技术研究[J]. 中国农业科学, 2015, 48(15): 3090-3100. |
| [14] | 刘有春,魏永祥,王兴东,刘成,蒋明三,张舵,袁兴福,陶承光. 南高丛越橘品种‘Sapphire’和北高丛品种‘Berkeley’ 正反交后代果实糖酸组分含量的遗传倾向[J]. 中国农业科学, 2014, 47(24): 4878-4885. |
| [15] | 刘有春12, 陶承光3, 魏永祥2, 刘成2, 王兴东2, 刘威生2, 杨艳敏2. 越橘果实糖酸含量和不同发育阶段的变化及其与叶片中可溶性糖含量的相关关系[J]. 中国农业科学, 2013, 46(19): 4110-4118. |
|
||