


中国农业科学 ›› 2019, Vol. 52 ›› Issue (9): 1475-1477.doi: 10.3864/j.issn.0578-1752.2019.09.001
寇淑君1,霍阿红1,付国庆1,纪军建1,王瑶1,左振兴1,刘敏轩2( ),陆平2
),陆平2
收稿日期:2018-01-08
接受日期:2019-03-05
出版日期:2019-05-01
发布日期:2019-05-16
联系方式:
寇淑君,Tel:18503135993;E-mail:koushujun1986@163.com。
基金资助:
KOU ShuJun1,HUO AHong1,FU GuoQing1,JI JunJian1,WANG Yao1,ZUO ZhenXing1,LIU MinXuan2(),LU Ping2
Received:2018-01-08
Accepted:2019-03-05
Published:2019-05-01
Online:2019-05-16
摘要:
【目的】利用荧光SSR研究中国糜子的遗传多样性与群体遗传结构,为糜子品种改良、种质创新和资源利用提供依据。【方法】用不同地理来源且表型差异较大的6份糜子材料对SSR引物进行筛选,通过变性聚丙烯酰胺凝胶电泳获得条带清晰、稳定性好、多态性高的糜子SSR引物,对筛选出的引物5′末端进行6-FAM、HEX、ROX和TAMRA荧光标记,利用基因分析仪检测不同等位变异的扩增片段大小,并以此来分析131份糜子材料的遗传多样性和群体结构。【结果】从202对SSR引物中共筛选出22对扩增稳定、多态性好的SSR引物,能同时适用于传统变性PAGE胶电泳和荧光SSR标记-全自动分析检测技术。22对SSR引物共检测出128个主要等位变异,平均每个位点5.82个;基因多样性指数变化范围为0.3572—0.8132,平均0.6284;多态性信息含量为0.2934—0.8150,平均0.5874;Shannon多样性指数为0.5427—1.7681,平均1.2062。不同生态区糜子种质间遗传距离的变化范围为0.0764—0.7251,平均0.3121,遗传一致度的变化范围为0.4843—0.9265,平均0.7465。其中,北方春糜子区和黄土高原春夏糜子区的遗传距离最小,遗传一致度最高,亲缘关系较近。UPGMA聚类分析显示,北方春糜子区和黄土高原春夏糜子区的材料聚为一类,个体间聚类,东北春糜子区的育成品种和农家种聚类结果一致,黄土高原春夏糜子区的育成品种在多个组群中都有出现。通过绘制K与△K的关系图,K=4时,△K最大,据此将131份糜子材料划分为4个类群,类群Ⅰ代表北方春糜子区;类群Ⅱ主要来自东北春糜子区;类群Ⅲ主要是北方春糜子区,群组Ⅳ主要是黄土高原春夏糜子区。各群体中大部分品种亲缘关系单一,少数品种含有其他组群的遗传成分。基于遗传距离的聚类分析与群体遗传结构分析结果基本一致,表明糜子的遗传差异与地理来源相关。【结论】北方春糜子区和黄土高原春夏糜子区的遗传多样性比较丰富,东北春糜子区的育成品种主要以农家种为遗传背景选育而来,黄土高原春夏糜子区在育种过程中引种资源广泛,与其他生态区存在基因交流。
寇淑君, 霍阿红, 付国庆, 纪军建, 王瑶, 左振兴, 刘敏轩, 陆平. 利用荧光SSR分析中国糜子的遗传多样性和群体遗传结构[J]. 中国农业科学, 2019, 52(9): 1475-1477.
KOU ShuJun, HUO AHong, FU GuoQing, JI JunJian, WANG Yao, ZUO ZhenXing, LIU MinXuan, LU Ping. Genetic Diversity and Population Structure of Broomcorn Millet in China Based on Fluorescently Labeled SSR[J]. Scientia Agricultura Sinica, 2019, 52(9): 1475-1477.
表1
22对SSR标记的遗传参数"
| 位点 Locus | 等位基因数目 Allele number | 主要等位基因 Major allele | 稀有基因数 Rare gene number | 基因多样性指数 H | 多态性信息含量 PIC | Shannon信息指数 I | |
|---|---|---|---|---|---|---|---|
| 片段大小 Size (bp) | 频率 Frequency | ||||||
| BM552 | 7 | 240 | 0.4427 | 5 | 0.7403 | 0.7124 | 1.4924 |
| BM637 | 5 | 167 | 0.3382 | 1 | 0.7373 | 0.6897 | 1.3527 |
| BM787 | 5 | 290 | 0.6908 | 1 | 0.4874 | 0.4530 | 0.8807 |
| BM2654 | 7 | 206 | 0.3015 | 1 | 0.7835 | 0.7525 | 1.6300 |
| BM2715 | 6 | 227 | 0.3893 | 4 | 0.7324 | 0.6914 | 1.3745 |
| BM2717 | 7 | 284 | 0.5916 | 5 | 0.6109 | 0.5825 | 1.2828 |
| BM2729 | 4 | 122 | 0.6107 | 4 | 0.5593 | 0.5064 | 0.9212 |
| BM2766 | 5 | 194 | 0.6450 | 1 | 0.5285 | 0.4817 | 1.0270 |
| BM2792 | 5 | 132 | 0.4084 | 1 | 0.6626 | 0.5991 | 1.1651 |
| BM6414 | 7 | 270 | 0.4618 | 5 | 0.7149 | 0.6814 | 1.3771 |
| BM6573 | 2 | 118 | 0.7672 | 2 | 0.3572 | 0.2934 | 0.5427 |
| BM6598 | 6 | 210 | 0.6450 | 1 | 0.5364 | 0.4964 | 1.0300 |
| LMX503 | 5 | 226 | 0.6336 | 1 | 0.5489 | 0.5081 | 1.0867 |
| LMX780 | 5 | 229 | 0.5076 | 1 | 0.6278 | 0.5659 | 1.1080 |
| LMX836 | 8 | 224 | 0.4275 | 1 | 0.7562 | 0.7310 | 1.6617 |
| LMX1553 | 6 | 192 | 0.7061 | 4 | 0.4788 | 0.4560 | 0.8776 |
| LMX1959 | 5 | 266 | 0.4847 | 3 | 0.6584 | 0.6043 | 1.1549 |
| LMX2019 | 8 | 250 | 0.3321 | 2 | 0.8132 | 0.7918 | 1.7681 |
| LMX2068 | 8 | 289 | 0.7405 | 1 | 0.4411 | 0.4294 | 0.9994 |
| LMX2281 | 5 | 248 | 0.6718 | 0 | 0.5140 | 0.4818 | 0.9819 |
| LMX2382 | 8 | 195 | 0.2710 | 6 | 0.8350 | 0.8150 | 1.7779 |
| LMX2734 | 4 | 210 | 0.4733 | 1 | 0.6826 | 0.6351 | 1.2678 |
| 合计Total | 128 | 51 | |||||
| 平均Average | 5.8 | 0.5189 | 2.3 | 0.6284 | 0.5874 | 1.2062 | |

图1
45份糜子材料在BM2654标记位点上的带型表现 M:DNA分子量标准;61—105为电子附表1中品种的序号;纵向箭头所指为杂合位点带型;横向箭头指检测到的6个等位基因"
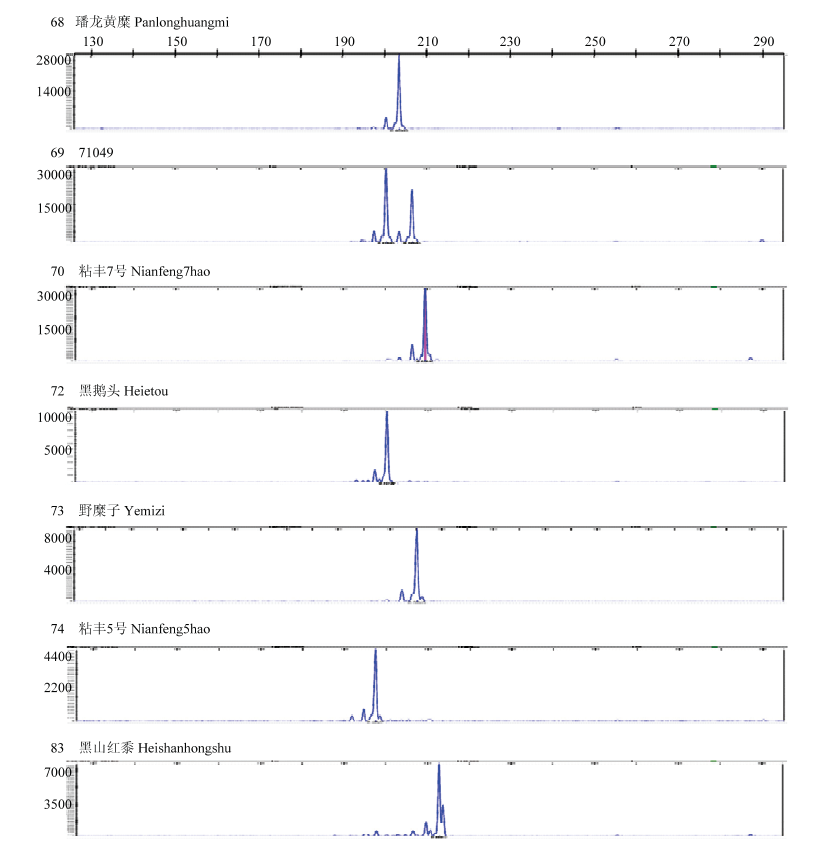
图2
7份糜子材料在荧光标记BM2654位点上的等位变异峰图 品种71049在该位点检测到了2个等位变异。纵坐标表示荧光信号强度;横坐标表示6个不同的扩增片段大小(bp)"
表2
不同生态区糜子的遗传多样性分析"
| 生态区 Ecotype | 类型 Type | 资源数 Accessions | 等位基因数 Allele number | 基因多样性指数 H | 多态性信息含量 PIC | Shannon信息指数 I |
|---|---|---|---|---|---|---|
| 东北春糜子区 NES | 育成品种 Cultivars | 20 | 3.8636 | 0.5474 | 0.4953 | 0.9848 |
| 农家种 Landraces | 11 | 3.3636 | 0.5373 | 0.4901 | 0.9225 | |
| 材料数 Number | 31 | 4.3182 | 0.5732 | 0.5291 | 1.0562 | |
| 华北夏糜子区 NSU | 育成品种 Cultivars | 0 | ||||
| 农家种 Landraces | 3 | 2.0455 | 0.3838 | 0.3197 | 0.4402 | |
| 材料数 Number | 3 | 2.0455 | 0.3838 | 0.3197 | 0.4402 | |
| 北方春糜子区 NSP | 育成品种 Cultivars | 32 | 4.4091 | 0.5521 | 0.5042 | 1.1074 |
| 农家种 Landraces | 26 | 4.5455 | 0.6221 | 0.5725 | 1.1114 | |
| 材料数 Number | 58 | 5.0455 | 0.6083 | 0.5607 | 1.1283 | |
| 黄土高原春夏糜子区 LPSS | 育成品种 Cultivars | 20 | 4.3636 | 0.5808 | 0.5337 | 1.0379 |
| 农家种 Landraces | 16 | 4.0000 | 0.5250 | 0.4993 | 0.9290 | |
| 材料数 Number | 36 | 5.1364 | 0.6020 | 0.5576 | 1.1222 | |
| 西北春夏糜子区 NWSS | 育成品种 Cultivars | 0 | ||||
| 农家种 Landraces | 3 | 2.1818 | 0.4621 | 0.3811 | 0.5001 | |
| 材料数 Number | 3 | 2.1818 | 0.4621 | 0.3811 | 0.5001 |
表3
不同生态区糜子资源的遗传距离和遗传一致度"
| 生态区 Ecotype | 东北春糜子区 NES | 北方春糜子区 NSP | 华北夏糜子区 NSU | 西北春夏糜子区 NWSS | 黄土高原春夏糜子区 LPSS |
|---|---|---|---|---|---|
| 东北春糜子区 NES | — | 0.8548 | 0.6408 | 0.7078 | 0.8814 |
| 北方春糜子区 NSP | 0.1569 | — | 0.5993 | 0.8552 | 0.9265 |
| 华北夏糜子区 NSU | 0.4451 | 0.5120 | — | 0.4843 | 0.6463 |
| 西北春夏糜子区 NWSS | 0.3456 | 0.1564 | 0.7251 | — | 0.8684 |
| 黄土高原春夏糜子区 LPSS | 0.1263 | 0.0764 | 0.4364 | 0.1411 | — |
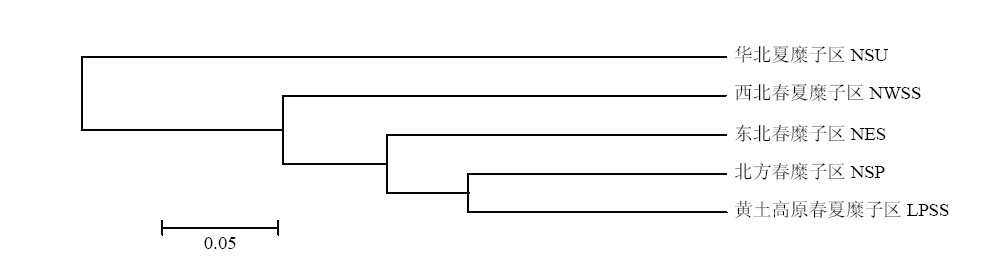
图3
基于遗传距离的不同生态区糜子资源聚类图 NES:东北春糜子区Northeast spring-sowing ecotype;NSU:华北夏糜子区Northern summer-sowing ecotype;NSP:北方春糜子区Northern spring-sowing ecotype;LPSS:黄土高原春夏糜子区Loess Plateau spring&summer-sowing ecotype;NWSS:西北春夏糜子区Northwest spring&summer-sowing ecotype"
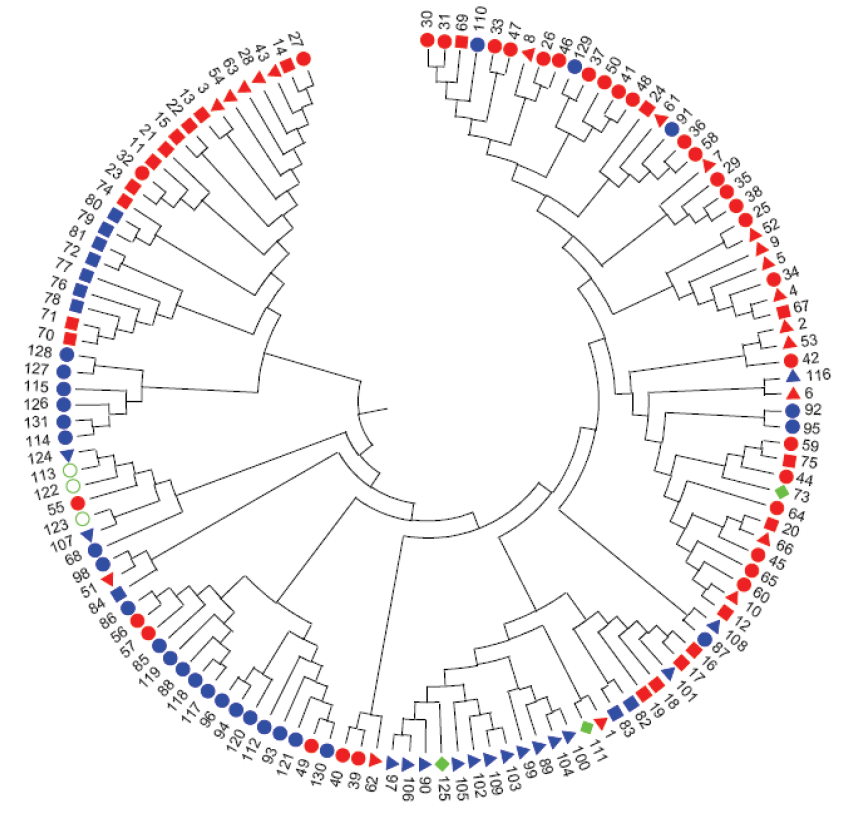
图4
基于荧光SSR分子标记分析的131份糜子材料聚类图 北方春糜子区育成品种 Cultivars of NSP; 北方春糜子区农家种 Landraces of NSP; 黄土高原春夏糜子区育成品种 Cultivars of LPSS; 黄土高原春夏糜子区农家种 Landraces of LPSS; 东北春糜子区育成品种 Cultivars of NES; 东北春糜子区农家种 Landraces of NES; 华北夏糜子区农家种 Landraces of NSU; 西北春夏糜子区农家种 Landraces of NWSS"
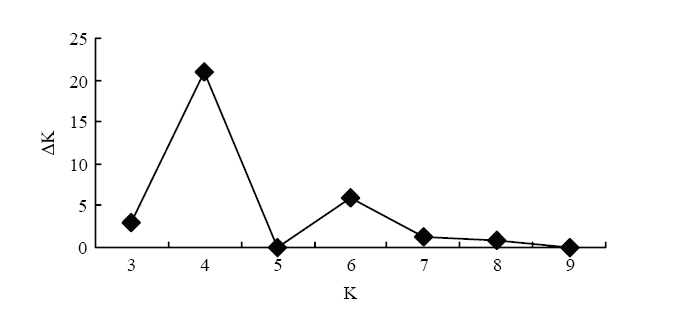
图5
131份糜子材料的K值与Δk值的关系"

图6
131份糜子材料的群体遗传结构分析"
表4
131份糜子材料在各组群中的分布(K=4)"
| 省份 Province | 红色 Red | 绿色 Green | 蓝色 Blue | 黄色 Yellow |
|---|---|---|---|---|
| 山西省Shanxi | 3 | 3 | 15 | 6 |
| 甘肃省Gansu | 8 | 2 | 2 | |
| 内蒙古自治区Inner Mongolia | 7 | 9 | 1 | |
| 青海省Qinghai | 7 | 1 | ||
| 宁夏回族自治区Ningxia | 6 | 1 | 4 | 4 |
| 黑龙江省Heilongjiang | 3 | 10 | 2 | 1 |
| 陕西省Shaanxi | 1 | 1 | 2 | 5 |
| 辽宁省 Liaoning | 1 | 2 | 1 | |
| 吉林省 Jilin | 3 | 1 | 6 | |
| 河北省 Hebei | 6 | 3 | ||
| 新疆维吾尔自治区 Xinjiang | 1 | 2 | ||
| 山东省 Shandong | 1 | |||
| 合计 Total | 35 | 21 | 43 | 32 |
表5
各群体Q值分布"
| 类群 Group | 各群体品种数量 Number of varieties in each group | 品种数量Number of varieties | |||
|---|---|---|---|---|---|
| Q<0.6 | Q≥0.6 | Q≥0.8 | Q≥0.9 | ||
| 1 | 35 | 1 | 34 | 26 | 21 |
| 2 | 21 | 3 | 18 | 15 | 14 |
| 3 | 43 | 12 | 31 | 18 | 14 |
| 4 | 32 | 7 | 25 | 18 | 15 |
| 合计 Total | 131 | 24 | 107 | 76 | 63 |
| [1] |
BARTON L, NEWSOME S D, CHEN F H, WANG H, GUILDERSON T P, BETTINGER R L . Agricultural origins and the isotopic identity of domestication in northern China. Proceedings of the National Academy of Sciences of the United States of America, 2009,106(14):5523-5528.
doi: 10.1073/pnas.0809960106 |
| [2] | HU X Y, WANG J F, LU P, ZHANG H S . Assessment of genetic diversity in broomcorn millet(Panicum miliaceum L.) using SSR markers. Journal of Genetics and Genomics, 2009,36(8):491-500. |
| [3] | 王瑞云 . 糜子遗传多样性及进化研究进展. 北京: 中国农业出版社, 2017. |
| WANG R Y. Research Advances on the Genetic Diversity and Evolution of Broomcorn Millet (Panicum miliaceum L.). Beijing: China Agriculture Press, 2017. (in Chinese) | |
| [4] |
黎裕, 王建康, 邱丽娟, 马有志, 李新海, 万建民 . 中国作物分子育种现状与发展前景. 作物学报, 2010,36(9):1425-1430.
doi: 10.3724/SP.J.1006.2010.01425 |
|
LI Y, WANG J K, QIU L J, MA Y Z, LI X H, WAN J M . Crop molecular breeding in China: Current status and perspectives. Acta Agronomica Sinica, 2010,36(9):1425-1430. (in Chinese)
doi: 10.3724/SP.J.1006.2010.01425 |
|
| [5] |
M'RIBU H K, HILU K W . Detection of interspecific and intraspecific variation in Panicum millets through random amplified polymorphic DNA. Theoretical and Applied Genetics, 1994,88(3):412-416.
doi: 10.1007/BF00223653 pmid: 24186027 |
| [6] | KARAM D, WESTRA P, NISSEN S J, WARD S M, FIGUEIREDO J E F . Genetic diversity among proso millet (Panicum miliaceum) biotypes assessed by AFLP technique. Planta Daninha, 2004,22(2):167-174. |
| [7] |
LÁGLER R, GYULAI G, HUMPHREYS M, SZABÓ Z, HORVÁTH L, BITTSÁNSZKY A, KISS J, HOLLY L, HESZKY L . Morphological and molecular analysis of common millet (P. miliaceum) cultivars compared to an aDNA sample from the 15th century (Hungary). Euphytica, 2005,146:77-85.
doi: 10.1007/s10681-005-5814-7 |
| [8] |
RAJPUT S G, PLYLER-HARVESON T, SANTRA D K . Development and characterization of SSR markers in Proso Millet based on switchgrass genomics. American Journal of Plant Sciences, 2014,5(1):175-186.
doi: 10.4236/ajps.2014.51023 |
| [9] |
刘秀云, 李慧, 刘志国, 赵锦, 刘孟军 . 基于SSR标记的255个枣品种亲缘关系和群体结构分析. 中国农业科学, 2016,49(14):2772-2791.
doi: 10.3864/j.issn.0578-1752.2016.14.011 |
|
LIU X Y, LI H, LIU Z G, ZHAO J, LIU M J . Genetic diversity and structure of 255 cultivars of Ziziphus jujuba Mill. Scientia Agricultura Sinica, 2016,49(14):2772-2791. (in Chinese)
doi: 10.3864/j.issn.0578-1752.2016.14.011 |
|
| [10] |
吴承来, 张倩倩, 董炳雪, 李圣福, 张春庆 . 我国部分玉米自交系遗传关系和群体结构解析. 作物学报, 2010,36(11):1820-1831.
doi: 10.3724/SP.J.1006.2010.01820 |
|
WU C L, ZHANG Q Q, DONG B X, LI S F, ZHANG C Q . Analysis of genetic structure and genetic relationships of partial maize inbred lines in China. Acta Agronomica Sinica, 2010,36(11):1820-1831. (in Chinese)
doi: 10.3724/SP.J.1006.2010.01820 |
|
| [11] |
高帆, 张宗文, 吴斌 . 中国苦荞SSR分子标记体系构建及其在遗传多样性分析中的应用. 中国农业科学, 2012,45(6):1042-1053.
doi: 10.3864/j.issn.0578-1752.2012.06.002 |
|
GAO F, ZHANG Z W, WU B . Construction and application of SSR molecular markers system for genetic diversity analysis of Chinese Tartary buckwheat germplasm resources. Scientia Agricultura Sinica, 2012,45(6):1042-1053. (in Chinese)
doi: 10.3864/j.issn.0578-1752.2012.06.002 |
|
| [12] |
刘岩, 程须珍, 王丽侠, 王素华, 白鹏, 吴传书 . 基于SSR标记的中国绿豆种质资源遗传多样性研究. 中国农业科学, 2013,46(20):4197-4209.
doi: 10.3864/j.issn.0578-1752.2013.20.003 |
|
LIU Y, CHENG X Z, WANG L X, WANG S H, BAI P, WU C S . Genetic diversity research of mungbean germplasm resources by SSR markers in China. Scientia Agricultura Sinica, 2013,46(20):4197-4209. (in Chinese)
doi: 10.3864/j.issn.0578-1752.2013.20.003 |
|
| [13] |
CHO Y I, CHUNG J W, LEE G A, MA K H, DIXIT A, GWAG J G, PARK Y J . Development and characterization of twenty-five new polymorphic microsatellite markers in proso millet(Panicum miliaceum L.). Genes﹠Genomics, 2010,32:267-273.
doi: 10.1007/s13258-010-0007-8 |
| [14] |
HUNT H V, CAMPANA M G, LAWES M C, PARK Y J, BOWER M A, HOWE C J, JONES M K . Genetic diversity and phylogeography of broomcorn millet (Panicum miliaceum L.) across Eurasia. Molecular Ecology, 2011,20(22):4756-4771.
doi: 10.1111/j.1365-294X.2011.05318.x pmid: 22004244 |
| [15] |
连帅, 陆平, 乔志军, 张琦, 张茜, 刘敏轩, 王瑞云 . 利用SSR分子标记研究国内外黍稷地方品种和野生资源的遗传多样性. 中国农业科学, 2016,49(17):3264-3275.
doi: 10.3864/j.issn.0578-1752.2016.17.002 |
|
LIAN S, LU P, QIAO Z J, ZHANG Q, ZHANG Q, LIU M X, WANG R Y . Genetic diversity in broomcorn millet (Panicum miliaceum L.) from China and abroad by using SSR markers. Scientia Agricultura Sinica, 2016,49(17):3264-3275. (in Chinese)
doi: 10.3864/j.issn.0578-1752.2016.17.002 |
|
| [16] |
LIU M X, XU Y, HE J L, ZHANG S, WANG Y Y, LU P . Genetic diversity and population structure of broomcorn millet (Panicum miliaceum L.) cultivars and landraces in China based on microsatellite markers. International Journal of Molecular Sciences, 2016,17:370-388.
doi: 10.3390/ijms17030370 pmid: 4813230 |
| [17] | 薛延桃, 陆平, 乔志军, 刘敏轩, 王瑞云 . 基于SSR标记的黍稷种质资源遗传多样性及亲缘关系研究. 中国农业科学, 2018,51(15):2846-2859. |
| XUE Y T, LU P, QIAO Z J, LIU M X, WANG R Y . Genetic diversity and genetic relationship of broomcorn millet (Panicum miliaceum L.) germplasm based on SSR markers. Scientia Agricultura Sinica, 2018,51(15):2846-2859. (in Chinese) | |
| [18] | 王银月, 刘敏轩, 陆平, 乔志军, 杨天育, 李海, 崔喜艳 . 构建黍稷分子遗传图谱SSR引物的筛选. 作物杂志, 2014(4):32-38. |
| WANG Y Y, LIU M X, LU P, QIAO Z J, YANG T Y, LI H, CUI X Y . The SSR primers screening of broomcorn millet(Panicum miliaceum L.) for construction of genetic map. Crop Journal, 2014(4):32-38. (in Chinese) | |
| [19] |
DAVIES H, DICKS E, STEPHENS P, COX C, TEAGUE J, GREENMAN C, BIGNELL G, MEARA S O, EDKINS S, PARKER A, STEVENS C, MENZIES A, BLOW M, BOTTOMLEY B, DRONSFIELD M, FUTREAL P A, STRATTON M R, WOOSTER R . High throughput DNA sequence variant detection by conformation sensitive capillary electrophoresis and automated peak comparison. Genomics, 2006,87(3):427-432.
doi: 10.1016/j.ygeno.2005.11.008 pmid: 16406726 |
| [20] | 雍洪军, 张世煌, 张德贵, 李明顺, 李新海, 郝转芳, 刘晓鑫, 白丽, 谢传晓 . 利用SSR荧光标记分析90个糯玉米地方品种的遗传多样性. 玉米科学, 2009,17(1):6-12. |
| YONG H J, ZHANG S H, ZHANG D G, LI M S, LI X H, HAO Z F, LIU X X, BAI L, XIE C X . Analysis of genetic diversity among 90 waxy corn landraces using fluorescent SSR markers. Maize Science, 2009,17(1):6-12. (in Chinese) | |
| [21] |
郑永胜, 张晗, 王东健, 孙加梅, 王雪梅, 段丽丽, 李华, 王玮, 李汝玉 . 基于荧光检测技术的小麦品种SSR鉴定体系的建立. 中国农业科学, 2014,47(19):3725-3735.
doi: 10.3864/j.issn.0578-1752.2014.19.001 |
|
ZHENG Y S, ZHANG H, WANG D J, SUN J M, WAGN X M, DUAN L L, LI H, WAGN W, LI R Y . Development of a wheat variety identification system based on fluorescently labeled SSR markers. Scientia Agricultura Sinica, 2014,47(19):3725-3735. (in Chinese)
doi: 10.3864/j.issn.0578-1752.2014.19.001 |
|
| [22] |
何其芳, 李荣华, 郭培国, 宁正详, 邱妙文, 赵伟才, 夏岩石, 白盼 . 利用SSR荧光标记技术分析烟草种质的遗传多样性. 中国农学通报, 2012,28(10):95-102.
doi: 10.3969/j.issn.1000-6850.2012.10.018 |
|
HE Q F, LI R H, GUO P G, NING Z X, QIU M W, ZHAO W C, XIA Y S, BAI P . Genetic diversity analysis for tobacco germplasm by using fluorescent SSR technique. Chinese Agricultural Science Bulletin, 2012,28(10):95-102. (in Chinese)
doi: 10.3969/j.issn.1000-6850.2012.10.018 |
|
| [23] |
许鲲, 李峰, 吴金峰, 谷铁城, 陈碧云, 高桂珍, 闫贵欣, 李俊, 乔江伟, 汪念, 伍晓明 . SSR荧光标记毛细管电泳法与国家冬油菜区试指纹鉴定平台的构建. 中国油料作物学报, 2014,36(2):150-159.
doi: 10.7505/j.issn.1007-9084.2014.02.003 |
|
XU K, LI F, WU J F, GU T C, CHEN B Y, GAO G G, YAN G X, LI J, QIAO J W, WAMG N, WU X M . Fingerprint identification platform of capillary electrophoresis detection with fluorescent SSR markers on national winter rapeseed varieties (lines) field trials. Chinese Journal of Oil Crop Sciences, 2014,36(2):150-159. (in Chinese)
doi: 10.7505/j.issn.1007-9084.2014.02.003 |
|
| [24] |
王瑞云, 季煦, 陆平, 刘敏轩, 许月, 王纶, 王海岗, 乔治军 . 利用荧光SSR分子中国糜子遗传多样性. 作物学报, 2017,43(4):530-548.
doi: 10.3724/SP.J.1006.2017.00530 |
|
WANG R Y, JI X, LU P, LIU M X, XU Y, WANG L, WANG H G, QIAO Z J . Analysis of genetic diversity in common millet(Panicum miliaceum) using fluorescent SSR in China. Acta Agronomica Sinica, 2017,43(4):530-548. (in Chinese)
doi: 10.3724/SP.J.1006.2017.00530 |
|
| [25] | 柴岩, 冯佰利, 王宏岩 . 中国黄米食品. 杨凌: 西北农林科技大学出版社, 2012. |
| CHAI Y, FENG B L, WAGN H Y. Food of Proso Millet in China. Yangling: Northwest A&F University Press, 2012. (in Chinese) | |
| [26] |
LIU K, MUSE S V . PowerMarker: Integrated analysis environment for genetic marker data. Bioinformatics, 2005,21:2128-2129.
doi: 10.1093/bioinformatics/bti282 |
| [27] | YEH F C, BOYLE T J . Population genetic analysis of co-dominant and dominant markers and quantitative traits. Belgian Journal of Botany, 1997,129:157. |
| [28] | TAMURA K, PETERSON D, PETERSON N, STECHER G, NEI M, KUMAR S . MEGA5: Molecular evolutionary genetics analysis using maximum likelihood, evolutionary distance and maximum parsimony methods. Molecular Biology and Evolution, 2011,665:2731-2739. |
| [29] |
FALUSH D, STEPHENS M, PRICTHARD J K . Inference of population structure using multilocus genotype data: Linked loci and correlated allele frequencies. Genetics, 2003,164:1567-1587.
doi: 10.3410/f.1015548.197423 pmid: 12930761 |
| [30] |
EVANNO G, REGNAUT S, GOUDET J . Detecting the number of cluster of individuals using the software structure: A simulation study. Molecular Ecology, 2005,14:2611-2620.
doi: 10.1111/mec.2005.14.issue-8 |
| [31] |
王瑞云, 刘笑瑜, 王海岗, 陆平, 刘敏轩, 陈凌, 乔治军 . 用高基元微卫星标记分析中国糜子遗传多样性. 中国农业科学, 2017,50(20):3848-3859.
doi: 10.3864/j.issn.0578-1752.2017.20.002 |
|
WANG R Y, LIU X Y, WANG H G, LU P, LIU M X, CHEN L, QIAO Z J . Evaluation of genetic diversity of common millet (Panicum miliaceum) germplasm available in China using high motif nucleotide repeat SSR markers. Scientia Agricultura Sinica, 2017,50(20):3848-3859. (in Chinese)
doi: 10.3864/j.issn.0578-1752.2017.20.002 |
|
| [32] |
董俊丽, 王海岗, 陈凌, 王君杰, 曹晓宁, 王纶, 乔治军 . 糜子骨干种质遗传多样性和遗传结构分析. 中国农业科学, 2015,48(16):3121-3131.
doi: 10.3864/j.issn.0578-1752.2015.16.003 |
|
DONG J L, WANG H G, CHEN L, WANG J J, CAO X N, WANG L, QIAO Z J . Analysis of genetic diversity and structure of Proso millet core germplasm. Scientia Agricultura Sinica, 2015,48(16):3121-3131. (in Chinese)
doi: 10.3864/j.issn.0578-1752.2015.16.003 |
| [1] | 何治霖, 孙翠霞, 岳红丽, 谈月霞, 张耀海, 王福生, 刘思涛, 江东. 基于重测序枸橼、柠檬类种质资源的遗传多样性分析和别罗勒烯的全基因组关联分析[J]. 中国农业科学, 2026, 59(2): 386-401. |
| [2] | 许玉娟, 张捷, 王天译, 陈浩洋, 赵佳佳, 武棒棒, 郝宇琼, 李晓华, 郑兴卫, 左静静, 郑军. 山西小麦低分子量麦谷蛋白Glu-A3和Glu-B3位点多样性鉴定及其对品质的影响[J]. 中国农业科学, 2025, 58(24): 5110-5127. |
| [3] | 陈彩锦, 马琳, 蒋庆雪, 刘金晖, 苗童, 张志鹏, 孟翔, 马晓冉, 周昕越, 张建, 刘文辉, 王学敏. 244份饲用燕麦种质资源表型性状遗传多样性分析[J]. 中国农业科学, 2025, 58(23): 4825-4836. |
| [4] | 魏益民, 周美亮, 唐宇. 荞麦的起源、进化与传播[J]. 中国农业科学, 2025, 58(21): 4305-4316. |
| [5] | 刘晓旭, 钟泽鑫, 邱佳仁, 杨春晓, 张永军, 谢文, 张友军, 潘慧鹏. 豆大蓟马不同地理种群线粒体CO1的遗传多样性[J]. 中国农业科学, 2025, 58(21): 4361-4371. |
| [6] | 唐桂梅, 李卫东, 周宇霞, 孔佑涵, 肖晓玲, 彭颖姝, 张力, 符红艳, 刘洋, 黄国林. 基于表型性状分析蕙兰种质资源遗传多样性[J]. 中国农业科学, 2025, 58(2): 339-354. |
| [7] | 郭孟泽, 张磊, 孙平平, 江彪, 闫晋强, 李正男. ToLCNDV广东冬瓜分离物的分子特征及其遗传演化规律[J]. 中国农业科学, 2025, 58(19): 3890-3904. |
| [8] | 刘鹏鹏, 李江博, 徐红军, 聂迎彬, 韩新年, 孔德真, 桑伟. 新疆冬小麦品种资源蛋白组分及品质的遗传多样性[J]. 中国农业科学, 2025, 58(15): 2948-2959. |
| [9] | 王晖, 丁保朋, 李彧贤, 任泉如, 周海, 赵均良, 胡海飞. 作物泛基因组研究进展与展望[J]. 中国农业科学, 2025, 58(11): 2045-2061. |
| [10] | 李沛, 何治霖, 谈月霞, 赵婉彤, 冯锦英, 陈贵虎, 严池, 王子豪, 黄平, 江东. 基于重测序数据与表型性状的宽皮柑橘遗传多样性分析与优异种质筛选[J]. 中国农业科学, 2024, 57(23): 4761-4773. |
| [11] | 杨春, 杨代星, 李燕, 梁思慧, 邓小强, 乔大河, 陈娟, 郭燕, 林开勤, 陈正武. 贵州大树茶形态学特征及生化成分综合分析[J]. 中国农业科学, 2024, 57(19): 3894-3916. |
| [12] | 李玉姗, 肖菁, 马越, 田超, 赵连佳, 王帆, 宋羽, 蒋程瑶. 169份番茄种质资源表型性状遗传多样性分析及综合评价[J]. 中国农业科学, 2024, 57(18): 3671-3683. |
| [13] | 翟彩娇, 葛礼姣, 程玉静, 仇亮, 王小秋, 刘水东. 基于表型性状与SSR标记的冬瓜、节瓜种质资源遗传多样性分析[J]. 中国农业科学, 2024, 57(17): 3440-3457. |
| [14] | 雷梦林, 刘霞, 王艳珍, 崔国庆, 穆志新, 刘龙龙, 李欣, 逯腊虎, 李晓丽, 张晓军. 基于55K SNP芯片的山西冬小麦种质资源遗传多样性分析[J]. 中国农业科学, 2024, 57(10): 1845-1856. |
| [15] | 王倩, 董孔军, 薛亚鹏, 刘少雄, 王若楠, 杨佳琪, 陆平, 王瑞云, 杨天育, 刘敏轩. 糜子核心种质成株期抗旱性鉴定评价与抗旱种质筛选[J]. 中国农业科学, 2023, 56(21): 4163-4174. |
|
||