


中国农业科学 ›› 2019, Vol. 52 ›› Issue (8): 1400-1412.doi: 10.3864/j.issn.0578-1752.2019.08.010
周海燕,徐明岗( ),蔡泽江,文石林,吴红慧
收稿日期:2018-09-29
接受日期:2018-11-27
出版日期:2019-04-16
发布日期:2019-04-26
联系方式:
周海燕,E-mail:zhouhaiyan321@cau.edu.cn。
基金资助:
ZHOU HaiYan,XU MingGang(),CAI ZeJiang,WEN ShiLin,WU HongHui
Received:2018-09-29
Accepted:2018-11-27
Published:2019-04-16
Online:2019-04-26
摘要:
【目的】以湖南省祁阳县为例,定量化分析整个县域不同土地利用方式下土壤的致酸因素,为我国的红壤酸化防治提供理论依据。【方法】通过搜集大量公开发表的文献、统计年鉴等,获取施肥量、主要农作物产量和林木生物量,以及地上部不同部位的养分含量等数据,基于经典的H +产生量的计算方法,解析氮循环过程、盐基离子吸收和酸沉降等三个关键过程的相对贡献大小。 【结果】对于整个祁阳县域,氮循环(N)过程致酸贡献率为66.5%(65.3%—68.8%),盐基(BC)吸收为33.0%(30.1%—34.4%),酸沉降则仅为0.5%(0.3%—1.7%)。无论是农田还是林地,氮循环过程都是产生H +的主要来源,是土壤酸化的主要驱动因素。3种土地利用方式中,单位面积旱地农田的H +净产量(产酸量)最高,达到19.0 kmol·hm -2·a -1,其次为水田(16.5 kmol·hm -2·a -1),林地的产酸量(3.2 kmol·hm -2·a -1)最低,旱地农田产酸量约为林地产酸量的6倍。6种主要农作物体系产酸量存在很大差异,从10.1 kmol·hm -2·a -1 到 30.0 kmol·hm -2·a -1不等,产酸量从大到小依次为:大豆>油菜>花生>水稻>玉米>甘薯,油料作物(油菜、花生、大豆)产酸量普遍大于粮食作物(水稻、玉米、甘薯)的产酸量;6种不同农作物的氮循环过程和盐基吸收的致酸贡献差异较大,氮循环过程致酸贡献率范围为45.3%— 78.3%,盐基吸过程为21.4%—54.2%。7种主要林地体系产酸量也存在很大差异,从2.0 kmol·hm -2·a -1到27.8 kmol·hm -2·a -1不等,柑橘>板栗>油茶林>马尾松>杉木>竹>湿地松,经济林(柑橘、板栗、油茶林)产酸量普遍大于用材林(马尾松、杉木、竹、湿地松)的产酸量;7种林木体系的氮循环过程和盐基吸收的致酸贡献率差异较大,氮循环过程致酸贡献率范围为46.1%—80.8%,盐基吸过程为19.0%—53.3%。采用“长期定位试验+土壤缓冲曲线”相结合的方法验证了本研究采用的H +产生量的计算方法,土壤pH的模拟值和实测值呈极显著正相关,均方根误差(RMSE)为0.15,两者之间吻合度较高。 【结论】氮循环过程是祁阳县域土壤酸化的主控因素。土壤酸化过程总产酸量差异和致酸因素贡献的大小主要取决于土地利用方式、农作物种类和林地类型。
周海燕,徐明岗,蔡泽江,文石林,吴红慧. 湖南祁阳县土壤酸化主要驱动因素贡献解析[J]. 中国农业科学, 2019, 52(8): 1400-1412.
ZHOU HaiYan,XU MingGang,CAI ZeJiang,WEN ShiLin,WU HongHui. Quantitative Analysis of Driving-Factors of Soil Acidification in Qiyang County, Hunan Province[J]. Scientia Agricultura Sinica, 2019, 52(8): 1400-1412.
表1
主要农作物和柑橘的年度养分输入量"
| 输入形式 Input | 作物类型 Crop | N (kg·hm-2·a-1) | P2O5 (kg·hm-2·a-1) | K2O (kg·hm-2·a-1) | Ca (kg·hm-2·a-1) | Mg (kg·hm-2·a-1) |
|---|---|---|---|---|---|---|
| 化肥带入 Chemical fertilizer input | 水稻 Rice | 180 | 59 | 78 | 1.4 | - |
| 玉米Corn | 216 | 65 | 42 | 1.6 | - | |
| 花生Peanut | 120 | 52 | 70 | 1.2 | - | |
| 油菜Rape | 160 | 51 | 74 | 1.2 | - | |
| 甘薯Sweet potato | 102 | 45 | 51 | 1.1 | - | |
| 大豆Soybean | 165 | 41 | 41 | 1.0 | - | |
| 柑橘Citrus | 239 | 83 | 93 | 2.0 | - | |
| 大气沉降 Atmospheric deposition | 47.6 | - | 2.8 | 15 | 2.4 |
表2
祁阳县主要农作物籽粒秸秆的养分含量[21,22,23,24,25]"
| 作物 Crop | 面积 Area (hm2) | 籽粒产量 Grain yield (kg·hm-2) | 秸秆产量 Straw yield (kg·hm-2) | P(%) | K(%) | Ca(%) | Mg(%) | ||||
|---|---|---|---|---|---|---|---|---|---|---|---|
| 籽粒 Grain | 秸秆 Straw | 籽粒 Grain | 秸秆 Straw | 籽粒 Grain | 秸秆 Straw | 籽粒 Grain | 秸秆 Straw | ||||
| 水稻 Rice | 71133 | 6660 | 5997 | 0.35 | 0.176 | 0.19 | 1.99 | 0.03 | 0.54 | 0.12 | 0.212 |
| 玉米Corn | 3224 | 3420 | 4104 | 0.26 | 0.152 | 0.34 | 1.18 | 0.013 | 0.54 | 0.120 | 0.224 |
| 花生Peanut | 2863 | 2610 | 2093 | 0.5 | 0.163 | 0.85 | 1.09 | 0.074 | 1.76 | 0.255 | 0.56 |
| 油菜Rape | 6144 | 1470 | 2195 | 1.47 | 0.144 | 7.77 | 1.94 | - | 1.52 | 0.94 | 0.25 |
| 甘薯Sweet potato | 6023 | 4320 | 2159 | 0.17 | 0.283 | 0.73 | 3.05 | 0.14 | 2.11 | 0.073 | 0.46 |
| 大豆Soybean | 4401 | 3045 | 4880 | 0.85 | 0.196 | 2.17 | 1.17 | 0.26 | 1.71 | 0.24 | 0.48 |
表3
祁阳典型种植体系氮的输入-输出通量"
| 作物类型 Cropping systems | 施氮量 N rate (kg·hm-2·a-1) | 氮沉降 N deposition (kg·hm-2·a-1) | 秸秆吸氮量 Straw N uptake (%) | 籽粒吸氮量 Grain N uptake (%) | NH3挥发 NH3 volatilization (%) | NO3-N淋洗量 NO3-N leaching (%) |
|---|---|---|---|---|---|---|
| 水稻 Rice | 180 | 47.6 | 1.20 | 1.21 | 17.3 | 2.9 |
| 玉米Corn | 216 | 47.6 | 0.92 | 1.15 | 24.5 | 20.2 |
| 花生Peanut | 120 | 47.6 | 1.82 | 4.57 | 24.8 | 12.9 |
| 油菜Rape | 160 | 47.6 | 0.87 | 8.67 | 24.6 | 15.1 |
| 甘薯Sweet potato | 102 | 47.6 | 2.37 | 0.33 | 25.3 | 11.4 |
| 大豆Soybean | 165* | 47.6 | 1.81 | 7.82 | 25.0 | 11.7 |
| 柑橘Citrus | 239 | 47.6 | - | - | 24.6 | 17.7 |
表4
祁阳县主要用材林木生物量及枝干皮养分含量[34,35,36]"
| 林木类型 Tree species | 面积 Area (hm2) | 生物量 Biomass (kg·hm-2) | 树干养分含量 Element content in stem wood (%) | 树枝养分含量 Element content in branch wood (%) | 树皮养分含量 Element content in bark wood (%) | ||||||||||||||
|---|---|---|---|---|---|---|---|---|---|---|---|---|---|---|---|---|---|---|---|
| 树干Stem | 树枝 Branch | 树皮Bark | N | P | K | Ca | Mg | N | P | K | Ca | Mg | N | P | K | Ca | Mg | ||
| 湿地松 Slash pine | 21080 | 34059 | 9874 | 7095 | 0.194 | 0.008 | 0.105 | 0.214 | 0.019 | 0.485 | 0.036 | 0.256 | 0.867 | 0.07 | 0.266 | 0.018 | 0.086 | 0.309 | 0.031 |
| 杉木 Fir | 20876 | 62406 | 9664 | 8386 | 0.075 | 0.007 | 0.031 | 0.067 | 0.015 | 0.443 | 0.032 | 0.289 | 0.543 | 0.207 | 0.283 | 0.024 | 0.231 | 0.432 | 0.045 |
| 马尾松Pine | 7905 | 67400 | 12100 | 5910 | 0.17 | 0.014 | 0.121 | 0.235 | 0.05 | 0.381 | 0.026 | 0.143 | 0.164 | 0.099 | 0.477 | 0.042 | 0.353 | 0.856 | 0.144 |
| 竹 Bamboo | 7108 | 42685 | 3488 | - | 0.247 | 0.016 | 0.225 | 0.013 | 0.029 | 0.386 | 0.017 | 0.108 | 0.015 | 0.02 | - | - | - | - | - |
表5
祁阳县主要经济林生物量及枝干和果实养分含量[34,35,36,37]"
| 林木类型 Tree species | 面积 Area (hm2) | 生物量 Biomass (kg·hm-2) | 枝干养分含量 Element content in stem wood (%) | 果实养分含量 Element content in fruits (%) | |||||||||
|---|---|---|---|---|---|---|---|---|---|---|---|---|---|
| 枝干 Stems and branches | 果实 Fruits | N | P | K | Ca | Mg | N | P | K | Ca | Mg | ||
| 板栗Chestnut | 137 | 13725 | 3750 | 0.978 | 0.186 | 0.253 | 1.400 | 0.210 | 1.376 | 0.27 | 0.664 | 2.048 | 0.222 |
| 油茶林Camellia oleifera | 28513 | 7681 | 1798 | 0.65 | 0.045 | 0.31 | 0.129 | 0.131 | 0.831 | 0.093 | 0.971 | 0.437 | 0.129 |
| 柑橘Citrus | 2068 | 26190 | 40397 | 0.513 | 0.070 | 0.420 | 1.193 | 0.247 | 0.158 | 0.052 | 0.236 | 0.062 | 0.016 |
表6
小麦-玉米长期试验籽粒秸秆产量及养分含量"
| 作物类型 Crop types | 平均产量Average yield (kg·hm-2·a-1) | 养分含量 Element content (%) | |||||||||
|---|---|---|---|---|---|---|---|---|---|---|---|
| 1990-1995 | 1996-2000 | 2001-2005 | 2006-2010 | 2011-2012 | P | K | Ca | Mg | |||
| 小麦 Wheat | 籽粒Grain | 1788 | 905 | 928 | 374 | 316 | 0.364 | 0.48 | 0.047 | 0.15 | |
| 秸秆 Straw | 1967 | 995 | 1020 | 411 | 347 | 0.80 | 1.05 | 0.52 | 0.17 | ||
| 玉米 Corn | 籽粒 Grain | 3369 | 3237 | 1858 | 1326 | 1188 | 0.26 | 0.39 | 0.007 | 0.12 | |
| 秸秆 Straw | 3032 | 2913 | 1672 | 1194 | 1088 | 0.15 | 1.18 | 0.54 | 0.22 | ||
表7
不同土地利用类型的关键致酸过程的H+产生量"
| 利用类型 Land use pattern | 氮循环 N cycling process | 盐基吸收 BC uptake | 酸雨 Acid deposition | 总H+产量 Total H+ production (kmol·hm-2·a-1) | 磷吸收 P uptake (kmol·hm-2·a-1) | H+净产量 H+ net production (kmol·hm-2·a-1) | |||
|---|---|---|---|---|---|---|---|---|---|
| H+产量 H+ production (kmol·hm-2·a-1) | 贡献率 Contribution (%) | H+产量 H+ production (kmol·hm-2·a-1) | 贡献率 Contribution (%) | H+产量 H+ production (kmol·hm-2·a-1) | 贡献率 Contribution (%) | ||||
| 林地 Forest soil | 2.2 | 68.2 | 1.0 | 30.1 | 0.056 | 1.7 | 3.2 | -0.05 | 3.2 |
| 水田Paddy | 11.5 | 65.3 | 6.1 | 34.4 | 0.056 | 0.3 | 17.6 | -1.1 | 16.5 |
| 旱地Upland | 13.6 | 68.8 | 6.1 | 30.9 | 0.056 | 0.3 | 19.7 | -0.7 | 19.0 |
| 全县* Whole county | 7.3 | 66.5 | 3.6 | 33.0 | 0.056 | 0.5 | 10.9 | -0.5 | 10.4 |
表8
不同农作物体系的关键致酸过程的H+产生量"
| 作物类型 Crop system | 氮循环过程 N cycling process | 盐基吸收 BC uptake (kmol·hm-2·a-1) | 盐基吸收贡献率 BC uptake contribution (%) | 磷吸收 P uptake process (kmol·hm-2·a-1) | H+净产量 H+ net production (kmol·hm-2·a-1) | |||
|---|---|---|---|---|---|---|---|---|
| H+产量 H+ production (kmol·hm-2·a-1) | 贡献率 Contribution (%) | K | Ca | Mg | ||||
| 甘薯 Sweet potato | 4.8 | 45.3 | 2.49 | 2.57 | 0.65 | 54.2 | -0.439 | 10.1 |
| 玉米 Corn | 12.2 | 78.3 | 1.54 | 1.13 | 0.66 | 21.4 | -0.488 | 15.1 |
| 水稻 Rice | 11.5 | 65.3 | 3.35 | 1.67 | 1.04 | 34.4 | -1.096 | 16.5 |
| 花生 Peanut | 14.6 | 78.3 | 1.15 | 1.93 | 0.92 | 21.4 | -0.532 | 18.1 |
| 油菜 Rape | 16.5 | 71.2 | 4.00 | 1.66 | 0.96 | 28.6 | -0.795 | 22.4 |
| 大豆 Soybean | 21.8 | 70.1 | 3.15 | 4.56 | 1.53 | 29.7 | -1.147 | 30.0 |
表9
不同林地的关键致酸过程的H+产生量"
| 林地类型 Forest system | 氮循环过程 N cycling process | 盐基吸收 BC uptake (kmol·hm-2·a-1) | 盐基吸收贡献率 BC uptake contribution (%) | 磷吸收 P uptake process (kmol·hm-2·a-1) | H+净产量 H+ net production (kmol·hm-2·a-1) | |||
|---|---|---|---|---|---|---|---|---|
| H+产量 H+ production (kmol·hm-2·a-1) | 贡献率 Contribution (%) | K | Ca | Mg | ||||
| 湿地松 Slash pine | 1.3 | 66.8 | 0.09 | 0.45 | 0.06 | 30.4 | -0.012 | 2.0 |
| 竹 Bamboo | 1.6 | 77.0 | 0.17 | 0.17 | 0.09 | 20.3 | -0.024 | 2.1 |
| 杉木 Fir | 1.4 | 62.8 | 0.11 | 0.50 | 0.18 | 34.7 | -0.019 | 2.3 |
| 马尾松 Pine | 1.9 | 69.3 | 0.15 | 0.33 | 0.32 | 28.7 | -0.033 | 2.8 |
| 油茶林 Camellia oleifera | 2.1 | 63.9 | 0.48 | 0.42 | 0.23 | 34.4 | -0.060 | 3.2 |
| 板栗 Chestnut | 5.0 | 46.1 | 0.68 | 4.31 | 0.80 | 53.3 | -0.368 | 10.5 |
| 柑橘 Citrus | 23.0 | 80.8 | 2.58 | 2.03 | 0.80 | 19.0 | -0.702 | 27.8 |
表10
祁阳小麦-玉米长期试验田的土壤缓冲性能及年度理论氢离子产生量"
| 年份 Year | y = a - bx | H+净产量 H+ net production (kmol·hm-2·a-1) | ||
|---|---|---|---|---|
| a | b | R2 | ||
| 1991 | 5.70 | 0.0602 | 0.9698 | 5.02 |
| 1992 | 5.60 | 0.0631 | 0.9639 | 5.02 |
| 1993 | 5.40 | 0.0610 | 0.9855 | 5.02 |
| 1994 | 5.26 | 0.0650 | 0.9566 | 5.02 |
| 1995 | 5.30 | 0.0593 | 0.9551 | 5.02 |
| 1996 | 5.20 | 0.0701 | 0.9270 | 4.51 |
| 1997 | 4.60 | 0.0601 | 0.9359 | 4.51 |
| 1998 | 4.60 | 0.0603 | 0.9728 | 4.51 |
| 1999 | 4.30 | 0.0489 | 0.9639 | 4.51 |
| 2000 | 4.20 | 0.0400 | 0.9229 | 4.51 |
| 2001 | 4.30 | 0.0393 | 0.9566 | 3.76 |
| 2002 | 4.32 | 0.0593 | 0.9889 | 3.76 |
| 2003 | 4.31 | 0.0434 | 0.9387 | 3.76 |
| 2004 | 4.60 | 0.0439 | 0.9855 | 3.76 |
| 2005 | 4.46 | 0.0383 | 0.9591 | 3.76 |
| 2006 | 4.48 | 0.0292 | 0.9852 | 3.20 |
| 2007 | 4.33 | 0.0489 | 0.9607 | 3.20 |
| 2008 | 4.53 | 0.0373 | 0.9229 | 3.20 |
| 2009 | 4.50 | 0.0383 | 0.9579 | 3.20 |
| 2010 | 4.30 | 0.0312 | 09851 | 3.20 |
| 2011 | 4.38 | 0.0292 | 0.9889 | 3.11 |
| 2012 | 4.30 | 0.0219 | 0.9589 | 3.11 |
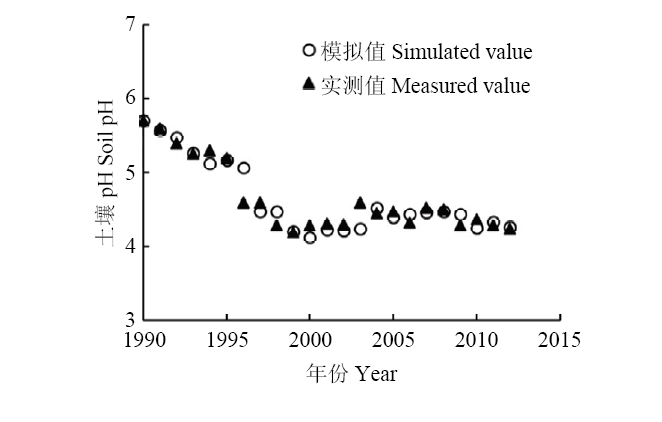
图1
不同年份的土壤pH实测值及模拟值的变化"
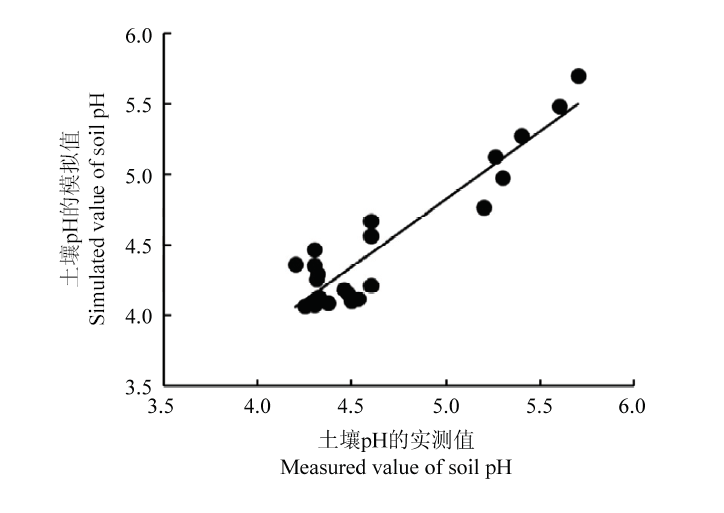
图2
土壤pH的实测值与模拟值的对比"
| [1] | 徐仁扣, 李九玉, 周世伟, 徐明岗, 沈仁芳 . 我国农田土壤酸化调控的科学问题与技术措施. 中国科学院院刊, 2018,33(2):160-167. |
| XU R K, LI J Y, ZHOU S W, XU M G, SHEN R F . Scientific issues and controlling strategies of soil acidification of croplands in China. Bulletin of Chinese Academy of Sciences, 2018,33(2):160-167. (in Chinese) | |
| [2] |
GUO J H, LIU X J, ZHANG Y, SHEN J L, HAN W X, ZHANG W F, CHRISTIE P, GOULDING K W T, VITOUSEK P M, ZHANG F S . Significant acidification in major Chinese croplands. Science, 2010,327(5968):1008-1010.
doi: 10.1126/science.1182570 |
| [3] | 2016年全国耕地质量监测报告. . (2017 -09-01[ 2018-06-22]. |
| [4] | 曾沐梵 . 长期施肥导致农田土壤酸化的机制及缓解策略[D]. 北京: 中国农业大学, 2017. |
| ZENG M F . Mechanisms of cropland soil acidification induced by the long-term fertilization and mitigation strategy[D]. Beijing: China Agricultural University, 2017. ( in Chinese) | |
| [5] | DE VRIES W, BREEUWSMA A . Relative importance of natural and anthropogenic proton sources in soils in the Netherlands. Water, Air, & Soil Pollution, 1986,28(1/2):173-184. |
| [6] | VAN BREEMEN N, DRISCOLL C, MULDER J . Acidic deposition and internal proton sources in acidification of soils and waters. Nature, 1984,307(5952):599-604. |
| [7] | RENGEL Z . Handbook of Soil Acidity. New York:Marcel Dekker Inc. 2003. |
| [8] | 解淑艳, 王瑞斌, 郑皓皓 . 2005-2011年全国酸雨状况分析. 环境监测与预警, 2012,4(5):33-37. |
| XIE S Y, WANG R B, ZHENG H H . Analysis on the acid rain from 2005 to 2011 in China. Environmental Monitoring and Forewarning, 2012,4(5):33-37. (in Chinese) | |
| [9] | ZENG M F, De Vries W, BONTEN L T C, ZHU Q C, HAO T X, LIU X J, XU M G, SHI X J, ZHANG F S, SHEN J B . Model-based analysis of the long-term effects of fertilization management on cropland soil acidification. Environmental Science & Technology, 2017,51(7):3843-3851. |
| [10] |
ZHU Q C, DE VRIES W, LIU X J, ZENG M F, HAO T X, DU E Z, ZHANG F S, SHEN J B . The contribution of atmospheric deposition and forest harvesting to forest soil acidification in China since 1980. Atmospheric Environment, 2016,146:215-222.
doi: 10.1016/j.atmosenv.2016.04.023 |
| [11] | 叶雪梅, 郝吉明, 段雷, 周中平 . 中国地表水酸化敏感性的区划. 环境科学, 2002,23(1):16-21 |
| YE X M, HAO J M, DUAN L, ZHOU Z P . Mapping sensitivity of surface waters to acidification in China. Environmental Science, 2002,23(1):16-21. (in Chinese) | |
| [12] | 徐明岗, 张文菊, 黄绍敏 . 中国土壤肥力演变. 2版. 北京: 中国农业科学技术出版社, 2015 |
| XU M G, ZHANG W J, HUANG S M. Soil Fertility Evolution in China. 2nd ed. Beijing: China Agricultural Science and Technology Press, 2015. ( in Chinese) | |
| [13] | 姬钢 . 不同土地利用方式下红壤酸化特征及趋势[D]. 北京: 中国农业科学院, 2015. |
| JI G . Acidification characteristics and trend of red soil under different land uses[D]. Beijing: Chinese Academy of Agricultural Sciences, 2015. ( in Chinese) | |
| [14] | 周晓阳, 周世伟, 徐明岗, Colinet Gilles . 中国南方水稻土酸化演变特征及影响因素. 中国农业科学, 2015,48(23):4811-4817. |
| ZHOU X Y, ZHOU S W, XU M G, COLINET G . Evolution characteristics and influence factors of acidification in paddy soil of southern China. Scientia Agricultura Sinica, 2015, 48(23):4811-4817. (in Chinese) | |
| [15] | 祁阳政府网: 祁阳县地理概况. . (2013-10-21[ 2017-09-10]. |
| [16] | 祁阳县国民经济与社会发展统计公报. [ 2017-09-18]. |
| [17] | 张卫峰, 易俊杰, 张福锁 . 中国肥料发展研究报告(2016). 北京: 中国农业大学出版社, 2017. |
| ZHANG W F, YI J J, ZHANG F S. The Research Report of Fertilizer Development in China(2016). Beijing: China Agricultural University Press, 2017. ( in Chinese) | |
| [18] | 汪家铭 . 国内钾肥供需现状与市场展望. 化工管理, 2009(9):17-23. |
| WANG J M . Current situation and market prospect of potash fertilizer in China. Chemical Management, 2009(9):17-23. (in Chinese) | |
| [19] |
CUI Z L, YUE S C, WANG G L, MENG Q F, WU L, YANG Z P, ZHANG Q, LI S Q, ZHANG F S, CHEN X P . Closing the yield gap could reduce projected greenhouse gas emissions: a case study of maize production in China. Global Change Biology, 2013,19(8):2467-2477.
doi: 10.1111/gcb.12213 |
| [20] | CUI Z L, WANG G L, YUE S C, WU L, ZHANG F S, CHEN X P . Closing the N use efficiency gap to achieve food and environmental security. Environmental Science & Technology, 2014,48:5780-5787. |
| [21] | 全国农业技术推广中心. 中国有机肥料养分志. 北京: 中国农业出版社, 1999. |
| National Agro-tech Extension and Service Center. Organic Fertilizer Resources in China. Beijing: China Agricultural Press, 1999. ( in Chinese) | |
| [22] | 李小坤 . 水稻营养特性及科学施肥. 北京: 中国农业出版社, 2016. |
| LI X K. Rice nutrition Characterization and Scientific Fertilization. Beijing: China Agricultural Press, 2016. ( in Chinese) | |
| [23] | 鲁如坤 . 土壤-植物营养学原理与施肥. 北京: 化学工业出版社, 1998. |
| LU R K. Principle of Soil-plant Nutrition and Fertilization. Beijing: Chemical Industry Press, 1998. ( in Chinese) | |
| [24] | 段文学, 张海燕, 解备涛, 汪宝卿, 张立明 . 甘薯氮素营养研究进展. 西北农业学报, 2015,24(12):14-23. |
| DUAN W X, ZHANG H Y, XIE B T, WANG B Q, ZHANG L M . Research advances of nitrogen nutrition in sweet potato. Acta Agriculture Boreali - occidentalis Sinica, 2015,24(12):14-23. (in Chinese) | |
| [25] | 薛艳芳, 张慧, 刘开昌, 夏海勇, 高英波, 王庆成, 温立玉, 孔玮琳, 张虎虎, 付希强, 齐世军, 李宗新 . 黄淮海区主推玉米品种籽粒主要矿物质元素含量分析. 玉米科学, 2017,25(5):56-62. |
| XUE Y F, ZHANG H, LIU K C, XIA H Y, GAO Y B, WANG Q C, WEN L Y, KONG W L, ZHANG H H, FU X Q, QI S J, LI Z X . Analysis of major elements in grain of the popularized maize varieties in Huanghuaihai plain. Journal of Maize Sciences, 2017,25(5):56-62. (in Chinese) | |
| [26] |
SMIL V . Nitrogen in crop production: an account of global flows. Global Biogeochemical Cycles, 1999,13(2):647-662.
doi: 10.1029/1999GB900015 |
| [27] |
李书田, 金继运 . 中国不同区域农田养分输入,输出与平衡. 中国农业科学, 2011,44(20):4207-4229.
doi: 10.3864/j.issn.0578-1752.2011.20.009 |
|
LI S T, JIN J Y . Characteristics of nutrient input/output and nutrient balance in different regions of China. Scientia Agricultura Sinica, 2011,44(20):4207-4229. (in Chinese)
doi: 10.3864/j.issn.0578-1752.2011.20.009 |
|
| [28] | 朱齐超 . 区域尺度中国土壤酸化定量研究及模型分析[D]. 北京: 中国农业大学, 2017. |
| ZHU Q C . Quantification and modeling on soil acidification at regional scale of China[D]. Beijing: China Agricultural University, 2017. ( in Chinese) | |
| [29] | DE VRIES W, BREEUWSMA A . The relation between soil acidification and element cycling. Water, Air, & Soil Pollution, 1987,35(3/4):293-310. |
| [30] | 周才平, 欧阳华, 裴志永, 徐兴良 . 中国森林生态系统的土壤净氮矿化研究. 植物生态学报, 2003,27(2):170-176. |
| ZHOU C P, OU Y H, PEI Z Y, XU X L . Net soil nitrogen mineralization in Chinese forest ecosystems. Acta Phytoecologica Sinica, 2003,27(2):170-176. (in Chinese) | |
| [31] | 巨晓棠, 刘学军, 张福锁 . 冬小麦/夏玉米轮作体系中土壤氮素矿化及预测. 应用生态学报, 2003,14(12):2241-2245. |
| JU X T, LIU X J, ZHANG F S . Soil nitrogen mineralization and its prediction in winter wheat-summer maize rotation system. Chinese Journal of Applied Ecology, 2003,14(12):2241-2245. (in Chinese) | |
| [32] | 湖南省环境质量状况公报(2002-2016) [R/OL]. ( 2017- 04- 05)[2017- 09-11]. . |
| [33] | 2016年中国环境状况公报[R/OL]. ( 2017- 05- 31) [2018-11-19]. . |
| [34] | 陈灵芝, 黄建辉, 严昌荣 . 中国森林生态系统养分循环. 北京: 气象出版社, 1997. |
| CHEN L Z, HUANG J H, YAN C R. Element cycle of Forest Ecosystem in China. Beijing: China Meteorological Press, 1997. ( in Chinese) | |
| [35] | 罗云建, 王效科, 张小全, 逯非 . 中国森林生态系统生物量及其分配研究. 北京: 中国林业出版社, 2013. |
| LUO Y J, WANG X K, ZHANG X Q, LU F. Research of Community Biomass and Distribution of Forest Ecosystem in China. Beijing: China Forestry Publishing House, 2013. ( in Chinese) | |
| [36] | 冯宗炜 . 中国森林生态系统的生物量和生产力 . 北京: 科学出版社, 1999. |
| FENG Z W. Community Biomass and Productivity of Forest Cosystems in China. Beijing: Science Press, 1999. ( in Chinese) | |
| [37] | 何方, 姚小华 . 中国油茶栽培. 北京: 中国林业出版社, 2013. |
| HE F, YAO X H. Cultivation of Amellia Oleifera C.Abel in China. Beijing: China Forestry Publishing House, 2013. ( in Chinese) | |
| [38] | 成杰民, 胡光鲁, 潘根兴 . 用酸碱滴定曲线拟合参数表征土壤对酸缓冲能力的新方法. 农业环境科学学报, 2004,23(3):569-573. |
| CHENG J M, HU G L, PAN G X . New method for evaluating buffering capacity and equilibrium pH of paddy soil with simulation parameter. Journal of Agro-Environment Science, 2004,23(3):569-573. (in Chinese) | |
| [39] | 蔡泽江 . 长期施肥下红壤酸化特征及影响因素[D]. 北京: 中国农业科学院, 2010. |
| CAI Z J . Acidification characteristics of red soil under long-term fertilization and effect factors[D]. Beijing: Chinese Academy of Agricultural Sciences, 2010. ( in Chinese) | |
| [40] | 王伯仁, 李冬初, 徐明岗 . 中国生态系统定位观测与研究数据集:农田生态系统卷湖南祁阳站(1960-2006). 北京: 中国农业出版社, 2010. |
| WANG B R, LI D C, XU M G. Chinese Ecosystem Observation and Research Dataset: Cropland Ecosystem Volume: Hunan Qiyang Station (1960-2006). Beijing: China Agricultural Press, 2010. ( in Chinese) | |
| [41] | 鲁向晖 . 基于气候变化的豫西冬小麦保护性耕作效果模拟研究[D]. 杨凌: 西北农林科技大学, 2010. |
| LU X H . Simulation of climate change on conservation tillage of winter wheat in western region of Henan province[D]. Yangling: Northwest Agriculture and Forest University, 2010. ( in Chinese) | |
| [42] | 宋文峰, 王超, 陈荣府, 文石林, 王伯仁, 沈仁芳 . 长期不同施肥下小麦离子吸收对土壤酸化贡献能力的比较. 土壤, 2017,49(1):7-12. |
| SONG W F, WANG C, CHEN R F, WEN S L, WANG B R, SHEN R F . Comparison of contribution of wheat ionic uptake to soil acidification under long-term different fertilization. Soils, 2017,49(1):7-12. (in Chinese) |
| [1] | 吴欣珈, 薛玮, 严翊丹, 聂莹莹, 叶立明, 徐丽君. 呼伦贝尔土壤有机碳时空变异特征及其影响因素[J]. 中国农业科学, 2025, 58(6): 1145-1158. |
| [2] | 陈均权, 马驰远, 胡鑫, 李朵, 郭艳琦, 刘灿, 周凯, 郑太辉. 有机无机肥配施调控红壤稻田土壤肥力、生态化学计量特征及产量[J]. 中国农业科学, 2025, 58(23): 4952-4966. |
| [3] | 陈武荣, 肖霜霜, 肖峻, 陈丹. 喀斯特峰丛洼地利用方式对土壤有机碳及其活性组分的影响[J]. 中国农业科学, 2025, 58(10): 1969-1981. |
| [4] | 宋雅荣, 常单娜, 周国朋, 高嵩涓, 段廷玉, 曹卫东. 解磷细菌活化水稻土中低品位磷矿粉的效果与机制[J]. 中国农业科学, 2024, 57(6): 1102-1116. |
| [5] | 邱海华, 蒯磊鑫, 张璐, 刘立生, 文石林, 蔡泽江. 水田改旱地和菜地后红壤酸度和养分变化特征[J]. 中国农业科学, 2024, 57(3): 525-538. |
| [6] | 胡丹丹, 宋惠洁, 段英华, 吴艳, 胡志华, 徐小林, 张文菊, 何小林, 柳开楼, 苏鹏, 黄群招. 长期施肥对红壤双季稻系统氮素盈亏和土壤碱解氮的影响[J]. 中国农业科学, 2024, 57(24): 4907-4918. |
| [7] | 冀建华, 吕真真, 刘淑珍, 侯红乾, 刘益仁, 刘秀梅, 李絮花, 蓝贤瑾. 长期施用化肥对南方稻田土壤酸化和盐基离子损失的影响[J]. 中国农业科学, 2024, 57(13): 2599-2611. |
| [8] | 李浩, 陈金, 王洪亮, 柳开楼, 韩天富, 都江雪, 申哲, 刘立生, 黄晶, 张会民. 红壤性水稻土有机无机复合体中碳氮特征对长期施肥的响应[J]. 中国农业科学, 2023, 56(7): 1333-1343. |
| [9] | 王箫璇, 张敏, 张鑫尧, 魏鹏, 柴如山, 张朝春, 张亮亮, 罗来超, 郜红建. 不同磷肥对砂姜黑土和红壤磷库转化及冬小麦磷素吸收利用的影响[J]. 中国农业科学, 2023, 56(6): 1113-1126. |
| [10] | 李小磊,张玉军,申凤敏,姜桂英,刘芳,柳开楼,刘世亮. 长期施肥对红壤性水稻土不同土层活性有机质及碳库管理指数的影响[J]. 中国农业科学, 2020, 53(6): 1189-1201. |
| [11] | 颜鹏,韩文炎,李鑫,张丽平,张兰. 中国茶园土壤酸化现状与分析[J]. 中国农业科学, 2020, 53(4): 795-801. |
| [12] | 邬磊,何志龙,汤水荣,吴限,张文菊,胡荣桂. 稻田转为菜地初始阶段温室气体排放特征[J]. 中国农业科学, 2020, 53(24): 5050-5062. |
| [13] | 区惠平,周柳强,黄金生,谢如林,朱晓晖,彭嘉宇,曾艳,莫宗标,谭宏伟,叶盛勤. 赤红壤蔗区11年连续增量施磷下磷素演变及其 对甘蔗产量与磷流失的影响[J]. 中国农业科学, 2020, 53(22): 4623-4633. |
| [14] | 钟亮,郭熙,国佳欣,韩逸,朱青,熊杏. 基于数据挖掘技术的高光谱土壤质地分类研究[J]. 中国农业科学, 2020, 53(21): 4449-4459. |
| [15] | 王远鹏,黄晶,孙钰翔,柳开楼,周虎,韩天富,都江雪,蒋先军,陈金,张会民. 近35年红壤稻区土壤肥力时空演变特征—以进贤县为例[J]. 中国农业科学, 2020, 53(16): 3294-3306. |
|
||