


中国农业科学 ›› 2018, Vol. 51 ›› Issue (22): 4316-4327.doi: 10.3864/j.issn.0578-1752.2018.22.010
崔许锋( ),马云梦,张光宏()
收稿日期:2018-06-14
接受日期:2018-10-11
出版日期:2018-11-16
发布日期:2018-11-16
基金资助:
CUI XuFeng(),MA YunMeng,ZHANG GuangHong()
Received:2018-06-14
Accepted:2018-10-11
Published:2018-11-16
Online:2018-11-16
摘要:
【目的】揭示耕地非农化影响因素作用的时空特征,为耕地资源保护和利用政策制定提供决策支撑。【方法】研究采用2006—2015年耕地非农化的面板数据,通过构建“一般回归模型-面板模型-地理加权回归模型-时空加权回归模型”模型集成(简称OPGT),对耕地非农化影响因素进行计量分析。【结果】一般回归模型、地理加权回归模型(GWR)和时空加权回归模型(GTWR)估计结果显示,城镇人口增长、固定资产投资、经济发展水平、耕地资源禀赋和产业结构变量均通过显著性检验;耕地非农化莫兰指数(Moran’s I)为0.740,并且通过1%水平上显著性检验,表明耕地非农化具有显著的空间正相关性;采用一般回归模型、GWR、GTWR模型估计,方程拟合优度分别为0.689、0.785、0.858,加入时空权重信息的GWR和GTWR模型方程解释能力有显著提升;GWR和GTWR模型方程结果显示,耕地非农化影响因素弹性系数存在时空非平稳特征;空间分析显示,城镇人口增长和耕地资源禀赋对耕地非农化影响在经向上呈现出由西向东递减的状态,在纬向上呈现出倒“U”型状态,固定资产投资与经济发展水平对耕地非农化的影响程度在经向上呈现出由西向东递增的特征,在纬向上呈现出“U”型特征,产业结构对耕地非农化的影响程度在经向上由西向东递增,在纬向上由北向南递减;时序分析显示,城镇人口增长、固定资产与经济发展水平投资系数呈现减小的趋势,耕地资源禀赋系数有所增大,产业结构系数在部分省域有所降低。【结论】(1)OPGT是一个有机整体,各部分相互检验、互为补充,可以更加细致的刻画因素的时空作用;(2)耕地非农化因素总体作用强度方面,弹性系数最大的是产业结构,其次为经济发展水平、固定资产投资和耕地资源禀赋,最小为城镇人口增长;(3)空间特征方面,城镇人口增长和耕地资源禀赋总体呈现出由西向东递减的趋势,而固定资产投资、经济发展水平和产业结构呈现出由西向东递增的趋势;(4)时序演变特征方面,城镇人口增长、固定资产与经济发展水平投资对耕地非农化的影响作用呈现下降趋势,耕地资源禀赋与耕地非农化关联性趋于增强,产业结构的影响虽在部分省域有所降低,但其整体影响程度仍然相对较高。
崔许锋,马云梦,张光宏. 基于模型集成的中国耕地非农化影响因素及其时空特征研究[J]. 中国农业科学, 2018, 51(22): 4316-4327.
CUI XuFeng,MA YunMeng,ZHANG GuangHong. The Factors of Farmland Conversion and Its Temporal and Spatial Characteristics: An Integrated Model[J]. Scientia Agricultura Sinica, 2018, 51(22): 4316-4327.
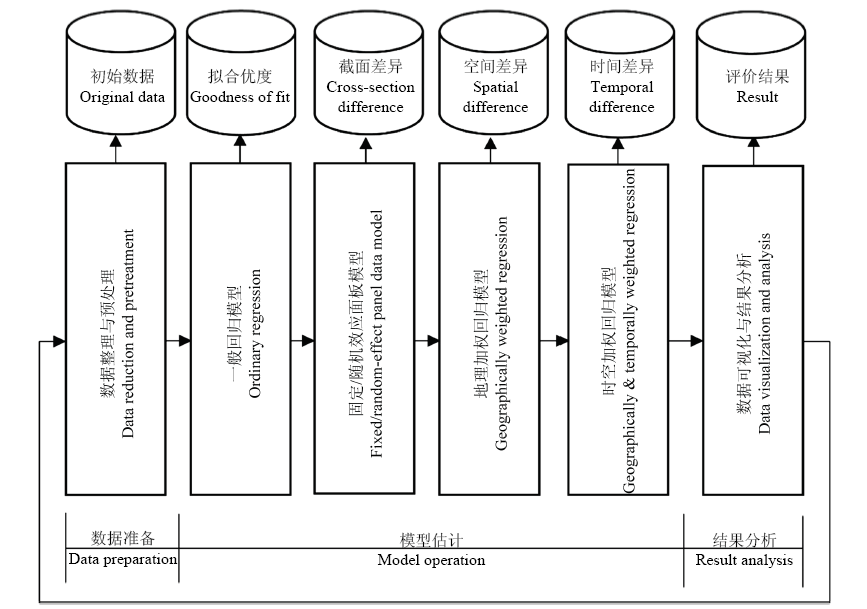
图1
OPGT 技术路线"
表1
数据描述性统计"
| 变量 Variable | 最小值 Minimum | 最大值 Maximum | 均值 Mean | 标准差 Standard deviation | 方差 Variance |
|---|---|---|---|---|---|
| Non_agr (hm2) | 2.60 | 23872.92 | 6724.08 | 4826.32 | 23293353.33 |
| Urb_popu (×104) | -60.00 | 487.00 | 69.31 | 61.49 | 3781.28 |
| Fixed_ass (×108 yuan) | 78.86 | 49935.93 | 9556.29 | 8928.17 | 79712305.52 |
| Economy (yuan/people) | 5750.00 | 57310.00 | 22779.46 | 11648.92 | 135697256.59 |
| Arable (×103 hm2) | 187.60 | 15865.90 | 4255.16 | 3125.47 | 9768536.21 |
| Indu_struc (%) | 0.70 | 0.99 | 0.89 | 0.06 | 0.003 |
表2
耕地非农化一般回归模型OLS估计结果"
| (6-a) lnNon_agr | (6-b) lnNon_agr | (6-c) lnNon_agr | (6-d) lnNon_agr | |
|---|---|---|---|---|
| lnUrb_popu | 0.474***(0.0552) | 0.294***(0.0516) | 0.401***(0.0527) | 0.358***(0.0530) |
| lnFixed_ass | 0.357***(0.0515) | 0.742***(0.0598) | 0.277**(0.0997) | 0.314**(0.0983) |
| lnEconomy | -0.878***(0.0900) | -0.128(0.158) | -0.358*(0.167) | |
| lnArable | 0.393***(0.0689) | 0.414***(0.0678) | ||
| lnIndu_struc | 2.919***(0.810) | |||
| C | 3.500***(0.350) | 7.899***(0.544) | 2.379*(1.103) | -9.199**(3.389) |
| R2 | 0.535 | 0.647 | 0.681 | 0.695 |
| Adjusted. R2 | 0.532 | 0.643 | 0.677 | 0.689 |
表3
耕地非农化固定效应模型估计结果"
| (7-a) lnNon_agr | (7-b) lnNon_agr | (7-c) lnNon_agr | (7-d) lnNon_agr | |
|---|---|---|---|---|
| lnUrb_popu | 0.235**(0.0721) | 0.175*(0.0729) | 0.173*(0.0716) | 0.167*(0.0719) |
| lnFixed_ass | 0.0505(0.0431) | -0.217*(0.0880) | -0.253**(0.0875) | -0.239**(0.0887) |
| lnEconomy | 1.454***(0.420) | 1.438***(0.421) | 1.593***(0.449) | |
| lnArable | 1.577***(0.443) | 1.570***(0.443) | ||
| lnIndu_struc | -2.728(2.758) | |||
| C | 7.076***(0.424) | -4.798(3.456) | -16.86***(4.786) | -6.207(11.79) |
| R2 | 0.048 | 0.089 | 0.129 | 0.132 |
| Adjusted. R2 | -0.063 | -0.022 | 0.019 | 0.019 |
表4
耕地非农化GWR和GTWR模型检验结果"
| 变量 Variables | GWR | GTWR | ||
|---|---|---|---|---|
| 均值Mean | 标准误Standard error | 均值Mean | 标准误Standard error | |
| lnUrb_popu | 0.3119*** | 0.0640 | 0.14491*** | 0.0094 |
| lnFixed_ass | 0.2397*** | 0.0723 | 0.66776*** | 0.0151 |
| lnEconomy | -0.5029*** | 0.1118 | -0.51308*** | 0.0205 |
| lnArable | 0.3487*** | 0.0587 | 0.27513*** | 0.0128 |
| lnIndu_struc | 4.5003*** | 1.0738 | 2.33906*** | 0.0893 |
| R2=0.785 | R2=0.858 | |||
表5
耕地非农化GWR模型估计结果"
| 省(地区)Province (Region) | lnUrb_popu | lnFixed_ass | lnEconomy | lnArable | lnIndu_struc |
|---|---|---|---|---|---|
| 北京 Beijing | 0.472 | 0.064 | -0.355 | 0.619 | 7.164 |
| 天津Tianjin | 0.460 | -0.053 | -0.153 | 0.707 | 6.569 |
| 河北Hebei | 0.531 | -0.022 | -0.206 | 0.648 | 6.344 |
| 山西Shanxi | 0.439 | -0.113 | 0.215 | 0.658 | 0.821 |
| 内蒙古Inner Mongolia | 0.272 | 0.316 | -0.709 | 0.439 | 6.364 |
| 辽宁Liaoning | 0.103 | 0.373 | -0.920 | 0.626 | 11.803 |
| 吉林Jilin | 0.058 | 0.633 | -0.978 | 0.380 | 7.285 |
| 黑龙江Heilongjiang | 0.048 | 0.694 | -0.972 | 0.303 | 5.507 |
| 上海Shanghai | 0.059 | 0.021 | -1.026 | 0.733 | 17.048 |
| 江苏Jiangsu | 0.025 | 0.274 | -1.668 | 0.676 | 22.710 |
| 浙江Zhejiang | 0.069 | -0.191 | -0.503 | 0.830 | 13.625 |
| 安徽Anhui | 0.037 | -0.074 | -0.623 | 0.780 | 13.813 |
| 福建Fujian | 0.001 | -0.472 | 0.624 | 0.816 | 2.289 |
| 江西Jiangxi | -0.020 | -0.287 | 0.385 | 0.640 | 2.498 |
| 山东Shandong | 0.186 | -0.212 | 0.210 | 0.826 | 3.223 |
| 河南Henan | 0.094 | 0.155 | 0.038 | 0.501 | -2.134 |
| 湖北Hubei | 0.096 | 0.558 | -0.670 | 0.044 | -2.950 |
| 湖南Hunan | 0.096 | 0.540 | -0.626 | 0.025 | -1.707 |
| 广东Guangdong | 0.044 | 0.841 | -1.417 | 0.006 | 3.280 |
| 广西Guangxi | 0.082 | 1.002 | -1.463 | 0.035 | 1.511 |
| 海南Hainan | 0.056 | 0.956 | -1.425 | 0.042 | 2.208 |
| 重庆Chongqing | 0.245 | 0.603 | -0.816 | 0.026 | 0.118 |
| 四川Sichuan | 0.474 | 0.476 | -0.895 | 0.027 | 3.078 |
| 贵州Guizhou | 0.123 | 0.673 | -0.874 | 0.016 | 0.746 |
| 云南Yunnan | 0.199 | 0.711 | -1.153 | 0.024 | 3.159 |
| 西藏Tibet | 1.237 | -0.197 | 0.108 | 0.109 | -1.318 |
| 陕西Shaanxi | 0.422 | 0.360 | -0.374 | 0.016 | -1.227 |
| 甘肃Gansu | 0.847 | 0.041 | -0.045 | -0.004 | 3.761 |
| 青海Qinghai | 1.256 | -0.248 | 0.146 | 0.053 | 3.327 |
| 宁夏Ningxia | 0.713 | 0.080 | 0.128 | -0.064 | 2.989 |
| 新疆Xinjiang | 0.936 | -0.065 | 0.409 | 0.249 | -2.379 |
表6
GWR模型系数统计值"
| 解释变量 Explanatory variables | 最大值 Maximum | 最小值 Minimum | 标准差 Standard deviation | 均值 Average | 绝对值的均值 Average absolute value |
|---|---|---|---|---|---|
| lnUrb_popu | 1.256 | -0.020 | 0.349 | 0.312 | 0.313 |
| lnFixed_ass | 1.002 | -0.472 | 0.286 | 0.240 | 0.365 |
| lnEconomy | 0.624 | -1.668 | 0.455 | -0.503 | 0.649 |
| lnArable | 0.830 | -0.064 | 0.316 | 0.348 | 0.352 |
| lnIndu_struc | 22.710 | -2.950 | 5.217 | 4.501 | 5.257 |
表7
耕地非农化GTWR模型估计结果(2006、2010、2015年)"
| 省(地区) Province (Region) | lnUrb_popu | lnFixed_ass | lnEconomy | lnArable | lnIndu_struc | ||||||||||
|---|---|---|---|---|---|---|---|---|---|---|---|---|---|---|---|
| 2006 | 2010 | 2015 | 2006 | 2010 | 2015 | 2006 | 2010 | 2015 | 2006 | 2010 | 2015 | 2006 | 2010 | 2015 | |
| 北京Beijing | 0.15 | 0.07 | -0.10 | 1.06 | 0.78 | 0.78 | -0.89 | -0.83 | -0.58 | 0.01 | 0.21 | 0.48 | 2.97 | 3.25 | 3.42 |
| 天津Tianjin | 0.16 | 0.06 | -0.10 | 1.06 | 0.77 | 0.79 | -0.88 | -0.81 | -0.58 | 0.01 | 0.21 | 0.47 | 2.99 | 3.19 | 3.29 |
| 河北Hebei | 0.15 | 0.07 | -0.10 | 1.06 | 0.77 | 0.77 | -0.88 | -0.82 | -0.57 | 0.01 | 0.21 | 0.48 | 2.98 | 3.11 | 3.39 |
| 山西Shanxi | 0.14 | 0.09 | -0.05 | 1.05 | 0.79 | 0.71 | -0.84 | -0.75 | -0.50 | 0.01 | 0.21 | 0.50 | 2.80 | 2.29 | 3.39 |
| 内蒙古Inner Mongolia | 0.16 | 0.07 | -0.07 | 1.04 | 0.86 | 0.72 | -0.91 | -0.92 | -0.50 | 0.01 | 0.19 | 0.52 | 2.94 | 3.39 | 3.49 |
| 辽宁Liaoning | 0.17 | 0.04 | -0.13 | 1.08 | 0.78 | 0.87 | -0.90 | -0.83 | -0.61 | 0.01 | 0.21 | 0.43 | 2.87 | 3.46 | 2.85 |
| 吉林Jilin | 0.16 | 0.03 | -0.14 | 1.11 | 0.78 | 0.88 | -0.90 | -0.80 | -0.60 | 0.00 | 0.23 | 0.42 | 2.48 | 3.58 | 2.46 |
| 黑龙江Heilongjiang | 0.18 | 0.03 | -0.14 | 1.13 | 0.79 | 0.87 | -0.90 | -0.85 | -0.55 | -0.01 | 0.25 | 0.44 | 2.01 | 4.12 | 2.09 |
| 上海Shanghai | 0.10 | 0.05 | -0.12 | 1.18 | 0.69 | 0.93 | -0.83 | -0.72 | -0.63 | 0.01 | 0.21 | 0.30 | 3.14 | 2.91 | 2.23 |
| 江苏Jiangsu | 0.12 | 0.06 | -0.12 | 1.14 | 0.72 | 0.91 | -0.83 | -0.73 | -0.62 | 0.02 | 0.21 | 0.34 | 3.12 | 2.76 | 2.31 |
| 浙江Zhejiang | 0.06 | 0.05 | -0.11 | 1.22 | 0.68 | 0.94 | -0.82 | -0.66 | -0.63 | 0.02 | 0.22 | 0.29 | 3.11 | 2.67 | 2.15 |
| 安徽Anhui | 0.11 | 0.06 | -0.11 | 1.14 | 0.73 | 0.89 | -0.83 | -0.70 | -0.60 | 0.02 | 0.21 | 0.35 | 3.08 | 2.31 | 2.21 |
| 福建Fujian | 0.02 | 0.05 | -0.09 | 1.25 | 0.69 | 0.94 | -0.85 | -0.64 | -0.64 | 0.02 | 0.22 | 0.26 | 3.02 | 1.92 | 1.93 |
| 江西Jiangxi | 0.05 | 0.07 | -0.08 | 1.19 | 0.72 | 0.90 | -0.84 | -0.65 | -0.62 | 0.02 | 0.21 | 0.30 | 3.02 | 1.68 | 2.01 |
| 山东Shandong | 0.15 | 0.07 | -0.12 | 1.09 | 0.75 | 0.86 | -0.86 | -0.77 | -0.61 | 0.01 | 0.20 | 0.41 | 3.06 | 2.77 | 2.77 |
| 河南Henan | 0.12 | 0.08 | -0.08 | 1.09 | 0.77 | 0.81 | -0.82 | -0.72 | -0.55 | 0.01 | 0.20 | 0.42 | 2.90 | 1.95 | 2.50 |
| 湖北Hubei | 0.09 | 0.09 | -0.05 | 1.12 | 0.78 | 0.80 | -0.82 | -0.69 | -0.51 | 0.01 | 0.21 | 0.39 | 2.87 | 1.46 | 2.12 |
| 湖南Hunan | 0.07 | 0.09 | -0.03 | 1.15 | 0.78 | 0.82 | -0.84 | -0.69 | -0.53 | 0.02 | 0.21 | 0.35 | 2.95 | 1.16 | 1.96 |
| 广东Guangdong | 0.01 | 0.06 | -0.04 | 1.23 | 0.75 | 0.87 | -0.91 | -0.68 | -0.57 | 0.01 | 0.22 | 0.29 | 2.96 | 1.02 | 1.92 |
| 广西Guangxi | 0.08 | 0.09 | 0.03 | 1.13 | 0.82 | 0.76 | -0.87 | -0.68 | -0.44 | 0.02 | 0.24 | 0.36 | 3.04 | 0.44 | 1.76 |
| 海南Hainan | 0.04 | 0.07 | 0.02 | 1.22 | 0.81 | 0.80 | -0.90 | -0.64 | -0.46 | 0.02 | 0.26 | 0.30 | 3.03 | 0.29 | 1.72 |
| 重庆Chongqing | 0.11 | 0.13 | 0.03 | 1.06 | 0.83 | 0.68 | -0.79 | -0.72 | -0.34 | 0.01 | 0.22 | 0.46 | 2.80 | 1.08 | 2.08 |
| 四川Sichuan | 0.16 | 0.21 | 0.12 | 0.95 | 0.83 | 0.53 | -0.74 | -0.59 | -0.02 | 0.01 | 0.29 | 0.56 | 2.71 | 0.59 | 1.68 |
| 贵州Guizhou | 0.12 | 0.13 | 0.05 | 1.07 | 0.84 | 0.68 | -0.81 | -0.72 | -0.36 | 0.01 | 0.24 | 0.43 | 2.97 | 0.59 | 1.91 |
| 云南Yunnan | 0.18 | 0.21 | 0.17 | 0.94 | 0.87 | 0.55 | -0.82 | -0.52 | 0.04 | 0.01 | 0.35 | 0.51 | 3.32 | -0.99 | 1.08 |
| 西藏Tibet | 0.42 | 0.74 | 0.30 | 0.48 | 0.21 | 0.19 | -0.61 | 0.24 | 0.66 | -0.02 | 0.82 | 0.82 | 2.90 | -0.23 | 1.10 |
| 陕西Shaanxi | 0.12 | 0.12 | 0.00 | 1.04 | 0.78 | 0.64 | -0.78 | -0.69 | -0.34 | 0.01 | 0.24 | 0.52 | 2.57 | 1.89 | 2.76 |
| 甘肃Gansu | 0.14 | 0.24 | 0.16 | 0.95 | 0.74 | 0.39 | -0.67 | -0.51 | 0.09 | 0.00 | 0.34 | 0.68 | 2.04 | 1.94 | 2.85 |
| 青海Qinghai | 0.22 | 0.40 | 0.28 | 0.80 | 0.62 | 0.22 | -0.60 | -0.30 | 0.41 | -0.01 | 0.46 | 0.77 | 1.99 | 1.46 | 2.21 |
| 宁夏Ningxia | 0.13 | 0.15 | 0.06 | 1.00 | 0.75 | 0.50 | -0.75 | -0.64 | -0.19 | 0.01 | 0.28 | 0.61 | 2.41 | 2.24 | 3.24 |
| 新疆Xinjiang | 0.24 | 0.60 | 0.31 | 0.70 | 0.41 | 0.02 | -0.69 | 0.35 | 0.74 | -0.04 | 0.74 | 0.94 | 3.06 | 0.07 | 1.16 |

图2
解释变量系数空间变化"
| [1] |
赵文武 . 世界主要国家耕地动态变化及其影响因素. 生态学报, 2012,32(20):6452-6462.
doi: 10.5846/stxb201203080314 |
|
ZHAO W W . Arable land change dynamics and their driving forces for the major countries of the world. Acta Ecologica Sinica, 2012,32(20):6452-6462. (in Chinese)
doi: 10.5846/stxb201203080314 |
|
| [2] | 中华人民共和国国土资源部. 中国国土资源统计年鉴(2007-2016). 北京: 地质出版社, 2007-2016. |
| Ministry of Land and Resources of PRC. The China Land and Resources Statistical Yearbook 2007-2016. Beijing: Geology Publishing House, 2007-2016. (in Chinese) | |
| [3] |
何英彬, 陈佑启, 姚艳敏, 石淑芹, 李志斌, 万利 . 东北三省耕地非农化时空特征及其与粮食生产能力的关系. 资源科学, 2009,31(2):295-302.
doi: 10.3321/j.issn:1007-7588.2009.02.017 |
|
HE Y B, CHEN Y Q, YAO Y M, SHI S Q, LI Z B, WAN L . Temporal and spatial characteristics analysis of relation between arable land non-agriculturalization and food productivity based on GIS technique. Resources Science, 2009,31(2):295-302. (in Chinese)
doi: 10.3321/j.issn:1007-7588.2009.02.017 |
|
| [4] | 程传兴, 高士亮, 张良悦 . 中国农地非农化与粮食安全. 经济学动态, 2014(7):87-96. |
| CHENG C X, GAO S L, ZHANG Y Y . Farmland non- agriculturalization and food security in China.Economic Perspectives, 2014(7):87-96. (in Chinese) | |
| [5] | 赵爱栋, 彭冲, 许实, 曾薇, 马贤磊 . 生态安全约束下耕地潜在转换及其对粮食生产的影响——以东北地区为例. 中国人口·资源与环境, 2017,27(11) : 124-131. |
| ZHAO A D, PENG C, XU S, ZENG W, MA X L . Impact of farmland conversion grain output under the ecological constraint: based in the Northeast of China. China Population, Resources and Environment, 2017, 27(11):124-131. (in Chinese) | |
| [6] | 张基凯, 吴群, 黄秀欣 . 耕地非农化对经济增长贡献的区域差异研究——基于山东省17个地级市面板数据的分析. 资源科学, 2010,32(5):959-969. |
| ZHANG J K, WU Q, HUANG X X . A study on regional differences in contribution of cultivated land conversion to economic growth based on panel data analysis of 17 cities in Shandong Province. Resources Science, 2010, 32(5):959-969. (in Chinese) | |
| [7] | 望晓东, 魏玲, 江华 . 耕地非农化与经济增长、城市化的互动关系实证研究——基于广东省时间序列数据的分析. 农村经济, 2013(7):32-36. |
| WANG X D, WEI L, JIANG H . Empirical study on the interactive relationship between cultivated land conversion and economic growth and urbanization——based on the analysis of time series data of Guangdong Province.Rural Economy, 2013(7):32-36. (in Chinese) | |
| [8] |
沈孝强, 吴次芳, 方明 . 浙江省产业、人口与土地非农化的协调性分析. 中国人口·资源与环境, 2014,24(9):129-134.
doi: 10.3969/j.issn.1002-2104.2014.09.018 |
|
SHEN X Q, WU C F, FANG M . Coordination of industry, population and land deagriculturalization during the rapid process of urbanization in Zhejiang Province. China Population, Resources and Environment, 2014,24(9):129-134. (in Chinese)
doi: 10.3969/j.issn.1002-2104.2014.09.018 |
|
| [9] |
杨振, 刘会敏, 余斌 . 土地非农化生态价值损失估算. 中国人口·资源与环境, 2013,23(10):146-150.
doi: 10.3969/j.issn.1002-2104.2013.10.021 |
|
YANG Z, LIU H M, YU B . Estimation on loss of ecological value in the process of land’s non-agriculturalization. China Population, Resources and Environment, 2013,23(10):146-150. (in Chinese)
doi: 10.3969/j.issn.1002-2104.2013.10.021 |
|
| [10] | 李国敏, 卢珂, 黄烈佳 . 主体权益下耕地非农化价值损失补偿的反思与重构. 中国人口·资源与环境, 2017,27(12) : 137-145. |
| LI G M, LU K, HUANG L J . Reflection and reconstruction of cultivated land conversion value loss compensation under the subject rights. China Population, Resources and Environment, 2017, 27(12):137-145. (in Chinese) | |
| [11] | 谭荣, 曲福田 . 中国农地非农化与农地资源保护:从两难到双赢. 管理世界, 2006(12):50-66. |
| TAN R, QU F T . Farmland conversion and farmland resources protection in china: From dilemma to win-win.Management World, 2006(12):50-66. (in Chinese) | |
| [12] |
叶宇航 . 我国耕地非农化的驱动因素研究. 科学决策, 2015(9):33-50.
doi: 10.3773/j.issn.1006-4885.2015.09.033 |
|
YE Y H . The analysis of drivers of our country's cultivated land conversion.Scientific Decision-Making, 2015(9):33-50. (in Chinese)
doi: 10.3773/j.issn.1006-4885.2015.09.033 |
|
| [13] |
许恒周, 吴冠岑, 郭玉燕 . 耕地非农化与中国经济增长质量的库兹涅茨曲线假说及验证——基于空间计量经济模型的实证分析. 中国土地科学, 2014,28(1):75-81.
doi: 10.3969/j.issn.1001-8158.2014.01.010 |
|
XU H Z, WU G C, GUO Y Y . A hypothesis on the Kuznets Curve relation between farmland conversion and quality of economic growth in China: An empirical analysis of spatial econometric model.China Land Sciences, 2014, 28(1):75-81. (in Chinese)
doi: 10.3969/j.issn.1001-8158.2014.01.010 |
|
| [14] |
QIU F, LALIBERTÉ L, SWALLOW B . Impacts of fragmentation and neighbor influences on farmland conversion: A case study of the Edmonton-Calgary Corridor, Canada. Land Use Policy, 2015, 48(1):482-494.
doi: 10.1016/j.landusepol.2015.06.024 |
| [15] |
张光宏, 崔许锋 . 耕地资源非农化驱动机制及其区域差异性. 中国农业科学, 2015,48(8):1632-1640.
doi: 10.3864/j.issn.0578-1752.2015.08.18 |
|
ZHANG G H, CUI X F . Driving mechanism and regional differentiation of cultivated land non-agricultural-transformation. Scientia Agricultura Sinica, 2015,48(8):1632-1640. (in Chinese)
doi: 10.3864/j.issn.0578-1752.2015.08.18 |
|
| [16] |
USTAOGLU E, WILLIAMS B . Determinants of urban expansion and agricultural land conversion in 25 EU countries. Environmental Management, 2017, 60(4):717-746.
doi: 10.1007/s00267-017-0908-2 pmid: 28685244 |
| [17] | 宋敏, 王登娜 . 省域农地城市流转规模及其影响因素作用的空间异质性研究. 中国人口·资源与环境, 2018,28(1):54-62. |
| SONG M, WANG D N . Spatial heterogeneity of provincial rural-urban land conversion scale and effects of its influential factors. China Population, Resources and Environment, 2018, 28(1):54-62. (in Chinese) | |
| [18] | STOPP G H . The destruction of American agricultural land. Geography, 1984, 69(1):64-66. |
| [19] | 曲福田, 冯淑怡, 诸培新, 陈志刚 . 制度安排、价格机制与农地非农化研究. 经济学(季刊), 2004,4(1):229-248. |
| QU F T, FENG S Y, ZHU P X, CHEN Z G . Institutional arrangements, price system and farmland conversion. China Economic Quarterly, 2004,4(1):229-248. (in Chinese) | |
| [20] | 钱忠好, 牟燕 . 中国农地非农化市场化改革为何举步维艰——基于地方政府土地财政依赖视角的分析. 农业技术经济, 2017(1):18-27. |
| QIAN Z H, MOU Y . Why does the reform of non-agriculturalization of agricultural land in China make it difficult?——Based on the analysis of local government's dependence on land and finance. Journal of Agrotechnical Economics, 2017(1):18-27. (in Chinese) | |
| [21] |
王春秋, 徐长生 . 山东省建设占用耕地与经济增长的脱耦分析. 中国人口·资源与环境, 2012,22(8):128-132.
doi: 10.3969/j.issn.1002-2104.2012.08.020 |
|
WANG C Q, XU C S . Decoupling evaluation between cultivated land occupation and economic growth in Shandong Province. China Population, Resources and Environment, 2012,22(8):128-132. (in Chinese)
doi: 10.3969/j.issn.1002-2104.2012.08.020 |
|
| [22] |
马才学, 赵利利, 柯新利 . 湖北省耕地非农化压力的时空演变格局. 长江流域资源与环境, 2016,25(1):71-78.
doi: 10.11870/cjlyzyyhj201601009 |
|
MA C X, ZHAO L L, KE X L . Temporal spatial variation of the pressure of cropland non-argiculturalization in Hubei Province. Resources and Environment in the Yangtze Basin, 2016,25(1):71-78. (in Chinese)
doi: 10.11870/cjlyzyyhj201601009 |
|
| [23] |
张孝宇, 张安录 . 武汉市耕地非农化的空间自相关分析. 长江流域资源与环境, 2015,24(5):781-788.
doi: 10.11870/cjlyzyyhj201505010 |
|
ZHANG X Y, ZHANG A L . Small-Scale spatial patterns of farmland conversion based on autocorrelation analysis in Wuhan City. Resources and Environment in the Yangtze Basin, 2015,24(5):781-788. (in Chinese)
doi: 10.11870/cjlyzyyhj201505010 |
|
| [24] |
崔许锋, 张光宏, 李飞 . 城镇化土地集约利用潜力空间分异研究—基于土地城镇化的“人口-经济”二元驱动视角. 华东经济管理, 2016,30(10):62-67.
doi: 10.3969/j.issn.1007-5097.2016.10.010 |
|
CUI X F, ZHANG G H, LI F . A study on spatial differentiation of land intensive use potential: Based on the perspective of “Population- Economy” dual driving mode of land urbanization. East China Economic Management, 2016,30(10):62-67. (in Chinese)
doi: 10.3969/j.issn.1007-5097.2016.10.010 |
|
| [25] |
WU B, LI R R, HUANG B . A geographically and temporally weighted autoregressive model with application to housing prices. International Journal of Geographical Information Science, 2014,28(5):1186-1204.
doi: 10.1080/13658816.2013.878463 |
| [26] |
CHU H J, HUANG B, LIN C Y . Modeling the spatio-temporal heterogeneity in the PM10-PM2.5 relationship. Atmospheric Environment, 2015,102:176-182.
doi: 10.1016/j.atmosenv.2014.11.062 |
| [27] | 王新刚, 孔云峰 . 基于时空窗口改进的时空加权回归分析——以湖北省黄石市住房价格为例. 地理科学, 2015,35(5):615-621. |
| WANG X G, KONG Y F . An improved spatiotemporally weighted regression analysis based on spatiotemporal windows: A case study of housing price of Huangshi City, Hubei Province. Scientia Geographica Sinica, 2015,35(5):615-621. (in Chinese) | |
| [28] |
MORAN P A P . Notes on continuous stochastic phenomena. Biometrika, 1950,37(1/2):17-23.
doi: 10.1093/biomet/37.1-2.17 |
| [29] |
LEVERS C, SCHNEIDER M, PRISHCHEPOV A V, ESTEL S, KUEMMERLE T . Spatial variation in determinants of agricultural land abandonment in Europe. Science of the Total Environment, 2018,644:95-111.
doi: 10.1016/j.scitotenv.2018.06.326 |
| [30] | 刘艳清, 葛京凤, 李灿, 刘欣 . 基于空间自相关的城市住宅地价空间分异规律研究——以石家庄市城区为例. 干旱区资源与环境, 2018,32(12):55-62. |
| LIU Y Q, GE J F, LI C, LIU X . Spatial differentiation characteristics of urban residential land prices of Shijiazhuang City based on spatial autocorrelation. Journal of Arid Land Resources and Environment, 2018,32(12):55-62. (in Chinese) | |
| [31] |
吴文佳, 张晓平, 李媛芳 . 北京市景观可达性与住宅价格空间关联. 地理科学进展, 2014,33(4):488-498.
doi: 10.11820/dlkxjz.2014.04.006 |
|
WU W J, ZHANG X P, LI Y F . Spatial correlation analysis of landscape accessibility and residential housing price in Beijing. Progress in Geography, 2014,33(4):488-498. (in Chinese)
doi: 10.11820/dlkxjz.2014.04.006 |
|
| [32] |
TOBLER W R . A computer movie simulating urban growth in the Detroit region. Economic geography, 1970,46(Suppl.):234-240.
doi: 10.2307/143141 |
| [1] | 尹忞昊, 陈池波, 卢奕亨, 田云. 中国农业碳排放密度的时空特征、动态演进与空间效应[J]. 中国农业科学, 2025, 58(18): 3710-3727. |
| [2] | 田云, 王骁睿, 尹忞昊, 张蕙杰. 中国农业净碳汇再测算:现状特征、时空格局及其影响因素[J]. 中国农业科学, 2024, 57(22): 4507-4521. |
| [3] | 田云, 尹忞昊, 张蕙杰. 我国农村能源碳排放时空格局、影响因素及空间溢出效应[J]. 中国农业科学, 2023, 56(13): 2547-2562. |
| [4] | 陈绪昊,高强,陈新平,张务帅. 东北三省玉米生产资源投入和环境效应的时空特征[J]. 中国农业科学, 2022, 55(16): 3170-3184. |
| [5] | 李方杰,任建强,吴尚蓉,陈仲新,张宁丹. 河南省冬小麦种植频率时空变化及影响因素分析[J]. 中国农业科学, 2020, 53(9): 1773-1794. |
| [6] | 田云,王梦晨. 湖北省农业碳排放效率时空差异及影响因素[J]. 中国农业科学, 2020, 53(24): 5063-5072. |
| [7] | 魏启航,任艳芳,何俊瑜,李兆君. 畜禽养殖废弃物堆肥过程中微生物除臭研究进展[J]. 中国农业科学, 2020, 53(15): 3134-3145. |
| [8] | 赵晴月,许世杰,张务帅,张哲,姚智,陈新平,邹春琴. 中国玉米主产区土壤养分的空间变异及影响因素分析[J]. 中国农业科学, 2020, 53(15): 3120-3133. |
| [9] | 程伟, 辛晓平. 基于TVDI的内蒙古草地干旱变化特征分析[J]. 中国农业科学, 2020, 53(13): 2728-2742. |
| [10] | 朱晓昱,徐大伟,辛晓平,沈贝贝,丁蕾,王旭,陈宝瑞,闫瑞瑞. 1992—2015年呼伦贝尔草原区不同草地类型分布时空变化遥感分析[J]. 中国农业科学, 2020, 53(13): 2715-2727. |
| [11] | 刘志娟,杨晓光,吕硕,王静,LIN XiaoMao. 东北三省春玉米产量差时空分布特征[J]. 中国农业科学, 2017, 50(9): 1606-1616. |
| [12] | 王克如,李少昆. 玉米籽粒机械收获破碎率研究进展[J]. 中国农业科学, 2017, 50(11): 2018-2026. |
| [13] | 李建军,徐明岗,辛景树,段建军,任意,李冬初,黄晶,申华平,张会民. 中国稻田土壤基础地力的时空演变特征[J]. 中国农业科学, 2016, 49(8): 1510-1519. |
| [14] | 张 羽2,李 悦,秦晓波,孔范龙,郗 敏,李玉娥. 亚热带农业小流域水系溶存甲烷浓度和扩散通量研究[J]. 中国农业科学, 2016, 49(20): 3968-3980. |
| [15] | 吴彦庆,赵大球,陶 俊. 芍药花色调控基因的密码子使用模式及其影响因素分析[J]. 中国农业科学, 2016, 49(12): 2368-2378. |
|
||