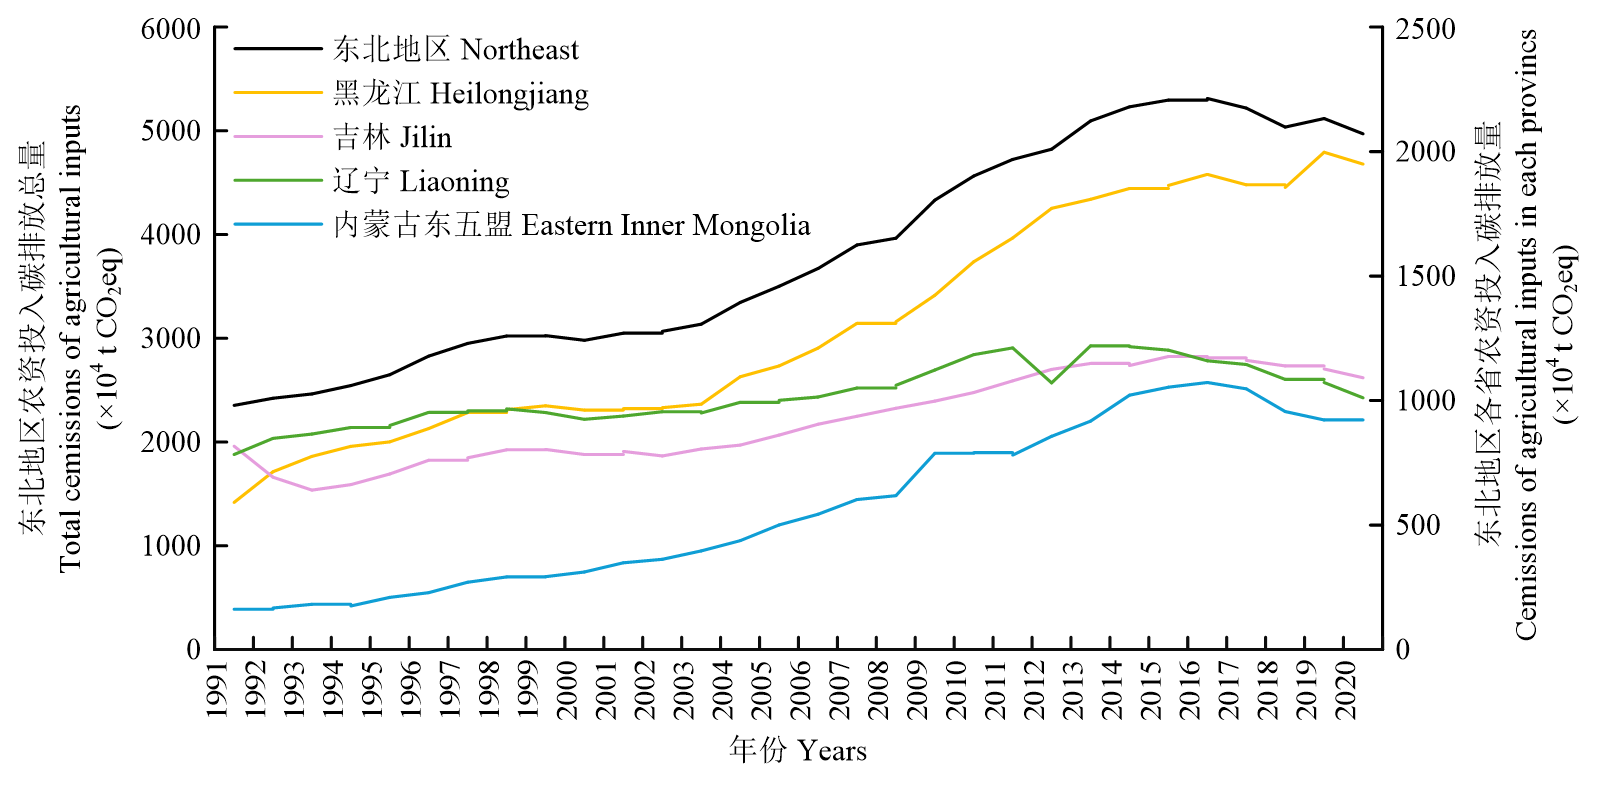
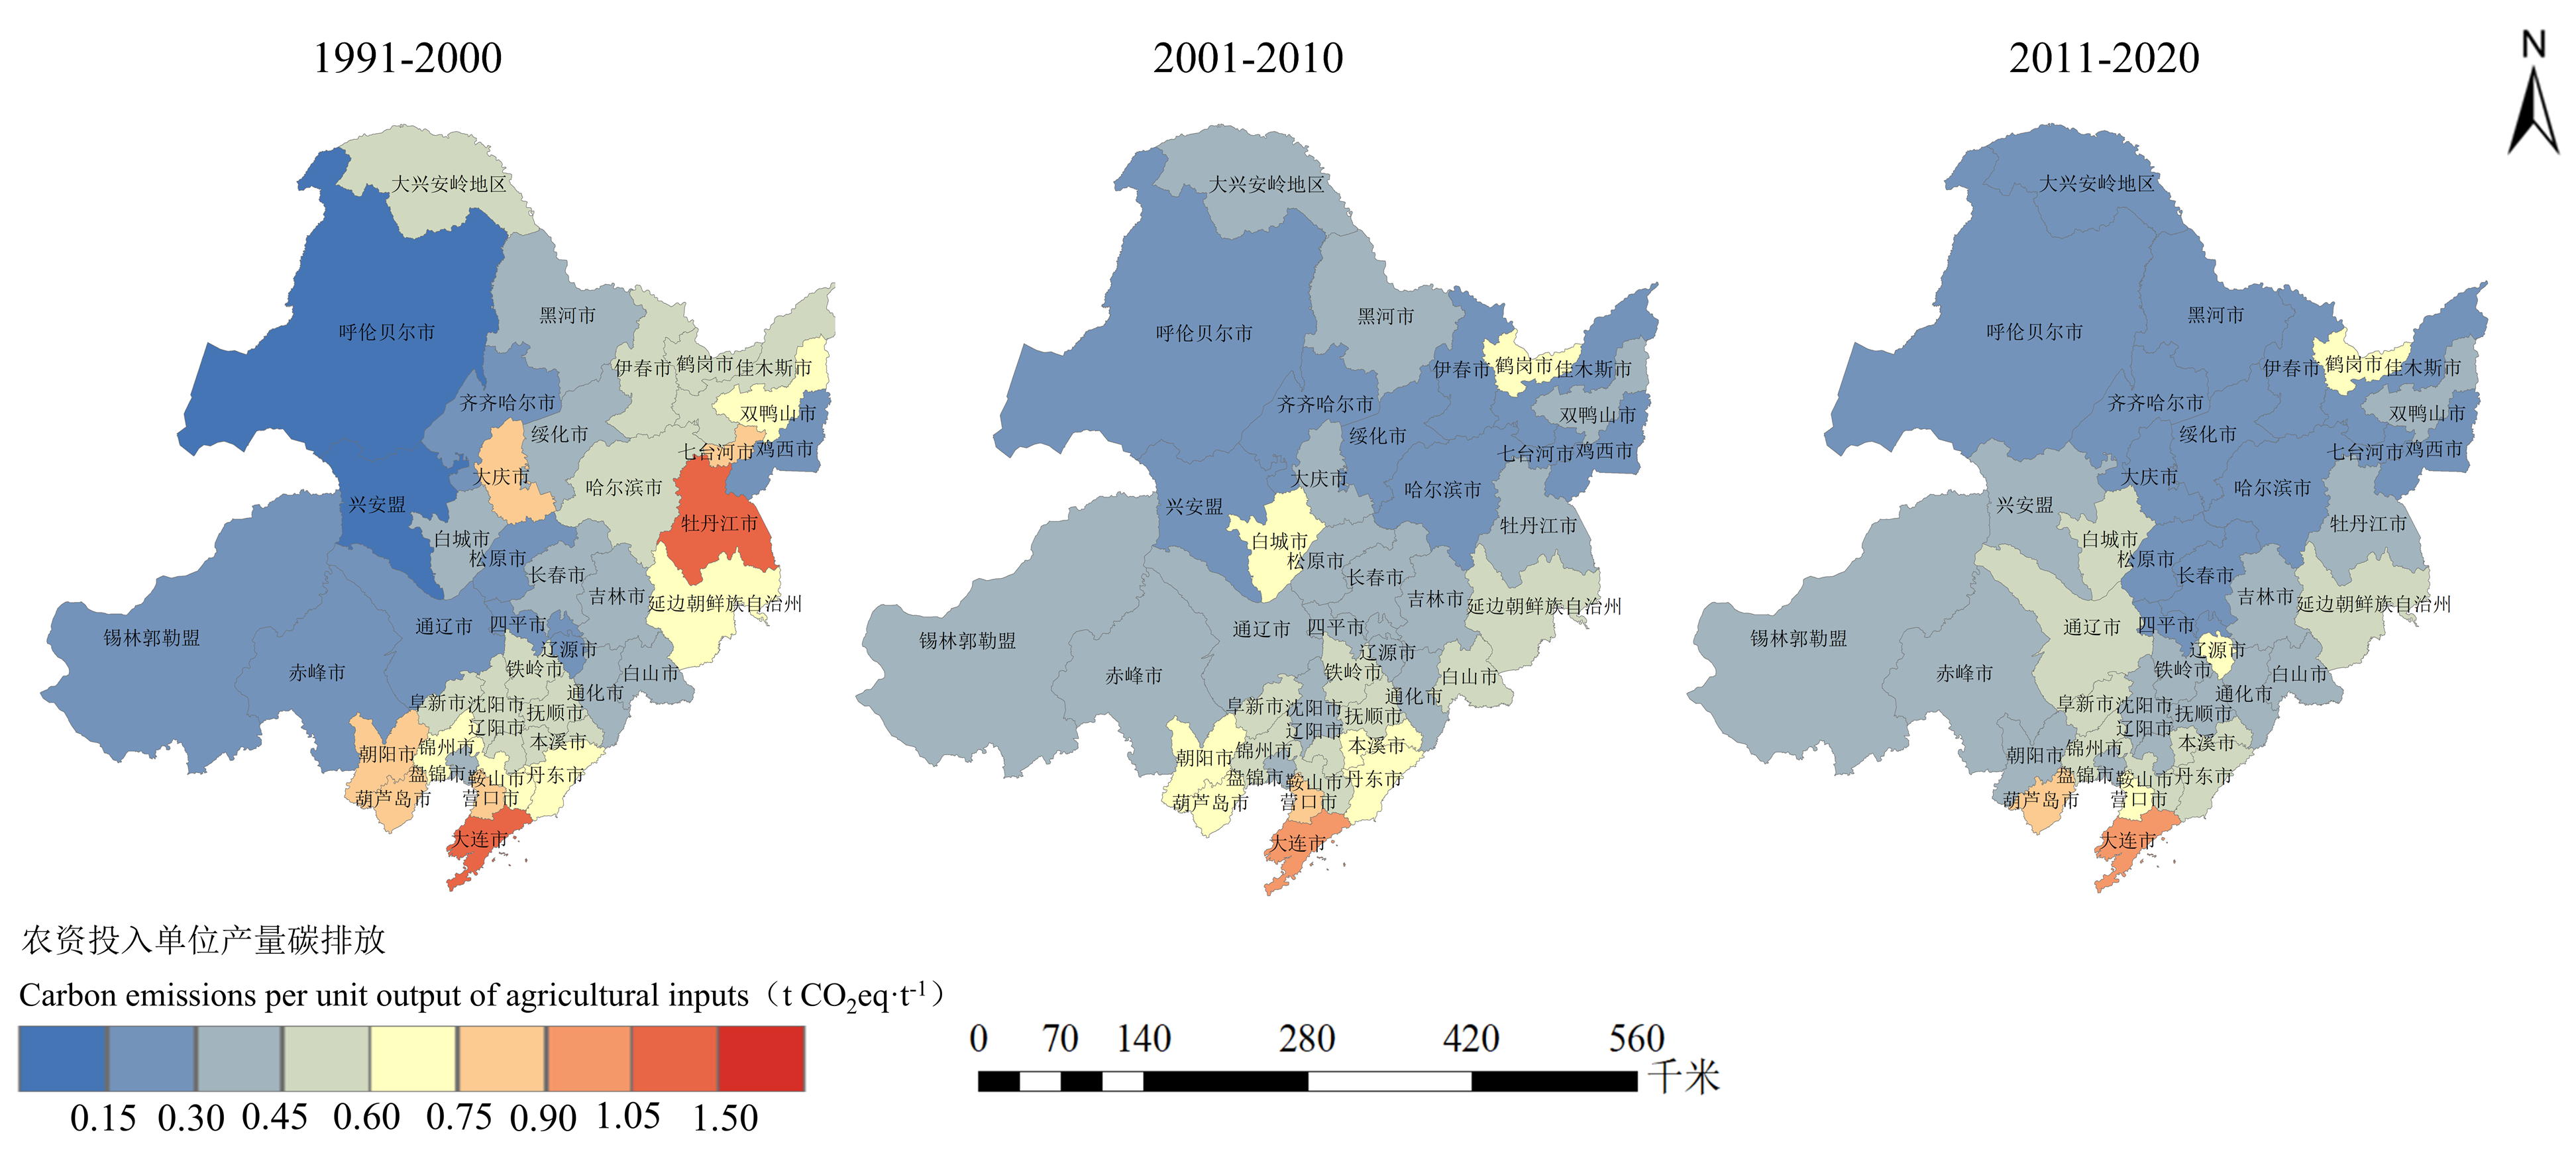
| [1] |
张熙伦, 王萍, 刘亚龙, 汪景宽. 东北地区化肥投入下农业环境成本的时空变化特征. 土壤学报. https://link.cnki.net/urlid/32.1119.P.20251010.0953.002.
|
|
ZHANG X L, WANG P, LIU Y L, WANG J K. Spatiotemporal variation characteristics of agricultural environmental costs under fertilizer input in Northeast China. Acta Pedologica Sinica. https://link.cnki.net/urlid/32.1119.P.20251010.0953.002. in Chinese)
|
| [2] |
李政通, 白彩全, 肖薇薇. 基于LMDI模型的东北地区农业碳排放测度与分解. 干旱地区农业研究, 2017, 35(4): 145-152.
|
|
LI Z T, BAI C Q, XIAO W W. The measurement and decomposition of agricultural carbon emissions in Northeast China based on LMDI model. Agricultural Research in the Arid Areas, 2017, 35(4): 145-152. (in Chinese)
|
| [3] |
CHENG K, PAN G X, SMITH P, LUO T, LI L Q, ZHENG J W, ZHANG X H, HAN X J, YAN M. Carbon footprint of China’s crop production: An estimation using agro-statistics data over 1993-2007. Agriculture, Ecosystems & Environment, 2011, 142(3/4): 231-237.
doi: 10.1016/j.agee.2011.05.012
|
| [4] |
温涛, 孙鹏翔, 张林. 中国农业碳排放的动态演进与区域格局. 经济地理, 2024, 44(10): 165-175.
doi: 10.15957/j.cnki.jjdl.2024.10.017
|
|
WEN T, SUN P X, ZHANG L. Dynamic evolution and regional pattern of agricultural carbon emissions in China. Economic Geography, 2024, 44(10): 165-175. (in Chinese)
doi: 10.15957/j.cnki.jjdl.2024.10.017
|
| [5] |
程正涛, 徐彪, 刘治航, 梁承月, 张无敌. 云南省农作物生产过程农资投入品碳排放变化特征. 中国农业气象, 2025, 46(3): 315-325.
|
|
CHENG Z T, XU B, LIU Z H, LIANG C Y, ZHANG W D. Changes of carbon emissions from agricultural inputs during crop production in Yunnan Province. Chinese Journal of Agrometeorology, 2025, 46(3): 315-325. (in Chinese)
doi: 10.3969/j.issn.1000-6362.2025.03.004
|
| [6] |
李梦冉, 徐小任, 王梁, 段健, 史舒琪, 任丹丹. 黄河流域农业碳排放时空变化特征及影响因素分析. 干旱区地理, 2025, 48(5): 854-865.
doi: 10.12118/j.issn.1000-6060.2024.401
|
|
LI M R, XU X R, WANG L, DUAN J, SHI S Q, REN D D. Spatial-temporal characteristics and influencing factors of agricultural carbon emissions in the Yellow River Basin. Arid Land Geography, 2025, 48(5): 854-865. (in Chinese)
doi: 10.12118/j.issn.1000-6060.2024.401
|
| [7] |
宁静, 杨楠, 杜国明, 孙天成, 胡明均, 王蕾. 区域农田生态系统碳足迹时空演变研究: 以黑龙江省为例. 中国农业大学学报, 2023, 28(6): 98-112.
|
|
NING J, YANG N, DU G M, SUN T C, HU M J, WANG L. Spatial-temporal evolution of carbon footprint of farmland ecosystem: A case study of Heilongjiang Province. Journal of China Agricultural University, 2023, 28(6): 98-112. (in Chinese)
|
| [8] |
郝小雨, 孙磊, 马星竹, 王爽, 周宝库, 匡恩俊, 李伟群. 黑龙江省黑土区玉米田氮肥减施效应及碳足迹估算. 河北农业大学学报, 2022, 45(5): 10-18, 131.
doi: 10.13320/j.cnki.jauh.2022.0072
|
|
HAO X Y, SUN L, MA X Z, WANG S, ZHOU B K, KUANG E J, LI W Q. Nitrogen reduction effect and carbon footprint estimation of maize field in black soil region of Heilongjiang Province. Journal of Hebei Agricultural University, 2022, 45(5): 10-18, 131. (in Chinese)
|
| [9] |
|
|
WANG Z B, WANG M, CHEN F. Carbon footprint analysis of crop production in North China Plain. Scientia Agricultura Sinica, 2015, 48(1): 83-92. doi: 10.3864/j.issn.0578-1752.2015.01.09. (in Chinese)
|
| [10] |
CHEN S, LU F, WANG X K. Estimation of greenhouse gas emission coefficient in China nitrogen phosphorus potassium fertilizer. Ecology, 2015, 19: 6371-6383.
|
| [11] |
李楠. 中国农业能源消费及温室气体排放研究[D]. 大连: 大连理工大学, 2014.
|
|
LI N. Study on energy consumption and GHG emissions of agriculture in China[D]. Dalian: Dalian University of Technology, 2014. (in Chinese)
|
| [12] |
ZHANG G, LU F, HUANG Z G, CHEN S, WANG X K. The chemical pesticide dosage and its greenhouse gas emission estimation of my country’s main grain crops. Journal of Apply Ecology, 2016, 9: 2875-2883.
|
| [13] |
CREMADES R, ROTHAUSEN S G S A, CONWAY D, ZOU X X, WANG J X, LI Y. Co-benefits and trade-offs in the water-energy nexus of irrigation modernization in China. Environmental Research Letters, 2016, 11(5): 054007.
doi: 10.1088/1748-9326/11/5/054007
|
| [14] |
何友, 曾福生. 中国粮食生产与消费的区域格局演变. 中国农业资源与区划, 2018, 39(3): 1-8.
|
|
HE Y, ZENG F S. The regional pattern evolution of China’s grain production and consumption. Chinese Journal of Agricultural Resources and Regional Planning, 2018, 39(3): 1-8. (in Chinese)
|
| [15] |
张云柏, 孙正宝, 冯玥雯, 袁术峰, 张洋, 魏廷平, 李玲美. 2013—2022年云南省农业碳排放的时空变化. 中国生态农业学报(中英文), 2025, 33(7): 1394-1407.
|
|
ZHANG Y B, SUN Z B, FENG Y W, YUAN S F, ZHANG Y, WEI T P, LI L M. Temporal and spatial dynamics of agricultural carbon emissions in Yunnan Province from 2013 to 2022. Chinese Journal of Eco-Agriculture, 2025, 33(7): 1394-1407. (in Chinese)
|
| [16] |
|
|
WANG X Y, YANG X G, LÜ S, CHEN F. The possible effects of global warming on cropping systems in China Ⅻ. the possible effects of climate warming on geographical shift in safe planting area of rice in cold areas and the risk analysis of chilling damage. Scientia Agricultura Sinica, 2016, 49(10): 1859-1871. doi: 10.3864/j.issn.0578-1752.2016.10.003. (in Chinese)
|
| [17] |
周思宇, 郗凤明, 尹岩, 邴龙飞, 王娇月, 马铭婧, 张文凤. 东北地区耕地利用碳排放核算及驱动因素. 应用生态学报, 2021, 32(11): 3865-3871.
doi: 10.13287/j.1001-9332.202111.003
|
|
ZHOU S Y, XI F M, YIN Y, BING L F, WANG J Y, MA M J, ZHANG W F. Accounting and drivers of carbon emission from cultivated land utilization in Northeast China. Chinese Journal of Applied Ecology, 2021, 32(11): 3865-3871. (in Chinese)
|
| [18] |
刘蕊, 常单娜, 周国朋, 高嵩涓, 柴强, 曹卫东. 农田氧化亚氮减排技术及其与绿肥协同应用分析. 草业学报, 2025, 34(2): 196-210.
doi: 10.11686/cyxb2024111
|
|
LIU R, CHANG D N, ZHOU G P, GAO S J, CHAI Q, CAO W D. Techniques of N2O emission reduction in farmland and their synergistic application with green manure. Acta Prataculturae Sinica, 2025, 34(2): 196-210. (in Chinese)
|
| [19] |
宋英博. 黑龙江省三江平原地区高产玉米品种特征特性及栽培中存在问题. 现代农业研究, 2022, 28(7): 104-107.
|
|
SONG Y B. Problems in the characteristics and cultivation of high-yield maize varieties in Sanjiang Plain of Heilongjiang Province. Modern Agriculture Research, 2022, 28(7): 104-107. (in Chinese)
|
| [20] |
魏紫薇, 武嘉文, 王崇生, 韩阳, 肖珩, 许志伟. 测土配方施肥技术在哈尔滨市发展历程及现状. 黑龙江农业科学, 2024(11): 76-83.
|
|
WEI Z W, WU J W, WANG C S, HAN Y, XIAO H, XU Z W. Development history and current status analysis of soil testing and formulated fertilization technology in Harbin City. Heilongjiang Agricultural Sciences, 2024(11): 76-83. (in Chinese)
|
| [21] |
冯雪婉, 李翠兰, 彭畅, 张晋京, 林园, 刘杭. 玉米-大豆轮作体系对黑土土壤固氮菌群落结构及其质量的影响. 自然资源学报, 2022, 37(9): 2319-2333.
doi: 10.31497/zrzyxb.20220909
|
|
FENG X W, LI C L, PENG C, ZHANG J J, LIN Y, LIU H. Effects of corn-soybean rotation system on soil nitrogen-fixing bacteria community structure and quality in black soil. Journal of Natural Resources, 2022, 37(9): 2319-2333. (in Chinese)
doi: 10.31497/zrzyxb.20220909
|
| [22] |
张野, 李继竹, 谷岩, 胡文河, 栾奕, 于维, 于铁, 李磊鑫. 耐密植玉米品种天育108在吉林省产量潜力研究. 中国种业, 2023(12): 141-146.
|
|
ZHANG Y, LI J Z, GU Y, HU W H, LUAN Y, YU W, YU T, LI L X. Study on the yield potential of dense-tolerant maize variety Tianyu 108 in Jilin Province. China Seed Industry, 2023(12): 141-146. (in Chinese)
|
| [23] |
王陆陆, 许雨萱, 柴嫃嫃, 徐霞, 吕杰. 农业机械化水平对农业碳排放强度影响研究: 基于2004—2021年30个省域面板数据检验. 中国农业资源与区划, 2025, 46(8): 55-66.
|
|
WANG L L, XU Y X, CHAI Z Z, XU X, LÜ J. Impact of agricultural mechanization development on agricultural carbon emission intensity-based on a panel data test for 30 provinces from 2004-2021. Chinese Journal of Agricultural Resources and Regional Planning, 2025, 46(8): 55-66. (in Chinese)
|
| [24] |
张晨霞, 陈方正, 黄明霞, 李林超, 肖登攀, 冯璞玉, 刘德立, 胡克林. 基于CMIP6气候模式的东北三省农业水热资源时空变化特征. 地理与地理信息科学, 2023, 39(3): 94-103.
|
|
ZHANG C X, CHEN F Z, HUANG M X, LI L C, XIAO D P, FENG P Y, LIU D L, HU K L. Spatial and temporal change characteristics of agricultural precipitation and heat resources in Northeast China based on CMIP6. Geography and Geo-Information Science, 2023, 39(3): 94-103. (in Chinese)
|
| [25] |
王本龙. 西辽河平原盐碱地土壤改良策略研究[D]. 呼和浩特: 内蒙古财经大学, 2024.
|
|
WANG B L. Study on soil improvement strategy of saline-alkali land in Xiliao river plain[D]. Hohhot: Inner Mongolia University of Finance and Economics, 2024. (in Chinese)
|
| [26] |
王楠, 陈从喜, 郭文华, 李士伟, 齐书花, 朱先云, 苏宇, 李政, 高宇. 中国耕地面积-粮食产量重心迁移轨迹特征及空间错位关系. 济南大学学报(自然科学版), 2024, 38(1): 53-60.
|
|
WANG N, CHEN C X, GUO W H, LI S W, QI S H, ZHU X Y, SU Y, LI Z, GAO Y. Characteristics of transfer trajectory of barycenter and spatial mismatch relationship between cultivated land area and grain yield in China. Journal of University of Jinan (Science and Technology), 2024, 38(1): 53-60. (in Chinese)
|
| [27] |
吕杰, 席晓玲, 刘洪彬, 韩晓燕, 姜飞强. 辽宁省玉米布局变化及其区域比较优势研究. 沈阳农业大学学报, 2016, 47(3): 379-384.
|
|
LÜ J, XI X L, LIU H B, HAN X Y, JIANG F Q. Study on the change of corn distribution and its regional comparative advantage in Liaoning Province. Journal of Shenyang Agricultural University, 2016, 47(3): 379-384. (in Chinese)
|
| [28] |
王海娜. 我国玉米生产碳排放效率研究[D]. 长春: 吉林大学, 2018.
|
|
WANG H N. Study on carbon emission efficiency of maize production in China[D]. Changchun: Jilin University, 2018. (in Chinese)
|
| [29] |
彭亮亮, 董宇, 刘强, 杜跃中. 吉林省长白山地区人参产业发展现状问题及对策. 南方农业, 2024, 18(11): 175-177.
|
|
PENG L L, DONG Y, LIU Q, DU Y Z. Current situation, problems and countermeasures of ginseng industry development in Changbai Mountain Area, Jilin Province. South China Agriculture, 2024, 18(11): 175-177. (in Chinese)
|


 ), 刘亚龙, 王萍(