


中国农业科学 ›› 2019, Vol. 52 ›› Issue (23): 4296-4308.doi: 10.3864/j.issn.0578-1752.2019.23.010
丁怡博1,徐家屯1,2,3,李亮1,2,3,蔡焕杰1,2,3( ),孙亚楠1,2,3
收稿日期:2019-03-22
接受日期:2019-07-19
出版日期:2019-12-01
发布日期:2019-12-01
通讯作者:
蔡焕杰
作者简介:丁怡博,E-mail:dingyiboxbnl@nwafu.edu.cn
基金资助:
DING YiBo1,XU JiaTun1,2,3,LI Liang1,2,3,CAI HuanJie1,2,3(),SUN YaNan1,2,3
Received:2019-03-22
Accepted:2019-07-19
Online:2019-12-01
Published:2019-12-01
Contact:
HuanJie CAI
摘要:
【目的】目前干旱研究多为基于历史干旱事件分析成因与变化趋势,而结合过去与未来长时间序列数据更能揭示干旱变化特点。寻找在基于CMIP5模型输出未来气象数据时模拟干旱指数方法并探究陕西省过去与未来干旱变化特点,为陕西省未来农业水资源管理提供依据。【方法】根据陕西省18个气象站历史数据以及CMIP5模式输出未来气象数据,比较了3种模型模拟参考作物蒸发蒸腾量(ET0),并基于参考作物蒸发蒸腾量(ET0)和降水数据计算标准降水蒸发指数(SPEI)和相对湿润指数(MI)反映干旱程度,比较过去(1958—2018年)与未来(2019—2100年)干旱的时空变化特点。【结果】多元线性回归模型(Multiple Linear Regression, MLR)能较准确的模拟参考作物蒸发蒸腾量(ET0)(RMSE=0.457 mm·d -1);在RCP2.6和RCP8.5情景下未来干旱指数呈现上升趋势,在RCP8.5情景下,21世纪40年代存在干旱指数的突变年份;陕西省未来干旱程度降低,年内干旱分布更加不均匀;未来时期夏玉米生长季干旱程度减小,冬小麦生长季干旱程度增加。【结论】在不同RCP情景下,未来干旱变化特征存在差异,相同RCP情景下,SPEI和MI反映的干旱特征变化基本一致,但部分时段存在变化差异。为有效应对气候变化对旱作作物产量造成的负面影响,应当增强土壤蓄水保墒能力,尤其加强冬小麦生长季的抗旱工作。
丁怡博,徐家屯,李亮,蔡焕杰,孙亚楠. 基于SPEI和MI分析陕西省干旱特征及趋势变化[J]. 中国农业科学, 2019, 52(23): 4296-4308.
DING YiBo,XU JiaTun,LI Liang,CAI HuanJie,SUN YaNan. Analysis of Drought Characteristics and Its Trend Change in Shaanxi Province Based on SPEI and MI[J]. Scientia Agricultura Sinica, 2019, 52(23): 4296-4308.
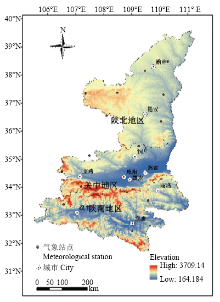
图1
陕西省气象站点分布"

表1
CMIP5全球气候模式基本信息"
| 序号 Serial number | 模式名称 Mode name | 模式所在国家 Mode of country |
|---|---|---|
| 1 | bcc-csm1-1 | 中国China |
| 2 | CanESM2 | 加拿大Canada |
| 3 | CSIRO-Mk3-6-0 | 澳大利亚Australia |
| 4 | HadGEM2-ES | 英国United Kingdom |
| 5 | MPI-ESM-LR | 德国Germany |
| 6 | MRI-CGCM3 | 日本Japan |
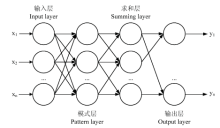
图2
GRNN模型结构图"
表2
SPEI和MI干旱等级划分"
| 等级 Category | 类型 Type | SPEI | MI |
|---|---|---|---|
| 1 | 无旱 No drought | -0.5<SPEI | -0.40<MI |
| 2 | 轻旱 Mild drought | -1.0<SPEI≤-0.5 | -0.65<MI≤-0.40 |
| 3 | 中旱 Moderate drought | -1.5<SPEI≤-1.0 | -0.80<MI≤-0.65 |
| 4 | 重旱 Severe drought | -2.0<SPEI≤-1.5 | -0.95<MI≤-0.80 |
| 5 | 特旱 Extreme drought | SPEI≤-2.0 | MI≤-0.95 |
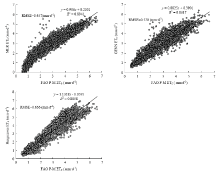
图3
输入平均气温时MLR、GRNN和Hargreaves方法模拟ET0的结果比较散点图"

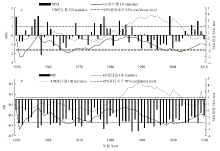
图4
1958—2018年陕西省SPEI(a)和MI(b)时间序列M-K趋势检验 UF和UB为统计量序列,用以判断时间序列变化趋势以及检查突变点。置信区间临界值为0.05"
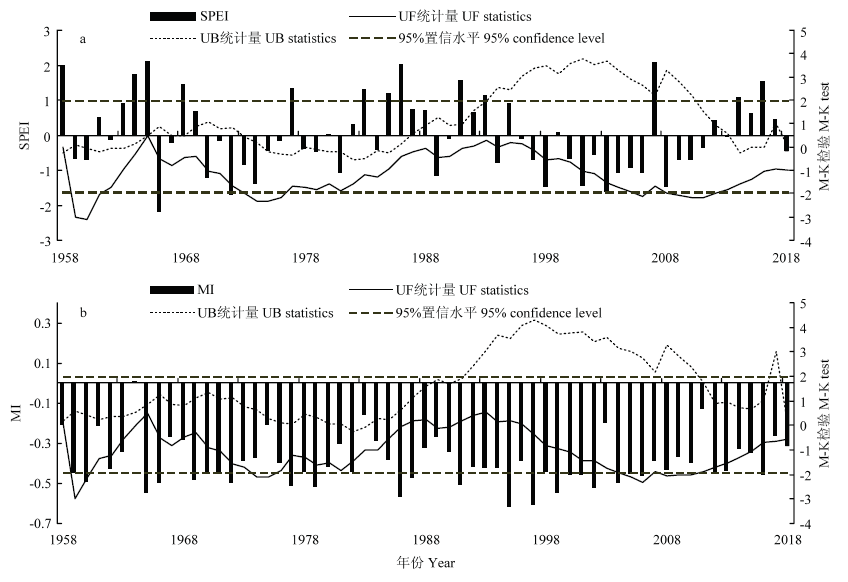
图5
分时段比较不同模式下模拟SPEI误差比较"
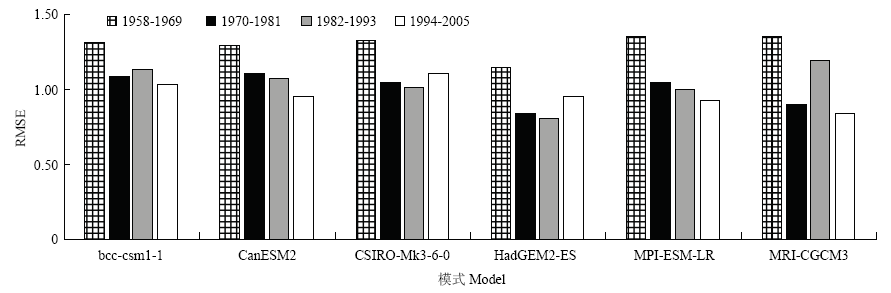
表3
HadGEM2-ES模式2006—2018年RCP2.6与RCP8.5情景下干旱指数误差比较"
| 干旱指数 Drought index | RCP情景 RCP scenario | RMSE | |||
|---|---|---|---|---|---|
| 陕北 Northern Shaanxi | 关中 Central Shaanxi plain | 陕南 Southern Shaanxi | 陕西 Shaanxi | ||
| MI | RCP2.6 | 0.306 | 0.563 | 0.378 | 0.416 |
| RCP8.5 | 0.149 | 0.309 | 0.317 | 0.258 | |
| SPEI | RCP2.6 | 0.505 | 0.720 | 0.576 | 0.596 |
| RCP8.5 | 0.427 | 0.597 | 0.563 | 0.522 | |
图6
RCP2.6情景下陕西省SPEI与MI趋势检验"
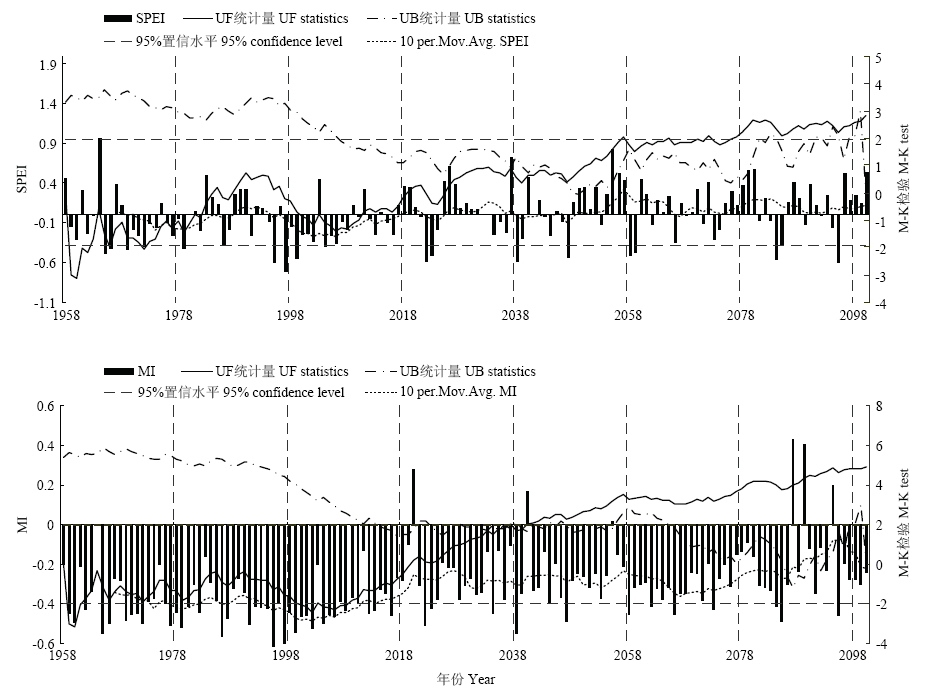
图7
RCP8.5情景下陕西省SPEI与MI趋势检验"
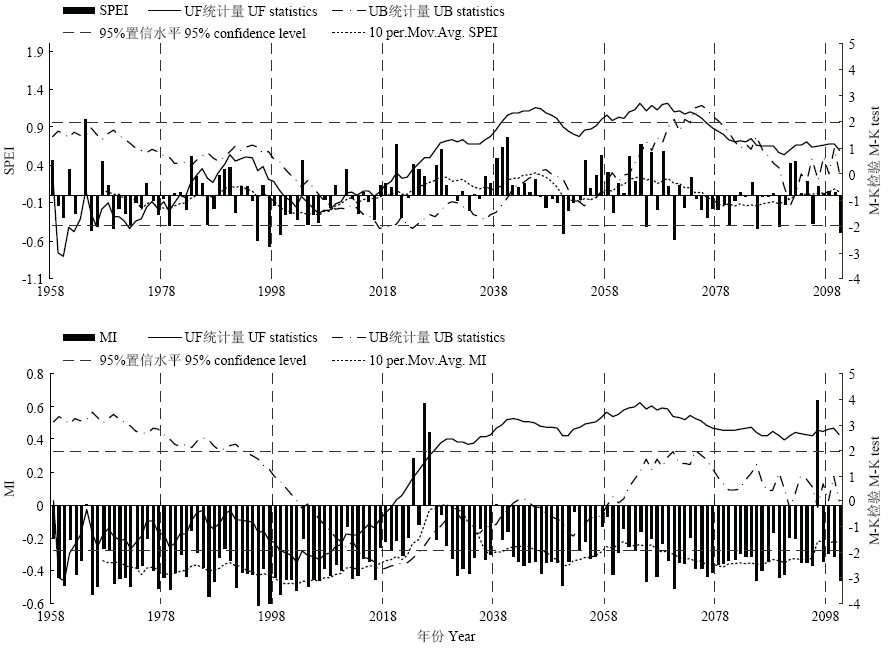
图8
不同RCP情景下陕西省1958—2100年SPEI干旱频率"
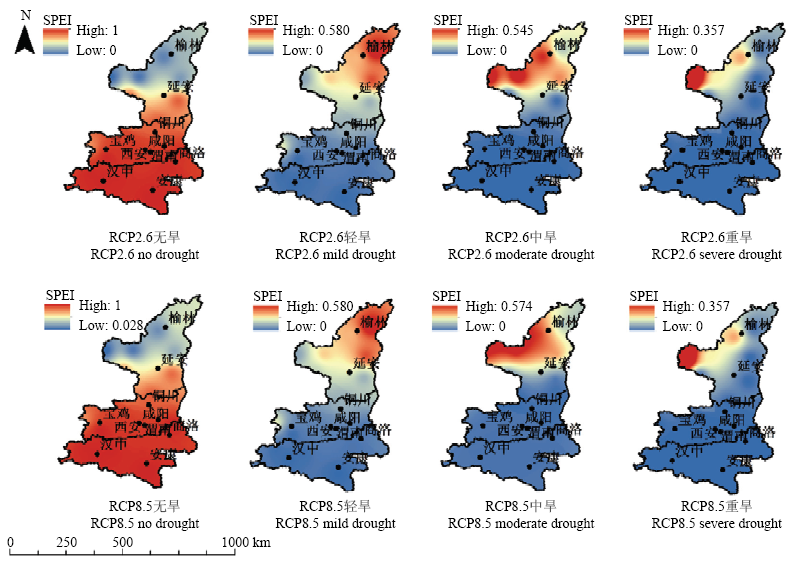

图9
不同RCP情景下陕西省1958—2100年MI干旱频率"
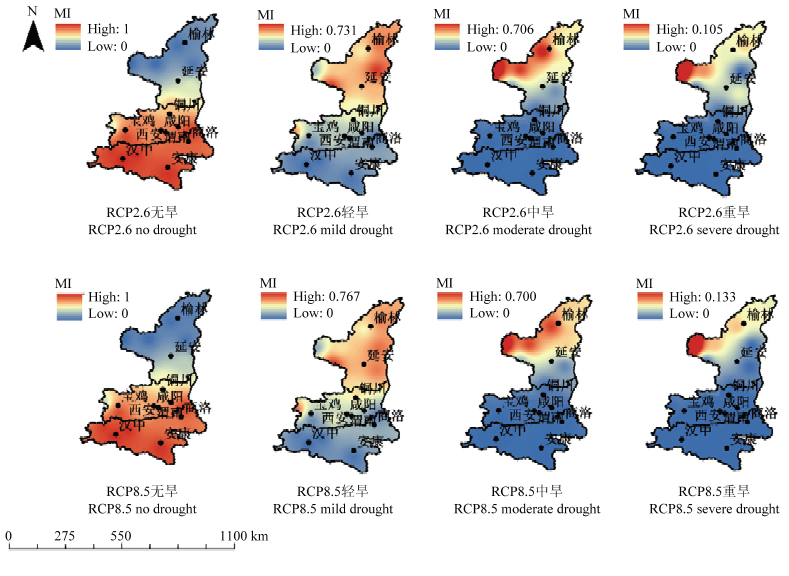
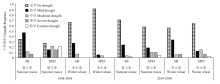
图10
陕西省冬小麦和夏玉米生长季内SPEI和MI干旱频率"

| [1] |
FOSTER T, BROZOVIC N, BUTLER A P . Why well yield matters for managing agricultural drought risk. Weather and Climate Extremes, 2015,10:11-19.
doi: 10.1016/j.wace.2015.07.003 |
| [2] |
PIAO S L, CIAIS P, HUANG Y, SHEN Z H, PENG S S, LI J S, ZHOU L P, LIU H Y, MA Y C, DING Y H, FRIEDLINGSTEIN P, LIU C Z, TAN K, YU Y Q, ZHANG T Y, FANG J Y . The impacts of climate change on water resources and agriculture in China. Nature, 2010,467(7311):43-51.
doi: 10.1038/nature09364 pmid: 20811450 |
| [3] | 李勇, 杨晓光, 代姝玮, 王文峰 . 长江中下游地区农业气候资源时空变化特征. 应用生态学报, 2010,21(11):2912-2921. |
| LI Y, YANG X G, DAI S W, WANG W F . Spatiotemporal change characteristics of agricultural climate resources in middle and lower reaches of Yangtze River. Chinese Journal of Applied Ecology, 2010,21(11):2912-2921. (in Chinese) | |
| [4] | 岳辉, 刘英 . 基于NDVI–Albedo特征空间的陕西省干旱与荒漠化遥感监测. 西北林学院学报, 2019,34(1):198-205. |
| YUE H, LIU Y . Monitoring of drought and desertification in Shaanxi Province based on NDVI-Albedo space. Journal of Northwest Forestry University, 2019,34(1):198-205. (in Chinese) | |
| [5] |
WANG L N, ZHU Q K, ZHAO W J, ZHAO X K . The drought trend and its relationship with rainfall intensity in the Loess Plateau of China. Natural Hazards, 2015,77(1):479-495.
doi: 10.1007/s11069-015-1594-0 |
| [6] | MCKEE T B, MCKEE, N J, DOESKENN J, KLEIST J . The relationship of drought frequency and duration to time scales// Proceedings of the 8th Conference on Applied Climatology, 1993: 179-184. |
| [7] |
RAYNE S, FOREST K . Evidence for increasingly variable Palmer Drought Severity Index in the United States since 1895. Science of the Total Environment, 2016,544:792-796.
doi: 10.1016/j.scitotenv.2015.11.167 pmid: 26688051 |
| [8] |
VICENTE-SERRANO S M, BEGUERÍA, SANTIAGO, LÓPEZ- MORENO J I . A Multiscalar Drought Index sensitive to global warming: The standardized precipitation evapotranspiration index. Journal of Climate, 2010,23(7):1696-1718.
doi: 10.1175/2009JCLI2909.1 |
| [9] | 赵兴凯, 李增尧, 朱清科 . 基于SPI和SPEI陕北黄土区土壤水分对气候特征的响应. 农业机械学报, 2016,47(8):155-163. |
| ZHAO X K, LI Z Y, ZHU Q K . Response of soil moisture on climate characteristics based on SPI and SPEI in loess region of Northern Shaanxi. Transactions of the Chinese Society of Agricultural Machinery, 2016,47(8):155-163. (in Chinese) | |
| [10] | 孙滨峰, 赵红, 王效科 . 基于标准化降水蒸发指数(SPEI)的东北干旱时空特征. 生态环境学报, 2015,24(1):22-28 |
| SUN B F, ZHAO H, WANG X K . Spatiotemporal characteristics of drought in northeast China based on SPEI. Ecology and Environment Sciences, 2015,24(1):22-28. (in Chinese) | |
| [11] |
ZHANG B X, ZHANG X N, JIN J M, WU P T . Development and evaluation of a physically based multiscalar drought index: The Standardized Moisture Anomaly Index. Journal of Geophysical Research: Atmospheres, 2015,120(22):11575-11588.
doi: 10.1002/2015JD023772 |
| [12] | ZHANG B X, HE C S . A modified water demand estimation method for drought identification over arid and semiarid regions. Agricultural and Forest Meteorology, 2015,230:58-66. |
| [13] | 曹兴, 万瑜, 崔玉玲, 蔡新婷, 官恒瑞, 普宗朝 . 中天山北坡近30年相对湿润指数变化趋势分析. 干旱地区农业研究, 2013,31(3):244-251. |
| CAO X, WAN Y, CUI Y L, CAI X T, GUAN H R, PU Z C . Analysis on change tendency of relative moisture index in northern piedmont of middle Tianshan mountain over recent 30 years. Agricultural Research in the Arid Areas, 2013,31(3):244-251. (in Chinese) | |
| [14] |
马柱国, 符淙斌 . 中国北方干旱区地表湿润状况的趋势分析. 气象学报, 2001,59(6):737-746.
doi: 10.11676/qxxb2001.077 |
|
MA Z, FU S B . Trend of surface humid index in the arid area of northern China. Journal of Meteorology, 2001,59(6):737-746. (in Chinese)
doi: 10.11676/qxxb2001.077 |
|
| [15] | 赵天保, 陈亮, 马柱国 . CMIP5多模式对全球典型干旱半干旱区气候变化的模拟与预估. 科学通报, 2014,59(12):1148. |
| ZHAO T B, CHEN L, MA Z G . Simulation of historical and projected climate change in arid and semiarid areas by CMIP5 models. Chinese Science Bulletin, 2014,59(12):1148. (in Chinese) | |
| [16] | 段春锋, 缪启龙, 曹雯 . 西北地区参考作物蒸散变化特征及其主要影响因素. 农业工程学报, 2011,27(8):77-83. |
| DUAN C F, MIAO Q L, CAO W . Changing characteristics of reference crop evapotranspiration and main causes in the Northwest China. Transactions of the Chinese Society of Agricultural Engineering, 2011,27(8):77-83. (in Chinese) | |
| [17] | 曹红霞, 粟晓玲, 康绍忠, 孙华银 . 陕西关中地区参考作物蒸发蒸腾量变化及原因. 农业工程学报, 2007,23(11):8-16. |
| CAO H X, SU X L, KANG S Z, SUN H Y . Changes of reference crop evapotranspiration and causes in Guanzhong Region of Shaanxi Province. Transactions of the Chinese Society of Agricultural Engineering, 2007,23(11):8-16. (in Chinese) | |
| [18] | 王升, 付镭勇, 陈洪松, 丁亚丽, 吴丽萍, 王克林 . 基于随机森林算法的参考作物蒸发蒸腾量模拟计算. 农业机械学报, 2017(3):307-314. |
| WANG S, FU Z Y, CHEN H S, DING Y L, WU L P, WANG K L . Simulation of reference evapotranspiration based on random forest method. Transactions of the Chinese Society for Agricultural Machinery, 2017(3):307-314. (in Chinese) | |
| [19] |
BROWN S J, FERRO C A T, COLLINS M H, CHUN K S, DAVID B, . Calibration strategies: A source of additional uncertainty in climate change projections. Bulletin of the American Meteorological Society, 2012,93(1):21-26.
doi: 10.1175/2011BAMS3110.1 |
| [20] | ALLEN R G, PEREIRA L S, RAES D, SMITH M . Crop evapotranspiration-guidelines for computing crop water requirements// FAO Irrigation and Drainage Paper 56. Rome: FAO, 1998,300(9):D5109. |
| [21] |
HARGREAVES G H, SAMANI Z A . Reference crop evapotranspiration from temperature. Applied Engineering in Agriculture, 1985,1(2):96-99.
doi: 10.1007/s11356-019-06419-w pmid: 31625116 |
| [22] | 冯禹, 崔宁博, 龚道枝, 胡笑涛, 张宽地 . 利用温度资料和广义回归神经网络模拟参考作物蒸散量. 农业工程学报, 2016,32(10):81-89. |
| FENG Y, CUI N B, GONG D Z, HU X T, ZHANG K D . Modeling reference evapotranspiration by generalized regression neural network combined with temperature data. Transactions of the Chinese Society of Agricultural Engineering, 2016,32(10):81-89. (in Chinese) | |
| [23] |
ANDREWS D F . A robust method for multiple linear regression. Technometrics, 1974,16(4):523-531.
doi: 10.1186/s13007-019-0520-y pmid: 31832078 |
| [24] |
HAMED K H, RAO A R . A modified Mann-Kendall trend test for autocorrelated data. Journal of Hydrology, 1998,204(1/4):182-196.
doi: 10.1016/S0022-1694(97)00125-X |
| [25] | 张洪波, 李哲浩, 席秋义, 余荧皓 . 基于改进过白化的Mann-Kendall趋势检验法. 水力发电学报, 2018,37(6):34-46. |
| ZHANG H B, LI Z H, XI Q Y, YU Y H . Modified over-whitening process and its application in Mann-Kendall trend tests. Journal of Hydroelectric Engineering, 2018,37(6):34-46. (in Chinese) | |
| [26] |
COX D R, STUART A . Some quick sign tests for trend in location and dispersion. Biometrika, 1955,42(1/2):80-95.
doi: 10.1093/biomet/42.1-2.80 |
| [27] |
BEGUERIA S , VCENTEL-SERRANO S M, REIG F. Standardized precipitation evapotranspiration index (SPEI) revisited: parameter fitting, evapotranspiration models, tools, datasets and drought monitoring. International Journal of Climatology, 2014,34(10):3001-3023.
doi: 10.1002/joc.3887 |
| [28] | MA Z G, FU C B . Interannual characteristics of the surface hydrological variables over the arid and semi-arid areas of northern China. Glob Planet Change, 2003,37:189-200. |
| [29] | 中国气象科学研究院, 国家气象中心, 中国气象局预测减灾司. 气象干旱等级:GB/T20481—2017. 北京: 中国标准出版社, 2017. |
| Chinese Academy of Meteorological Sciences, National Meteorological Centre, Division of Prediction and Disaster Reduction, China Meteorological Administration. Grades of Meteorological Drought:GB/T 20481—2017. Beijing: Standards Press of China, 2017. (in Chinese) | |
| [30] | 周丹, 张勃, 任培贵, 张春玲, 杨尚武, 季定民 . 基于标准化降水蒸散指数的陕西省近50a干旱特征分析. 自然资源学报, 2014,29(4):677-688. |
| ZHOU D, ZHANG B, REN P G, ZHANG C L, YANG S W, JI D M . Analysis of drought characteristics of Shaanxi Province in recent 50 years based on standardized precipitation evapotranspiration index. Journal of Natural Resources, 2014,29(4):677-688. (in Chinese) | |
| [31] | 高峰, 蔡万园, 张玉虎, 雷晓辉, 夏富强 . 5种CMIP5模拟降水数据在中国的适用性评估. 水土保持研究, 2017(6):123-130. |
| GAO F, CAI W Y, ZHANG Y H, LEI X H, XIA F Q . Evaluation on the applicability of 5 kinds of CMIP5 simulated precipitation data in China. Research of Soil and Water Conservation, 2017(6):123-130. | |
| [32] | 吴迪, 张海涛, 何斌, 王全九, 周蓓蓓 . 基于模糊聚类循环迭代模型的陕西省农业干旱风险评估与区划. 干旱地区农业研究, 2018,36(5):230-241. |
| WU D, ZHANG H T, HE B, WANG Q J, ZHOU P P . Assessment and zoning of agriculture drought risk based on fuzzy clustering iterative model in Shaanxi. Agricultural Research in the Arid Areas, 2018,36(5):230-241. (in Chinese) | |
| [33] |
HOOGENBOOM G, SOLER C M T, SENTELHAS P C . Application of the CSM-CERES-Maize model for planting date evaluation and yield forecasting for maize grown off-season in a subtropical environment. European Journal of Agronomy, 2007,27(2):165-177.
doi: 10.1016/j.eja.2007.03.002 |
| [34] |
徐芳平 . 关中平原冬小麦—夏玉米轮作系统生长模拟及灌溉施肥制度优化研究[D]. 杨凌: 西北农林科技大学, 2018.
doi: 10.1016/j.ijfoodmicro.2019.108471 pmid: 31841786 |
|
XU F P . Research on growth simulation of winter wheat-summer maize rotation system and optimization of the irrigation and fertilization system in the Guanzhong Plain[D]. Yangling: Northwest A&F University, 2018. (in Chinese)
doi: 10.1016/j.ijfoodmicro.2019.108471 pmid: 31841786 |
|
| [35] |
LIU X F, PAN Y Z, ZHU X F, YANG T T, BAI J J, SUN Z L . Drought evolution and its impact on the crop yield in the North China Plain. Journal of Hydrology, 2018,564:984-996.
doi: 10.1016/j.jhydrol.2018.07.077 |
| [36] | 成林, 刘荣花, 马志红 . 增温对河南省冬小麦产量的影响分析. 中国生态农业学报, 2011(4):854-859. |
| CHENG L, LIU R H, MA Z H . Influence of global warming on winter wheat yield in Henan Province. Chinese Journal of Eco-Agriculture, 2011(4):854-859. | |
| [37] |
PEÑA-GALLARDO M, VICENTE-SERRANO S M, QUIRING S, SVOBODA M, HANNAFORD J, TOMAS-BURGUERA M, MARTÍN- HERNÁNDEZ N, DOMÍNGUEZ-CASTRO F, EL K A . Response of crop yield to different time-scales of drought in the United States: Spatio-temporal patterns and climatic and environmental drivers. Agricultural and Forest Meteorology, 2019,264:40-55.
doi: 10.1016/j.agrformet.2018.09.019 |
| [38] | 莫兴国, 胡实, 卢洪健, 林忠辉, 刘苏峡 . GCM预测情景下中国21世纪干旱演变趋势分析. 自然资源学报, 2018(7):1245-1255. |
| MO X G, HU S, LU H J, LIN Z H, LIU S X . Drought trends over the terrestrial China in the 21st century in climate change scenarios with ensemble GCM projections. Journal of Natural Resources, 2018(7):1245-1255. (in Chinese) |
| [1] | 吴俊,郭大千,李果,郭熙,钟亮,朱青,国佳欣,叶英聪. 基于CARS-BPNN的江西省土壤有机碳含量高光谱预测[J]. 中国农业科学, 2022, 55(19): 3738-3750. |
| [2] | 马雨阳,官海翔,杨昊轩,邵帅,邵逸群,刘焕军. 利用地形、土壤和作物信息辅助提高东北漫岗地数字高程模型精度的新方法[J]. 中国农业科学, 2021, 54(8): 1715-1727. |
| [3] | 米晓田,石磊,何刚,王朝辉. 陕西省小农户作物生产的减肥潜力及经济效益评价[J]. 中国农业科学, 2021, 54(20): 4370-4384. |
| [4] | 邵泽中,姚青,唐健,李罕琼,杨保军,吕军,陈轶. 面向移动终端的农业害虫图像智能识别系统的研究与开发[J]. 中国农业科学, 2020, 53(16): 3257-3268. |
| [5] | 张卓,龙慧灵,王崇倡,杨贵军. 冬小麦叶片光合特征高光谱遥感估算模型的比较研究[J]. 中国农业科学, 2019, 52(4): 616-628. |
| [6] | 代红翠,张慧,薛艳芳,高英波,钱欣,赵海军,成浩,李宗新,刘开昌. 不同耕作和秸秆还田下褐土真菌群落变化特征[J]. 中国农业科学, 2019, 52(13): 2280-2294. |
| [7] | 张彪,刘璇,毕金峰,吴昕烨,金鑫,李旋,李潇. 基于BP人工神经网络算法的苹果制干适宜性评价[J]. 中国农业科学, 2019, 52(1): 129-142. |
| [8] | 张芳,未志胜,王鹏,李凯旋,詹萍,田洪磊. 基于BP神经网络和遗传算法的库尔勒香梨挥发性物质萃取条件的优化[J]. 中国农业科学, 2018, 51(23): 4535-4547. |
| [9] | 杜斌,胡笑涛,王文娥,马黎华,周始威. 交替沟灌玉米灌浆期茎流影响因子敏感性分析与模型适用性研究[J]. 中国农业科学, 2018, 51(2): 233-245. |
| [10] | 刘庆飞,张宏立,王艳玲. 基于深度可分离卷积的实时农业图像逐像素分类研究[J]. 中国农业科学, 2018, 51(19): 3673-3682. |
| [11] | 朱亚星,于雷,洪永胜,章涛,朱强,李思缔,郭力,刘家胜. 土壤有机质高光谱特征与波长变量优选方法[J]. 中国农业科学, 2017, 50(22): 4325-4337. |
| [12] | 黄亚捷,叶回春,张世文,郧文聚,黄元仿. 基于自组织特征映射神经网络的中国耕地生产力分区[J]. 中国农业科学, 2015, 48(6): 1136-1150. |
| [13] | 廖秋红,何绍兰,谢让金,钱春,胡德玉,吕强,易时来,郑永强,邓烈. 基于近红外光谱的纽荷尔脐橙产地识别研究[J]. 中国农业科学, 2015, 48(20): 4111-4119. |
| [14] | 唐俊1, 邓立苗2, 陈辉1, 栾涛1, 马文杰1. 基于机器视觉的玉米叶片透射图像特征识别研究[J]. 中国农业科学, 2014, 47(3): 431-440. |
| [15] | 杨梅花1, 2, 赵小敏1, 2, 3, 方倩1, 2, 谢碧裕1, 2. 基于可见-近红外光谱变量选择的土壤全氮含量估测研究[J]. 中国农业科学, 2014, 47(12): 2374-2383. |
|
||