


中国农业科学 ›› 2023, Vol. 56 ›› Issue (20): 4049-4066.doi: 10.3864/j.issn.0578-1752.2023.20.010
孟庆雷( ), 殷宇翔(), 王煜昊()
收稿日期:2023-05-11
接受日期:2023-06-30
出版日期:2023-10-16
发布日期:2023-10-31
通信作者:
联系方式:
孟庆雷,E-mail:277927606@qq.com。
基金资助:
MENG QingLei(), YIN YuXiang(), WANG YuHao()
Received:2023-05-11
Accepted:2023-06-30
Published:2023-10-16
Online:2023-10-31
摘要:
【目的】科学分析我国农业碳排放的时序特征、空间格局、演变模式、脱钩关系和绩效评估等问题,为助力我国实现“双碳”目标、加强建设农业强国提供依据。【方法】构建我国农业碳排放和农业碳排放绩效评估的指标体系,基于2007—2020年我国省域农业碳排放的系统测度指数,采用核密度估计和标准化椭圆可视化分析农业碳排放的区域分布特征和时空演化趋势,选用Tapio模型考察农业碳排放与经济增长之间的脱钩关系,构建非期望产出的超效率SBM模型报告我国和七大经济区的农业碳排放绩效及分解效率。【结果】2007—2020年,我国农业碳排放整体呈现先上升后下降的“倒U型”曲线,区位差异明显,等级分布稳定。东部地区减排效果最优,中部地区出现“两极化”分布,西部地区减排压力较大。空间格局整体以东北-西南方向为主导,并向东北和西北方向趋向分散化。我国农业碳排放和农业经济发展之间已保持在弱脱钩水平并向强脱钩水平突破,可划分为平稳期(2007—2016年)和突破期(2017—2020年)两个阶段。农业碳排放绩效呈现出“迅速上升-缓慢下降-平稳改善”趋势,其中大西北经济区和北部沿海经济区分别居于首位和末位,农业生产技术变化(TC)相较于技术效率变化(EC)贡献更为突出。【结论】以2017年为拐点,我国农业碳排放整体呈现下降趋势,农业经济发展整体上逐渐摆脱对农业碳排放的依赖。各区块与各省份农业基础各异、减排目标不同,需因地制宜合理规划农业比较优势产业的规模和内部结构,合理选择区域内产业的资源禀赋生产特征,同时重视技术迭代与更新在农业经济发展与节能减排之中的推动作用,兼顾地区生态效益与经济效益。
孟庆雷, 殷宇翔, 王煜昊. 我国农业碳排放的时空演化、脱钩效应及绩效评估[J]. 中国农业科学, 2023, 56(20): 4049-4066.
MENG QingLei, YIN YuXiang, WANG YuHao. Spatial-Temporal Evolution, Decoupling Effect and Performance Evaluation of China’s Agricultural Carbon Emissions[J]. Scientia Agricultura Sinica, 2023, 56(20): 4049-4066.
表1
农业碳排放指标体系"
| 类别 Category | 碳源 Carbon source | 排放系数 Emission coefficient | 排放系数来源 Source of emission coefficient |
|---|---|---|---|
| 农用物资 Agricultural material | 化肥 Chemical fertilizer (kg CE·kg-1) | 0.896 | 美国橡树岭国家实验室 Oak Ridge National Laboratory |
| 农药 Pesticide (kg CE·kg-1) | 4.934 | 美国橡树岭国家实验室 Oak Ridge National Laboratory | |
| 农膜 Agricultural film (kg CE·kg-1) | 5.180 | 南京农业大学农业资源与生态环境研究所 Institute of Resource, Ecosystem and Environment of Agriculture, Nanjing Agricultural University | |
| 农业机械 Agricultural machinery (kW·h) | 0.180 | West et al[ | |
| 农业灌溉 Agricultural irrigation | 灌溉 Irrigate (kg CE·hm-2) | 266.480 | West et al[ |
| 农业种植 Agricultural cultivation | 稻谷种植 Rice planting (g CE·m-2·d-1) | 3.136 | WANG[ |
| 复种 Multiple cropping (kg CE·hm-2) | 312.600 | 中国农业大学生物学院 College of Biological Sciences, China Agricultural University | |
| 畜牧养殖 Animal husbandry | 猪 Per pig (kg CE·a-1) | 34.091 | 联合国政府间气候变化专门委员会 IPCC |
| 牛 Per cattle (kg CE·a-1) | 415.910 | 联合国政府间气候变化专门委员会 IPCC | |
| 羊 Per sheep (kg CE·a-1) | 35.182 | 联合国政府间气候变化专门委员会 IPCC | |
| 农业能源消耗 Agricultural energy consumption | 煤炭 Coal (kg CE·kg-1) | 0.757 | 联合国政府间气候变化专门委员会 IPCC |
| 汽油 Gasoline (kg CE·kg-1) | 0.552 | 联合国政府间气候变化专门委员会 IPCC | |
| 柴油 Diesel oil (kg CE·kg-1) | 0.593 | 联合国政府间气候变化专门委员会 IPCC | |
| 电力 Electricity(kg CE·kg-1) | 1.773 | 联合国政府间气候变化专门委员会 IPCC |
表2
Tapio 8个等级与弹性值划分[34]"
| 类别 Category | 状态 State | 环境压力 EP | 经济增长 DF | 弹性 e | ||||
|---|---|---|---|---|---|---|---|---|
| 负脱钩 Negative decoupling | 扩张负脱钩 Expansion negative decoupling | >0 | >0 | e>1.2 | ||||
| 强负脱钩 Strong negative decoupling | >0 | <0 | e<0 | |||||
| 弱负脱钩 Weak negative decoupling | <0 | <0 | 0≤e<0.8 | |||||
| 脱钩 Decoupling | 弱脱钩 Weak decoupling | >0 | >0 | 0≤e<0.8 | ||||
| 强脱钩 Strong decoupling | <0 | >0 | e<0 | |||||
| 衰退脱钩 Recessive decoupling | <0 | <0 | e>1.2 | |||||
| 连接 Coupling | 扩张连接 Expansion coupling | >0 | >0 | 0.8≤e≤1.2 | ||||
| 衰退连接 Recessive coupling | <0 | <0 | 0.8≤e≤1.2 | |||||
表3
农业碳排放绩效评估体系"
| 一级指标 Level 1 indicator | 二级指标 Level 2 indicator | 变量 Variable |
|---|---|---|
| 投入 Input | 劳动力要素 Labor element | 第一产业就业人员数 Number of employees in primary industry (×104) |
| 资本要素 Capital element | 第一产业固定资产投资额 Primary industry fixed asset investment (×108 yuan) | |
| 土地要素 Land element | 农作物总播种面积 Total planting area of crops (×103 hm2) | |
| 其他要素 Other elements | 农药使用量 Pesticide usage (t) | |
| 农用薄膜使用量 Agricultural film usage (t) | ||
| 农业机械总动力 Total power of agricultural machinery (×104 kW·h) | ||
| 期望产出 Desirable output | 农业总产值 Gross value of agricultural output (×108 yuan) | - |
| 非期望产出 Undesirable output | 农业碳排放 Agricultural carbon emissions (×104 t) | - |
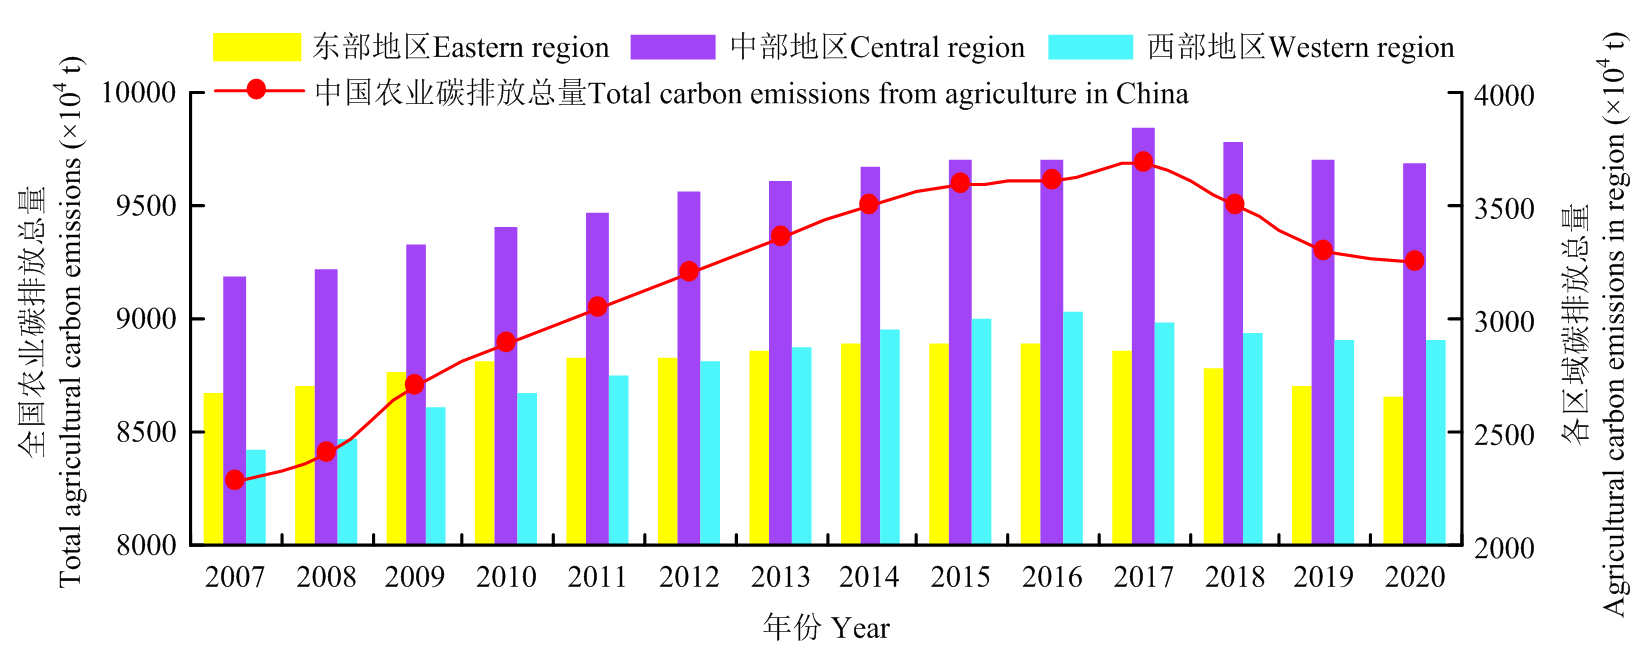
图1
2007—2020年我国农业碳排放总量及各区域农业碳排放量均值"
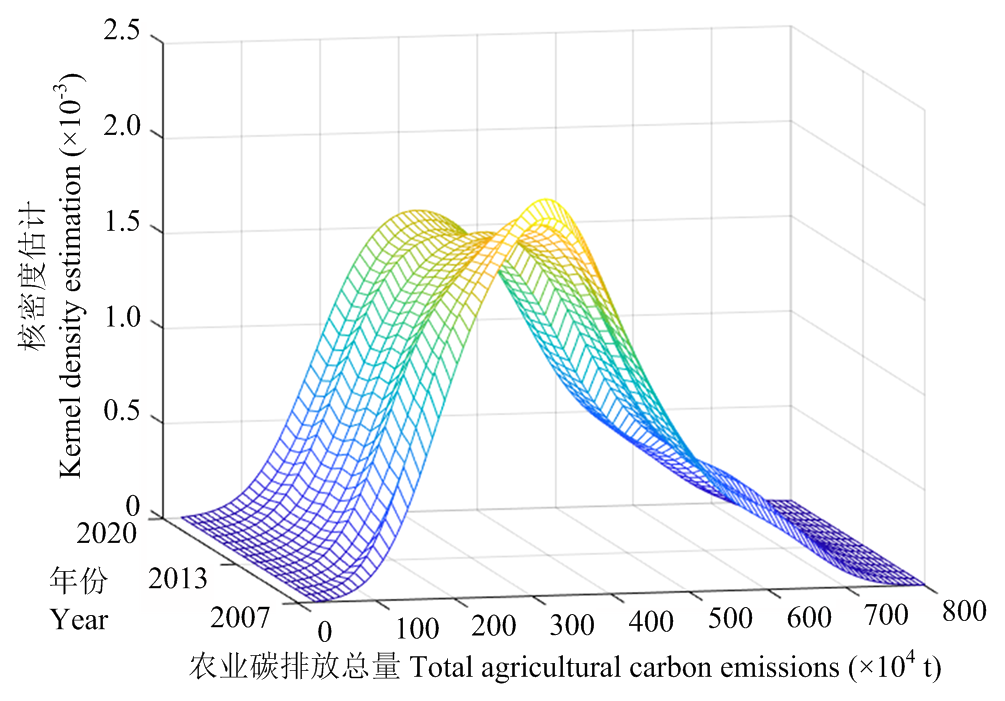
图2
全国农业碳排放总量的三维核密度估计图"

图3
我国东、中、西部农业碳排放总量的三维核密度估计图"
表4
2007—2020年我国农业碳排放标准差椭圆相关参数"
| 年份 Year | 经度 CenterX (°E) | 纬度 CenterY (°N) | 短轴 XStdDist (km) | 长轴 YStdDist (km) | 方位角 Rotation (°) | 周长 Shape-Leng (km) | 面积 Shape-Area (×104 km2) |
|---|---|---|---|---|---|---|---|
| 2007 | 113.670 | 34.711 | 856.581 | 1124.487 | 29.996 | 6252.097 | 302.585 |
| 2008 | 113.592 | 34.641 | 868.014 | 1127.473 | 29.562 | 6295.434 | 307.439 |
| 2009 | 113.528 | 34.692 | 877.827 | 1131.104 | 29.688 | 6336.250 | 311.916 |
| 2010 | 113.510 | 34.745 | 882.632 | 1134.134 | 30.048 | 6360.416 | 314.463 |
| 2011 | 113.471 | 34.779 | 888.164 | 1138.055 | 30.322 | 6389.686 | 317.528 |
| 2012 | 113.395 | 34.811 | 908.207 | 1138.908 | 30.456 | 6451.544 | 324.937 |
| 2013 | 113.358 | 34.860 | 915.593 | 1140.389 | 30.933 | 6478.282 | 328.006 |
| 2014 | 113.256 | 34.926 | 938.222 | 1140.385 | 31.412 | 6545.494 | 336.112 |
| 2015 | 113.236 | 34.957 | 941.804 | 1142.787 | 31.613 | 6564.069 | 338.105 |
| 2016 | 113.238 | 34.992 | 941.149 | 1145.643 | 31.966 | 6571.505 | 338.715 |
| 2017 | 113.453 | 35.169 | 925.936 | 1158.203 | 32.354 | 6567.766 | 336.893 |
| 2018 | 113.431 | 35.200 | 932.339 | 1158.368 | 32.892 | 6587.262 | 339.271 |
| 2019 | 113.405 | 35.227 | 936.561 | 1161.511 | 33.087 | 6610.151 | 341.732 |
| 2020 | 113.388 | 35.215 | 934.996 | 1163.445 | 33.206 | 6611.900 | 341.729 |

图4
2007—2020年我国东、中、西部农业碳排放重心转移路径"
表5
2007—2020年我国农业碳排放与农业经济发展间的脱钩关系——基于OECD脱钩评价指标"
| 年份 Year | 农业碳排放总量 Total agricultural carbon emissions, C (×104 t) | 农业碳排放指数 Agricultural carbon emission index, Cn | 农业总产值 Total agricultural output value, AGRI (×108 yuan) | 农业经济增长指数 Agricultural economic growth index, AGRIn | 脱钩指数 Decoupling index, Dn |
|---|---|---|---|---|---|
| 2007 | 8286.715 | 1.000 | 24658.091 | 1.000 | 1.000 |
| 2008 | 8400.551 | 1.014 | 28044.152 | 1.137 | 0.891 |
| 2009 | 8708.147 | 1.051 | 30611.073 | 1.241 | 0.846 |
| 2010 | 8889.450 | 1.073 | 36941.111 | 1.498 | 0.716 |
| 2011 | 9053.173 | 1.092 | 41988.638 | 1.703 | 0.642 |
| 2012 | 9206.634 | 1.111 | 46940.458 | 1.904 | 0.584 |
| 2013 | 9355.943 | 1.129 | 51497.369 | 2.088 | 0.541 |
| 2014 | 9505.084 | 1.147 | 54771.600 | 2.221 | 0.516 |
| 2015 | 9588.401 | 1.157 | 57635.797 | 2.337 | 0.495 |
| 2016 | 9612.699 | 1.160 | 59287.782 | 2.404 | 0.482 |
| 2017 | 9680.836 | 1.168 | 58059.758 | 2.355 | 0.496 |
| 2018 | 9502.133 | 1.147 | 61452.595 | 2.492 | 0.460 |
| 2019 | 9300.162 | 1.122 | 66066.451 | 2.679 | 0.419 |
| 2020 | 9253.597 | 1.117 | 71748.100 | 2.910 | 0.384 |
表6
2007—2020年我国农业碳排放与农业经济发展间的脱钩关系——基于Tapio脱钩评价指标"
| 年份 Year | ΔC/C | ΔAGRI/AGRI | 弹性值 e | 碳排放特征 Carbon emission characteristics |
|---|---|---|---|---|
| 2007 | 0.013 | 0.133 | 0.098 | 弱脱钩 Weak decoupling |
| 2008 | 0.014 | 0.121 | 0.112 | 弱脱钩 Weak decoupling |
| 2009 | 0.035 | 0.084 | 0.421 | 弱脱钩 Weak decoupling |
| 2010 | 0.020 | 0.171 | 0.119 | 弱脱钩 Weak decoupling |
| 2011 | 0.018 | 0.120 | 0.150 | 弱脱钩 Weak decoupling |
| 2012 | 0.017 | 0.105 | 0.158 | 弱脱钩 Weak decoupling |
| 2013 | 0.016 | 0.088 | 0.180 | 弱脱钩 Weak decoupling |
| 2014 | 0.016 | 0.060 | 0.262 | 弱脱钩 Weak decoupling |
| 2015 | 0.009 | 0.050 | 0.175 | 弱脱钩 Weak decoupling |
| 2016 | 0.003 | 0.028 | 0.091 | 弱脱钩 Weak decoupling |
| 2017 | 0.007 | -0.021 | -0.333 | 强负脱钩 Expansion negative decoupling |
| 2018 | -0.019 | 0.055 | -0.341 | 强脱钩 Strong decoupling |
| 2019 | -0.022 | 0.070 | -0.311 | 强脱钩 Strong decoupling |
| 2020 | -0.005 | 0.079 | -0.064 | 强脱钩 Strong decoupling |
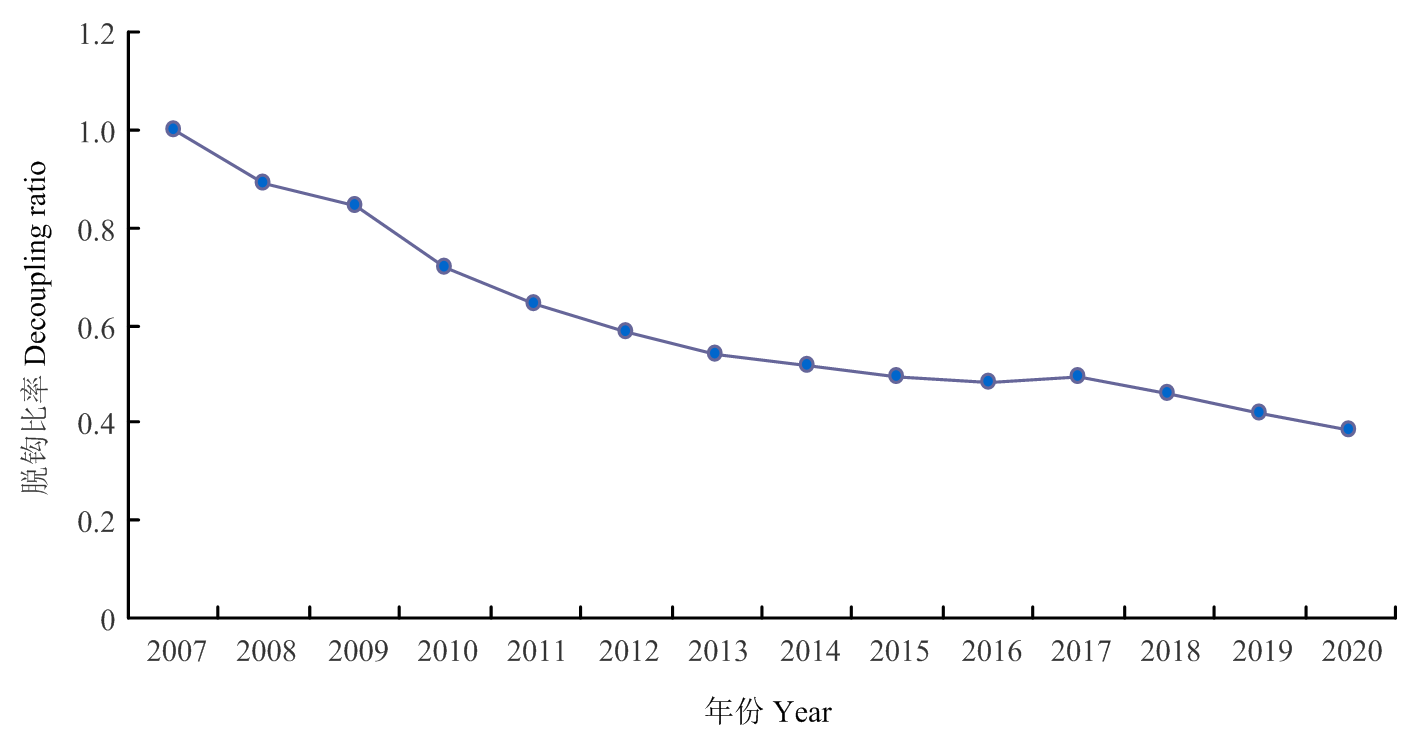
图5
我国农业碳排放与农业经济增长脱钩比率趋势图"
表7
2007—2020年我国农业碳排放绩效评估及分解"
| 年份 Year | 农业碳排放绩效 AMCPI | 技术效率变化 EC | 生产技术变化 TC |
|---|---|---|---|
| 2007-2008 | 1.017 | 0.922 | 1.068 |
| 2008-2009 | 1.006 | 1.044 | 0.995 |
| 2009-2010 | 1.176 | 1.052 | 1.185 |
| 2010-2011 | 1.117 | 1.040 | 1.125 |
| 2011-2012 | 1.027 | 0.999 | 1.120 |
| 2012-2013 | 1.027 | 1.003 | 1.103 |
| 2013-2014 | 1.011 | 0.990 | 1.072 |
| 2014-2015 | 1.008 | 0.933 | 1.093 |
| 2015-2016 | 1.020 | 1.094 | 1.012 |
| 2016-2017 | 0.997 | 1.087 | 0.927 |
| 2017-2018 | 1.035 | 1.029 | 1.118 |
| 2018-2019 | 1.136 | 1.115 | 1.349 |
| 2019-2020 | 1.045 | 1.011 | 1.073 |
表8
2007—2020年我国七大经济区农业碳排放绩效动态变化情况"
| 年份 Year | 北部沿海 North coast | 大西南 Great Southwest | 长江中游 Middle reaches of the Yangtze River | 黄河中游 Middle reaches of the Yellow River | 南部沿海 Southern coast | 东部沿海 Eastern coastal | 大西北 Great Northwest |
|---|---|---|---|---|---|---|---|
| 2007-2008 | 0.917 | 0.837 | 0.885 | 0.901 | 0.858 | 0.954 | 0.912 |
| 2008-2009 | 0.941 | 0.935 | 0.907 | 0.919 | 1.035 | 0.908 | 0.890 |
| 2009-2010 | 1.069 | 1.034 | 1.042 | 1.036 | 1.003 | 1.033 | 1.152 |
| 2010-2011 | 0.990 | 1.056 | 1.106 | 1.043 | 1.004 | 1.064 | 0.983 |
| 2011-2012 | 0.962 | 1.041 | 0.919 | 1.010 | 0.996 | 0.993 | 1.007 |
| 2012-2013 | 1.055 | 0.979 | 1.057 | 0.989 | 0.997 | 0.948 | 0.931 |
| 2013-2014 | 0.962 | 1.019 | 0.978 | 0.994 | 1.014 | 0.928 | 0.836 |
| 2014-2015 | 1.033 | 0.965 | 0.935 | 0.917 | 0.878 | 0.974 | 0.952 |
| 2015-2016 | 1.005 | 1.039 | 1.070 | 0.914 | 1.157 | 1.003 | 1.023 |
| 2016-2017 | 0.912 | 0.987 | 0.874 | 0.989 | 0.969 | 1.024 | 1.070 |
| 2017-2018 | 1.079 | 0.942 | 0.998 | 1.045 | 1.002 | 1.135 | 1.112 |
| 2018-2019 | 1.022 | 1.139 | 1.147 | 1.095 | 1.000 | 1.036 | 1.133 |
| 2019-2020 | 1.062 | 1.046 | 1.103 | 1.174 | 1.114 | 1.031 | 1.054 |
| 均值 Mean | 1.001 | 1.001 | 1.002 | 1.002 | 1.002 | 1.002 | 1.004 |
| 排名 Order | 2 | 1 | 3 | 4 | 5 | 6 | 7 |
| [1] |
国家统计局. 2021年全国农业及相关产业增加值占GDP比重为16.05%. (2022-12-30)[2023-05-10]. http://www.stats.gov.cn/xxgk/sjfb/zxfb2020/202212/t20221230_1891328.html.
|
|
National Bureau of Statistics. In 2021, the added value of agriculture and related industries accounted for 16.05% of GDP. (2022-12-30) [2023-05-10]. http://www.stats.gov.cn/xxgk/sjfb/zxfb2020/202212/t20221230_1891328.html. (in Chinese)
|
|
| [2] |
农业科技进步贡献率10年提升7个百分点——科技兴农开花结果. (2022-08-19)[2023-05-10]. http://www.kjs.moa.gov.cn/gzdt/202208/t20220819_6407317.htm.
|
|
The contribution rate of agricultural scientific and technological progress has increased by 7 percentage points in 10 years-science and technology develop rapidly. (2022-08-19)[2023-05-10]. http://www.kjs.moa.gov.cn/gzdt/202208/t20220819_6407317.htm. (in Chinese)
|
|
| [3] |
关于印发《减污降碳协同增效实施方案》的通知. (2022-06-10) [2023-05-10]. http://www.gov.cn/zhengce/zhengceku/2022-06/17/content_5696364.htm.
|
|
Notice on the issuance of the implementation plan for pollution reduction and carbon reduction synergy. (2022-06-10)[2023-05-10]. http://www.gov.cn/zhengce/zhengceku/2022-06/17/content_5696364.htm. (in Chinese)
|
|
| [4] |
国务院关于印发“十四五”推进农业农村现代化规划的通知. (2021-11-12)[2023-05-09]. http://www.gov.cn/zhengce/content/2022-02/11/content_5673082.htm.
|
|
Notice of the state council on the issuance of the 14th five-year plan for promoting agricultural and rural modernization. (2021-11-12) [2023-05-09]. http://www.gov.cn/zhengce/content/2022-02/11/content_5673082.htm. (in Chinese)
|
|
| [5] |
doi: 10.1016/S0167-8809(01)00233-X |
| [6] |
董红敏, 李玉娥, 陶秀萍, 彭小培, 李娜, 朱志平. 中国农业源温室气体排放与减排技术对策. 农业工程学报, 2008, 24(10): 269-273.
|
|
|
|
| [7] |
李波, 张俊飚, 李海鹏. 中国农业碳排放时空特征及影响因素分解. 中国人口·资源与环境, 2011, 21(8): 80-86.
|
|
|
|
| [8] |
李俊杰. 民族地区农地利用碳排放测算及影响因素研究. 中国人口·资源与环境, 2012, 22(9): 42-47.
|
|
|
|
| [9] |
刘月仙, 刘娟, 吴文良. 北京地区畜禽温室气体排放的时空变化分析. 中国生态农业学报, 2013, 21(7): 891-897.
|
|
doi: 10.3724/SP.J.1011.2013.00891 |
|
| [10] |
邵桂兰, 孔海峥, 于谨凯, 李晨. 基于LMDI法的我国海洋渔业碳排放驱动因素分解研究. 农业技术经济, 2015(6): 119-128.
|
|
|
|
| [11] |
doi: 10.1016/j.reseneeco.2009.07.001 |
| [12] |
田云, 张俊飚, 李波. 基于投入角度的农业碳排放时空特征及因素分解研究: 以湖北省为例. 农业现代化研究, 2011, 32(6): 752-755.
|
|
|
|
| [13] |
闵继胜, 胡浩. 中国农业生产温室气体排放量的测算. 中国人口·资源与环境, 2012, 22(7): 21-27.
|
|
|
|
| [14] |
戴小文. 中国农业隐含碳排放核算与分析: 兼与一般碳排放核算方法的对比. 财经科学, 2014(12): 127-136.
|
|
|
|
| [15] |
章胜勇, 尹朝静, 贺亚亚, 肖小勇. 中国农业碳排放的空间分异与动态演进: 基于空间和非参数估计方法的实证研究. 中国环境科学, 2020, 40(3): 1356-1363.
|
|
|
|
| [16] |
田云, 尹忞昊. 中国农业碳排放再测算:基本现状、动态演进及空间溢出效应. 中国农村经济, 2022(3): 104-127.
|
|
|
|
| [17] |
陈胜涛, 张开华, 张岳武. 农业碳排放绩效的测量与脱钩效应. 统计与决策, 2021, 37(22): 85-88.
|
|
|
|
| [18] |
doi: 10.1016/j.enpol.2003.10.023 |
| [19] |
doi: 10.1504/IJGEI.2002.000941 |
| [20] |
邵帅, 范美婷, 杨莉莉. 经济结构调整、绿色技术进步与中国低碳转型发展: 基于总体技术前沿和空间溢出效应视角的经验考察. 管理世界, 2022, 38(2): 46-69, 4.
|
|
|
|
| [21] |
朱洪革, 曹博, 赵文铖. 中国农业全要素碳排放绩效时序演进及空间收敛特征. 统计与决策, 2022, 38(9): 63-68.
|
|
|
|
| [22] |
周泽炯, 张葆俊, 江珂鑫, 朱家明. 绿色发展下的乡村碳排放绩效评价及随机性收敛研究: 基于SE-SBM与面板单位根检验. 哈尔滨师范大学自然科学学报, 2023, 39(1): 20-29.
|
|
|
|
| [23] |
王方怡, 洪志猛, 康智明, 兰思仁, 陈世品, 叶玉珍. 福建省农业碳排放时空变化及其驱动因素. 福建农业学报, 2019, 34(1): 124-134.
|
|
|
|
| [24] |
|
| [25] |
doi: 10.1029/90GB02311 |
| [26] |
doi: 10.1016/0167-8809(95)00613-W |
| [27] |
OECD. Indicators to Measure Decoupling of Environmental Pressures from Economic Growth. Paris: OECD, 2002.
|
| [28] |
徐卫涛, 张俊飚, 李树明, 孙笑男. 我国循环农业中的化肥施用与粮食生产脱钩研究. 农业现代化研究, 2010, 31(2): 200-203.
|
|
|
|
| [29] |
王崇梅. 中国经济增长与能源消耗脱钩分析. 中国人口·资源与环境, 2010, 20(3): 35-37.
|
|
|
|
| [30] |
李期, 郑明贵. 中国能源消耗与经济增长关系研究: 基于1996—2017年数据. 江西理工大学学报, 2019, 40(4): 57-61.
|
|
|
|
| [31] |
陈浩, 曾娟. 武汉市经济发展与能源消耗的脱钩分析. 华中农业大学学报(社会科学版), 2011(6): 90-95.
|
|
|
|
| [32] |
彭佳雯, 黄贤金, 钟太洋, 赵雲泰. 中国经济增长与能源碳排放的脱钩研究. 资源科学, 2011, 33(4): 626-633.
|
|
|
|
| [33] |
徐玥, 王辉, 韩秋凤. 徐州市农业碳排放时空特征与脱钩效应. 水土保持通报. https://doi.org/10.13961/j.cnki.stbctb.20230526.004.
|
|
|
|
| [34] |
孙耀华, 李忠民. 中国各省区经济发展与碳排放脱钩关系研究. 中国人口·资源与环境, 2011, 21(5): 87-92.
|
|
|
|
| [35] |
doi: 10.1023/A:1022857501478 |
| [36] |
程开明, 李泗娥. 全要素生产率指数:演变、比较及展望. 统计学报, 2022, 3(1): 11-26.
|
|
|
|
| [37] |
doi: 10.2307/2118443 |
| [38] |
伍国勇, 刘金丹, 杨丽莎. 中国农业碳排放强度动态演进及碳补偿潜力. 中国人口·资源与环境, 2021, 31(10): 69-78.
|
|
|
|
| [39] |
陈海韵. 环保“费改税”对环境保护效果的影响研究: 基于G省案例分析[D]. 广州: 华南理工大学, 2019.
|
|
|
|
| [40] |
薛钢, 明海蓉, 刘彦龙. 环境保护税减排治污的“倒U”效应: 基于区域征收强度的测算. 税收经济研究, 2020, 25(3): 25-34.
|
|
|
|
| [41] |
国务院关于印发全国农业现代化规划(2016—2020年)的通知.(2016-10-20) [2023-05-02]. http://www.gov.cn/zhengce/content/2016-10/20/content_5122217.htm.
|
|
Notice of the state council on issuing the national agricultural modernization plan (2016-2020). (2016-10-20)[2023-05-02]. http://www.gov.cn/zhengce/content/2016-10/20/content_5122217.htm. (in Chinese)
|
|
| [42] |
中华人民共和国土壤污染防治法. (2018-08-31)[2023-05-02] https://www.mee.gov.cn/ywgz/fgbz/fl/201809/t20180907_549845.shtml.
|
|
Law of the people's republic of China on the prevention and control of soil pollution. (2018-08-31)[2023-05-02]. https://www.mee.gov.cn/ywgz/fgbz/fl/201809/t20180907_549845.shtml. (in Chinese)
|
| [1] | 李贝, 郑家喜, 张蕙杰. 中国种植业生态效率区域差异、空间集聚与动态演进[J]. 中国农业科学, 2026, 59(3): 687-704. |
| [2] | 尹忞昊, 陈池波, 卢奕亨, 田云. 中国农业碳排放密度的时空特征、动态演进与空间效应[J]. 中国农业科学, 2025, 58(18): 3710-3727. |
| [3] | 朱庆莹, 何耿毅, 孙萍. 新旧动能转换背景下广东省耕地低碳利用效率时空演变与差异化提升路径[J]. 中国农业科学, 2025, 58(11): 2206-2224. |
| [4] | 田云, 王骁睿, 尹忞昊, 张蕙杰. 中国农业净碳汇再测算:现状特征、时空格局及其影响因素[J]. 中国农业科学, 2024, 57(22): 4507-4521. |
| [5] | 田云, 尹忞昊, 张蕙杰. 我国农村能源碳排放时空格局、影响因素及空间溢出效应[J]. 中国农业科学, 2023, 56(13): 2547-2562. |
| [6] | 田云,王梦晨. 湖北省农业碳排放效率时空差异及影响因素[J]. 中国农业科学, 2020, 53(24): 5063-5072. |
| [7] | 李波,杜建国,刘雪琪. 湖北省农业碳排放的时空特征及经济关联性[J]. 中国农业科学, 2019, 52(23): 4309-4319. |
|
||