


中国农业科学 ›› 2022, Vol. 55 ›› Issue (24): 4879-4894.doi: 10.3864/j.issn.0578-1752.2022.24.008
邓远建( ),超博()
收稿日期:2022-09-05
接受日期:2022-10-25
出版日期:2022-12-16
发布日期:2023-01-04
联系方式:
邓远建,E-mail:dyj_scga@163.com。
基金资助:
DENG YuanJian(),CHAO Bo()
Received:2022-09-05
Accepted:2022-10-25
Published:2022-12-16
Online:2023-01-04
摘要:
【目的】从灰水足迹视角评价我国省域农业生态效率,揭示农业生态效率的空间分布特征,分析影响农业生态效率的主要因素,据此提出提升我国省域农业生态效率的政策建议。【方法】利用我国2000—2019年的省级面板数据,考虑非期望产出的超效率SBM模型对我国省域农业生态效率进行综合评价,采用空间杜宾模型对农业生态效率的空间差异与影响因素进行分析。【结果】(1)总体而言,农业灰水足迹呈下降趋势,但个别省(市、区)呈上升趋势。从灰水足迹由低到高的排名可以看出,处于前列(即灰水足迹较小)的省(市、区)经济发展水平较高或农业产值占比较低;处于后列(即灰水足迹较高)的省(市、区)经济发展水平较低或农业产值占比较高。(2)观测期内,农业生态效率总体平稳,个别年份波动较大,各省(市、区)的均值差距明显且分布极不平衡。(3)经济发展水平、种植业结构、技术进步、财政支农、农业受灾率等因素对中国农业生态效率的影响程度各异。随着经济发展水平与人们生活质量的双双提升,无论是农业经营者还是消费者对农业生态环境保护和农产品质量的重视程度日益提升,在一定程度上改善了区域农业生态效率水平,但是地区经济社会发展产生的污染也可能对农业生态效率产生负面影响;财政支农的大部分资金使用在对农药、化肥和农机等生产资料的补贴上,虽然改善了农业生产条件,提高了农业经济生产力和效率,但对农业生态效率的提升效果不显著;技术的发展在农业生产过程中很重要,使用得当会提高农业生态效率;农业受灾率的估计结果未通过显著性检验,可能是因为农业受灾面积的扩大导致农业生态效率的下降,但每年的受灾情况并不具有规律性;种植业结构的系数为负,其对农业生产效率产生了负面影响,可能是因为粮食作物种植面积占作物总播种面积比例较高,且消耗的氮肥数量较多。【结论】由于我国各个省(市、区)的农业灰水足迹演变趋势和差异明显,农业生态效率整体水平不高,且各个因素对农业生态效率的影响程度不一。因此,需要健全农业灰水足迹治理机制;优化农业产业结构,建立基于灰水足迹的农业水资源保护补偿机制;完善财政支农方式和政策,引导经营主体积极提升农业生态效率。
邓远建,超博. 灰水足迹视角下我国省域农业生态效率及其影响因素[J]. 中国农业科学, 2022, 55(24): 4879-4894.
DENG YuanJian,CHAO Bo. Provincial Agricultural Ecological Efficiency and Its Influencing Factors in China from the Perspective of Grey Water Footprint[J]. Scientia Agricultura Sinica, 2022, 55(24): 4879-4894.
表1
农业生态效率评价指标体系"
| 指标类型 Index type | 指标类别 Index category | 指标名称 Index name | 指标说明 Index description |
|---|---|---|---|
| 投入指标 Input index | 资源类指标 Resource index | 劳动力投入 Labor input | 农林牧渔业从业人员(万人) Agricultural, forestry, animal husbandry and fishery employees (ten thousand people) |
| 土地投入 Land input | 农作物播种面积 Planting area of crops (×103hm2) | ||
| 化肥投入 Chemical fertilizer input | 农用化肥施用折纯量 Net amount of agricultural chemical fertilizer application (×104 t) | ||
| 农业机械投入 Agricultural machinery input | 农业机械总动力 Total power of agricultural machinery (×104 kW·h) | ||
| 灌溉投入 Irrigation input | 有效灌溉面积 Effective irrigation area (hm2) | ||
| 农膜投入 Agricultural film input | 农膜使用量 Amounts of agricultural film used (×104 t) | ||
| 农药投入 Pesticide input | 农药使用量 Amounts of pesticides used (×104 t) | ||
| 期望产出指标 Expected output index | 经济类指标 Economic index | 农业生产总值 Gross agricultural production | 农林牧渔业生产总值 Gross output value of agriculture, forestry, animal husbandry and fishery (×108 yuan) |
| 非期望产出指标 Unexpected output index | 环境类指标 Environmental index | 农业灰水足迹 Agricultural grey water footprint | 稀释农业生产活动排放的一定量的水污染物所需要的自然水体体积 Volume of natural water body required to dilute a certain amount of water pollutants discharged from agricultural production activities (m3) |
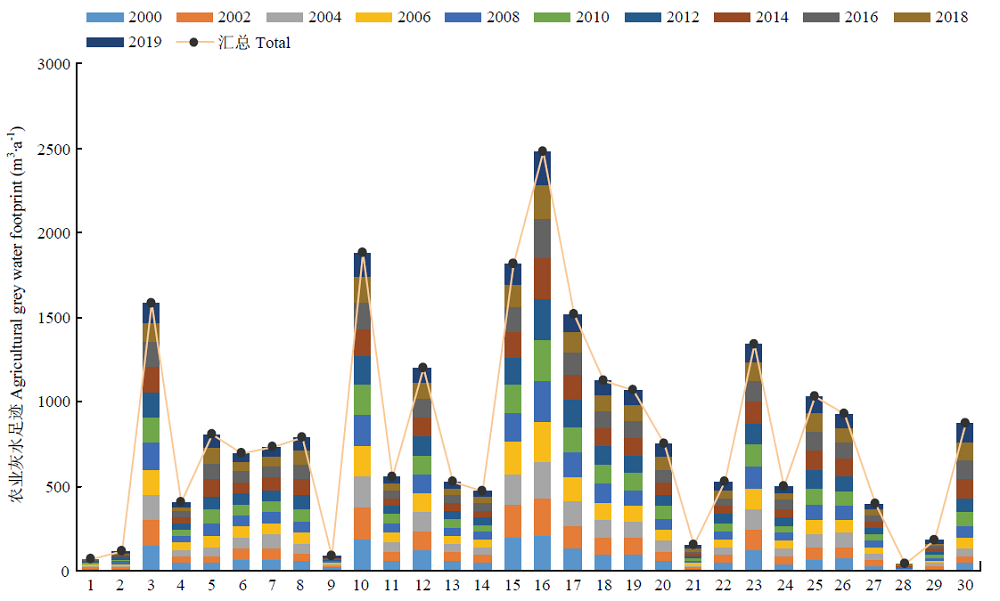
图1
2000—2019年我国30个省(市、区)农业灰水足迹测算结果 横坐标的数字1—30分别代表北京、天津、河北、山西、内蒙古、辽宁、吉林、黑龙江、上海、江苏、浙江、安徽、福建、江西、山东、河南、湖北、湖南、广东、广西、海南、重庆、四川、贵州、云南、陕西、甘肃、青海、宁夏、新疆"
表2
2000—2019年我国30个省(市、区)农业灰水足迹均值排名"
| 省域 Province | 均值与排名 Average value and ranking | |||||||
|---|---|---|---|---|---|---|---|---|
| 2000—2004年 From 2000 to 2004 | 2005—2009年 From 2005 to 2009 | 2010—2014年 From 2010 to 2014 | 2015—2019年 From 2015 to 2019 | |||||
| 排名 Ranking | 均值 Average value (m3) | 排名 Ranking | 均值 Average value (m3) | 排名 Ranking | 均值 Average value (m3) | 排名 Ranking | 均值 Average value (m3) | |
| 青海 Qinghai | 1 | 3.2 | 1 | 3.3 | 1 | 3.9 | 1 | 3.3 |
| 北京 Beijing | 2 | 8.5 | 2 | 7.2 | 3 | 5.9 | 2 | 3.4 |
| 天津 Tianjin | 3 | 10.1 | 4 | 12.2 | 4 | 10.9 | 4 | 6.6 |
| 海南 Hainan | 4 | 10.9 | 5 | 13.1 | 5 | 14.5 | 5 | 14.9 |
| 上海 Shanghai | 5 | 11.7 | 3 | 7.7 | 2 | 5.4 | 3 | 3.9 |
| 宁夏 Ningxia | 6 | 14.1 | 6 | 16.6 | 6 | 17.9 | 6 | 16.8 |
| 甘肃 Gansu | 7 | 33.8 | 7 | 37.7 | 8 | 39.8 | 8 | 34.4 |
| 山西 Shanxi | 8 | 40.7 | 8 | 40.1 | 7 | 37.2 | 7 | 26.9 |
| 贵州 Guizhou | 9 | 43.4 | 10 | 46.3 | 13 | 51.8 | 11 | 43.3 |
| 重庆 Chongqing | 10 | 45.5 | 12 | 48.8 | 12 | 49.8 | 13 | 46.4 |
| 新疆 Xinjiang | 11 | 45.9 | 18 | 69.2 | 20 | 96.4 | 24 | 110.4 |
| 江西 Jiangxi | 12 | 46.9 | 9 | 44.6 | 9 | 42.8 | 9 | 35.9 |
| 内蒙古 Neimenggu | 13 | 49.8 | 19 | 73.1 | 18 | 89.6 | 19 | 90.7 |
| 福建 Fujian | 14 | 52.3 | 11 | 48.3 | 10 | 47.3 | 12 | 43.4 |
| 黑龙江 Heilongjiang | 15 | 53.7 | 17 | 68.7 | 17 | 86.4 | 17 | 82.3 |
| 浙江 Zhejiang | 16 | 56.5 | 13 | 53.7 | 11 | 49.4 | 10 | 40.7 |
| 广西 Guangxi | 17 | 59.5 | 16 | 67.8 | 16 | 73.3 | 16 | 74.4 |
| 辽宁 Liaoning | 18 | 64.2 | 15 | 65.7 | 14 | 68.3 | 14 | 55.8 |
| 吉林 Jilin | 19 | 66.2 | 14 | 64.3 | 15 | 71.3 | 15 | 62.5 |
| 云南 Yunnan | 20 | 73.6 | 21 | 90.3 | 23 | 109.8 | 23 | 108.1 |
| 陕西 Shaanxi | 21 | 74.8 | 20 | 82.7 | 19 | 95.6 | 18 | 87.9 |
| 广东 Guangdong | 22 | 96.2 | 22 | 97.2 | 21 | 102.1 | 21 | 95.8 |
| 湖南 Hunan | 23 | 100.3 | 23 | 108.1 | 22 | 108.6 | 20 | 94.1 |
| 安徽 Anhui | 24 | 117.7 | 24 | 111.9 | 24 | 112.3 | 22 | 97.3 |
| 四川 Sichuan | 25 | 120.5 | 25 | 128.3 | 25 | 126.6 | 25 | 113.7 |
| 湖北 Hubei | 26 | 135.6 | 26 | 148.5 | 27 | 151.2 | 26 | 119.9 |
| 河北 Hebei | 27 | 149.3 | 27 | 154.1 | 26 | 150.6 | 27 | 126.6 |
| 江苏 Jiangsu | 28 | 185.5 | 28 | 176.9 | 29 | 166.9 | 29 | 149.1 |
| 山东 Shandong | 29 | 190.5 | 29 | 181.5 | 28 | 156.3 | 28 | 133.7 |
| 河南 Henan | 30 | 216.9 | 30 | 239.4 | 30 | 242.9 | 30 | 209.9 |
表3
2000—2019年我国30个省(市、区)农业生态效率测算结果"
| 省域 Province | 年份 Year | ||||||||||
|---|---|---|---|---|---|---|---|---|---|---|---|
| 2000 | 2002 | 2004 | 2006 | 2008 | 2010 | 2012 | 2014 | 2016 | 2018 | 2019 | |
| 北京 Beijing | 1.069 | 1.171 | 1.271 | 1.208 | 1.135 | 1.124 | 1.088 | 1.130 | 1.165 | 1.664 | 1.696 |
| 天津Tianjin | 1.392 | 1.315 | 1.160 | 1.198 | 1.208 | 1.149 | 1.147 | 1.136 | 1.090 | 1.014 | 1.023 |
| 河北 Hebei | 1.286 | 1.206 | 1.241 | 1.240 | 1.255 | 1.149 | 1.108 | 1.094 | 1.004 | 0.176 | 1.027 |
| 山西 Shanxi | 0.723 | 1.003 | 1.024 | 1.056 | 1.000 | 1.013 | 0.845 | 1.059 | 0.578 | 0.167 | 0.469 |
| 内蒙古 Neimenggu | 0.488 | 0.504 | 0.532 | 0.549 | 1.046 | 1.035 | 1.026 | 1.046 | 1.027 | 0.216 | 1.031 |
| 辽宁 Liaoning | 0.426 | 0.451 | 0.468 | 0.532 | 0.514 | 0.536 | 0.533 | 0.573 | 0.588 | 0.162 | 0.574 |
| 吉林 Jilin | 0.385 | 0.384 | 0.403 | 0.454 | 0.484 | 0.560 | 0.595 | 0.597 | 1.050 | 0.231 | 1.162 |
| 黑龙江 Heilongjiang | 0.447 | 0.438 | 0.450 | 0.521 | 0.542 | 1.002 | 1.042 | 1.004 | 1.111 | 0.176 | 1.126 |
| 上海 Shanghai | 1.062 | 1.037 | 0.844 | 1.102 | 1.136 | 1.257 | 1.320 | 1.155 | 1.037 | 1.025 | 1.026 |
| 江苏 Jiangsu | 0.416 | 0.406 | 0.400 | 0.410 | 0.429 | 0.452 | 0.463 | 0.507 | 0.709 | 0.144 | 0.694 |
| 浙江 Zhejiang | 1.023 | 1.007 | 0.681 | 1.001 | 0.677 | 0.681 | 0.668 | 0.665 | 0.746 | 4.036 | 0.650 |
| 安徽 Anhui | 0.527 | 0.559 | 0.584 | 0.622 | 0.605 | 0.700 | 0.717 | 0.677 | 1.080 | 0.173 | 1.024 |
| 福建 Fujian | 0.376 | 0.393 | 0.416 | 0.400 | 0.422 | 0.432 | 0.459 | 0.463 | 0.519 | 0.179 | 0.481 |
| 江西 Jiangxi | 0.279 | 0.336 | 0.433 | 0.594 | 1.002 | 1.093 | 1.106 | 0.445 | 0.567 | 0.157 | 0.620 |
| 山东 Shandong | 1.008 | 1.027 | 1.019 | 1.022 | 1.003 | 1.016 | 1.020 | 1.026 | 1.110 | 0.170 | 1.112 |
| 河南 Henan | 0.631 | 0.648 | 0.685 | 0.689 | 0.712 | 0.705 | 0.728 | 0.750 | 1.024 | 0.147 | 0.831 |
| 湖北 Hubei | 0.315 | 0.337 | 0.347 | 0.422 | 0.450 | 0.509 | 0.532 | 0.562 | 0.662 | 0.144 | 0.667 |
| 湖南 Hunan | 0.449 | 0.475 | 0.506 | 0.557 | 0.598 | 0.641 | 0.674 | 0.705 | 1.081 | 0.185 | 1.031 |
| 广东 Guangdong | 0.463 | 0.402 | 0.398 | 0.376 | 0.374 | 0.405 | 0.421 | 0.440 | 0.489 | 0.120 | 0.474 |
| 广西 Guangxi | 0.422 | 0.440 | 0.449 | 0.413 | 0.450 | 0.502 | 0.540 | 0.568 | 1.018 | 0.154 | 1.014 |
| 海南 Hainan | 1.089 | 1.005 | 1.012 | 1.008 | 1.015 | 1.017 | 1.030 | 0.759 | 1.039 | 0.456 | 1.066 |
| 重庆 Chongqing | 0.304 | 0.349 | 0.388 | 0.403 | 0.404 | 0.445 | 0.444 | 0.475 | 0.596 | 0.214 | 0.622 |
| 四川 Sichuan | 0.296 | 0.312 | 0.331 | 0.370 | 0.348 | 0.426 | 0.462 | 0.447 | 0.586 | 0.117 | 0.595 |
| 贵州 Guizhou | 0.292 | 0.332 | 0.385 | 0.542 | 0.520 | 0.613 | 0.537 | 0.620 | 0.601 | 0.170 | 1.007 |
| 云南 Yunnan | 0.357 | 0.371 | 0.387 | 0.393 | 0.417 | 0.502 | 0.491 | 0.492 | 0.674 | 0.123 | 0.471 |
| 陕西 Shaanxi | 0.342 | 0.374 | 0.405 | 0.424 | 0.445 | 0.486 | 0.524 | 0.543 | 0.583 | 0.160 | 0.577 |
| 甘肃 Gansu | 0.484 | 0.510 | 0.539 | 0.533 | 0.555 | 0.616 | 0.660 | 0.663 | 0.646 | 0.192 | 0.673 |
| 青海 Qinghai | 1.868 | 1.773 | 1.588 | 1.702 | 1.503 | 1.397 | 1.598 | 1.054 | 1.024 | 1.035 | 1.061 |
| 宁夏 Ningxia | 0.682 | 1.002 | 1.005 | 1.012 | 0.805 | 1.007 | 1.033 | 1.026 | 0.776 | 1.007 | 1.014 |
| 新疆 Xinjiang | 0.357 | 0.371 | 0.383 | 0.403 | 0.415 | 0.508 | 0.528 | 0.369 | 0.503 | 0.144 | 0.485 |
表4
2000—2019年我国30个省(市、区)农业生态效率的均值"
| 省域 Province | 平均值 Average value | 排序 Ranking | 省域 Province | 平均值 Average value | 排序 Ranking | |
|---|---|---|---|---|---|---|
| 北京 Beijing | 1.2263 | 1 | 甘肃 Gansu | 0.5466 | 16 | |
| 天津 Tianjin | 1.1727 | 2 | 吉林 Jilin | 0.5260 | 17 | |
| 上海 Shanghai | 1.0948 | 3 | 广西 Guangxi | 0.5009 | 18 | |
| 河北 Hebei | 1.0699 | 4 | 贵州 Guizhou | 0.4984 | 19 | |
| 宁夏 Ningxia | 0.9501 | 5 | 辽宁 Liaoning | 0.4831 | 20 | |
| 山东 Shandong | 0.9433 | 6 | 青海 Qinghai | 0.4423 | 21 | |
| 海南 Hainan | 0.9273 | 7 | 江苏 Jiangsu | 0.4355 | 22 | |
| 浙江 Zhejiang | 0.9058 | 8 | 陕西 Shaanxi | 0.4345 | 23 | |
| 山西 Shanxi | 0.8491 | 9 | 湖北 Hubei | 0.4329 | 24 | |
| 内蒙古 Neimenggu | 0.7482 | 10 | 云南 Yunnan | 0.4137 | 25 | |
| 河南 Henan | 0.7032 | 11 | 重庆 Chongqing | 0.4096 | 26 | |
| 黑龙江 Heilongjiang | 0.6637 | 12 | 福建 Fujian | 0.4084 | 27 | |
| 安徽 Anhui | 0.6268 | 13 | 新疆 Xinjiang | 0.3917 | 28 | |
| 湖南 Hunan | 0.5907 | 14 | 广东 Guangdong | 0.3914 | 29 | |
| 江西 Jiangxi | 0.5871 | 15 | 四川 Sichuan | 0.3779 | 30 |
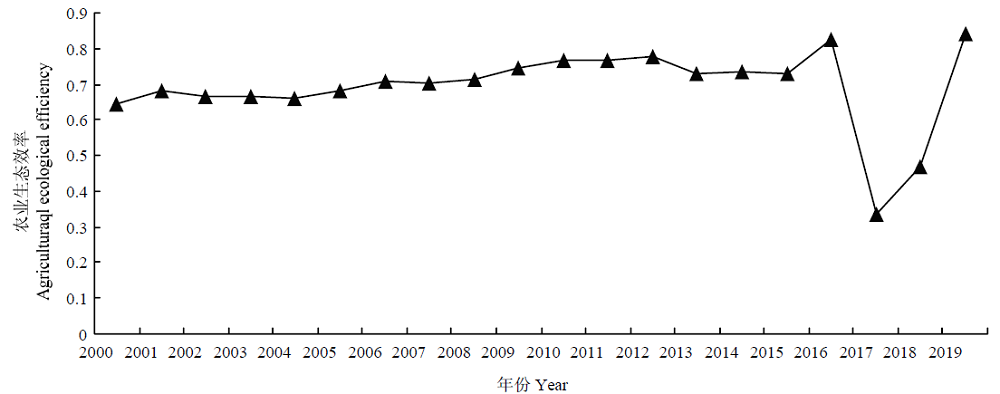
图2
全国农业生态效率变化趋势图"
表5
2000—2019年我国30个省(市、区)农业生态效率Moran’s I统计值"
| 年份Year | 莫兰值Morans’I | P值P value | Z值Z value | 年份Year | 莫兰值Morans’I | P值P value | Z值Z value | |
|---|---|---|---|---|---|---|---|---|
| 2000 | 0.135 | 0.009 | 2.387 | 2010 | 0.204 | 0.001 | 3.210 | |
| 2001 | 0.133 | 0.006 | 2.496 | 2011 | 0.227 | 0.000 | 3.519 | |
| 2002 | 0.151 | 0.005 | 2.577 | 2012 | 0.211 | 0.000 | 3.365 | |
| 2003 | 0.197 | 0.001 | 3.176 | 2013 | 0.154 | 0.006 | 2.536 | |
| 2004 | 0.191 | 0.001 | 3.110 | 2014 | 0.179 | 0.002 | 2.868 | |
| 2005 | 0.175 | 0.002 | 2.879 | 2015 | 0.191 | 0.001 | 3.028 | |
| 2006 | 0.154 | 0.005 | 2.610 | 2016 | 0.075 | 0.071 | 1.465 | |
| 2007 | 0.169 | 0.003 | 2.792 | 2017 | 0.034 | 0.164 | 0.980 | |
| 2008 | 0.185 | 0.001 | 2.981 | 2018 | 0.012 | 0.329 | 0.433 | |
| 2009 | 0.206 | 0.001 | 3.282 | 2019 | 0.132 | 0.010 | 2.310 |
表6
我国农业生态效率的聚集类型表"
| 年份 Year | 高-高集群 High-High cluster | 高-低集群 High-Low cluster | 低-低集群 Low-Low cluster | 低异常值 Low outlier |
|---|---|---|---|---|
| 2000 | 北京、天津、河北 Beijing, Tianjin, Hebei | 青海 Qinghai | 贵州、重庆 Guizhou, Chongqing | 新疆 Xinjiang |
| 2004 | 北京、天津、河北 Beijing, Tianjin, Hebei | 青海、海南 Qinghai, Hainan | 新疆 Xinjiang | |
| 2009 | 内蒙古、北京、天津、河北 Neimenggu, Beijing,Tianjin, Hebei | 青海 Qinghai | 重庆 Chongqing | 新疆 Xinjiang |
| 2014 | 内蒙古、北京、天津、河北、山东、山西 Neimenggu, Beijing, Tianjin, Hebei, Shandong, Shanxi | 广东、重庆 Guangdong, Chongqing | 辽宁 Liaoning | |
| 2019 | 北京 Beijing | 辽宁 Liaoning |
表7
农业生态效率的影响因素"
| 因变量 Dependent variable | 符号 Symbol | 变量解释 Interpretation of variables |
|---|---|---|
| 人均收入 Per capita income | RCI | 农村居民人均可支配收入 Per capita disposable income of rural residents |
| 财政支农支出 Fiscal expenditure on supporting agriculture | AFI | 地方财政农林水事务支出/地方财政一般预算支出 Amount of agricultural, forestry and water affairs expenditure in local fiscal expenditure/ General budget expenditure of local finance (%) |
| 技术水平 Technical level | TI | R&D投入/地方财政一般预算支出 R&D input/ General budget expenditure of local finance (%) |
| 经济发展水平 Economic development level | LED | 地区人均GDP Regional per capita GDP |
| 农业受灾率 Agricultural disaster rate | RDR | 农作物受灾面积/农作物总播种面积 Area affected by crops/ Total sown area of crops (%) |
| 种植业结构 Planting structure | CS | 粮食作物种植面积/农作物总播种面积 Grain crop planting area/ Total sown area of crops (%) |
表8
变量的描述性统计"
| 变量名称 Variable name | 均值 Average value | 标准差 Standard deviation | 最小值 Minimum | 最大值 Maximum | 样本数 Number of samples |
|---|---|---|---|---|---|
| ECOE | 0.69 | 0.38 | 0.11 | 4.04 | 600 |
| RCI | 7.8e | 7.4e | 1.41 | 1.3e | 600 |
| AFI | 274.95 | 279.87 | 2.14 | 1.3e | 600 |
| TI | 6.5e | 7.4e | 80.91 | 4.4e | 600 |
| LED | 0.92 | 0.46 | 0.05 | 2.71 | 600 |
| RDR | 0.23 | 0.16 | 0.00 | 0.94 | 600 |
| CS | 0.53 | 0.09 | 0.34 | 0.75 | 600 |
表9
农业生态效率影响因素的回归结果"
| ECOE (1) | ECOE (2) | ECOE (3) | ECOE (4) | |
|---|---|---|---|---|
| RCIit | -0.242*** (-2.741) | -0.325*** (-2.735) | -0.317** (-2.352) | -0.296** (-2.173) |
| RCI2it | 2.351*** (4.812) | 1.869*** (3.551) | 1.662*** (3.129) | 1.386*** (2.875) |
| LEDit | -4.18* (-2.13) | 0.000* (0.263) | ||
| CSit | -0.065* (-2.04) | 4.189* (1.493) | ||
| AFIit | 0.002** (2.346) | -0.001** (-2.097) | ||
| TIit | 3.88e** (0.001) | 0.179** (2.013) | ||
| RDRit | -0.085 (-1.02) | -6.251 (-3.276) | ||
| _cons | -0.233** (-2.152) | -0.128** (-2.637) | 0.318* (1.851) | 0.394* (1.727) |
| R2 | 0.166 | 0.168 | 0.163 | 0.167 |
| 控制时间Control time | 不控制Out of control | 不控制Out of control | 不控制Out of control | 控制control |
| 控制省份Control the provinces | 不控制Out of control | 控制control | 不控制Out of control | 控制control |
| 样本数 Number of samples | 600 | 600 | 600 | 600 |
| 拐点 Inflection point | 0.593 | 0.577 | 0.561 | 0.558 |
表10
各因素对我国农业生态效率的分样本估计结果"
| 区域 Region | 解释变量 Explanatory variable | 系数 Coefficient | 区域 Region | 解释变量 Explanatory variable | 系数 Coefficient | |
|---|---|---|---|---|---|---|
| 东北地区 Northeast region | RCIit | -0.103* | 中部地区 Central region | RCIit | -0.034** | |
| RCIit2 | 2.108** | RCIit2 | 1.552* | |||
| LEDit | -0.005** | LEDit | -0.213*** | |||
| CSit | -0.461** | CSit | -0.245* | |||
| AFIit | -0.121* | AFIit | -0.314* | |||
| TIit | 0.231** | TIit | 0.125** | |||
| RDRit | -0.424 | RDRit | -0.081 | |||
| 东部地区 Eastern region | RCIit | -0.191* | 西部地区 Western region | RCIit | -0.112* | |
| RCIit2 | 1.976* | RCIit2 | 1.495** | |||
| LEDit | -0.001** | LEDit | -0.006** | |||
| CSit | -0.524** | CSit | -0.032** | |||
| AFIit | -0.137** | AFIit | 0.046** | |||
| TIit | 0.172* | TIit | 0.087* | |||
| RDRit | -0.315 | RDRit | -0.631 |
| [1] | 前瞻产业研究院. 2017-2022年中国农村污水处理行业发展前景预测与投资战略规划分析报告. https://bg.qianzhan.com/trends/detail/506/220808-ac1fce40.html. |
| Prospective Industry Research Institute. Report of prospect and investment strategy planning analysis on China rural sewage treatment industry(2017-2022). https://bg.qianzhan.com/trends/detail/506/220808-ac1fce40.html. (in Chinese) | |
| [2] | 开燕华, 王霞, 曾铖. 长三角城市群现代农业发展效率评价: 考虑社会和工程功能的PCA-DEA模型的研究. 经济问题探索, 2018(6): 155-163. |
| KAI Y H, WANG X, ZENG C. Evaluation of modern agriculture of the Yangtze River Delta City group considering social and engineering functions based on PCA-DEA model. Inquiry into Economic Issues, 2018(6): 155-163. (in Chinese) | |
| [3] |
汪言在, 刘大伟. 纳入气候要素的重庆市农业全要素生产率增长时空分布分析. 地理科学, 2017, 37(12): 1942-1952. doi:10.13249/j.cnki.sgs.2017.12.019.
doi: 10.13249/j.cnki.sgs.2017.12.019 |
|
WANG Y Z, LIU D W. Spatial and temporal changes of total factor productivity in agriculture of Chongqing under constraints of climatic factors. Scientia Geographica Sinica, 2017, 37(12): 1942-1952. doi:10.13249/j.cnki.sgs.2017.12.019. (in Chinese)
doi: 10.13249/j.cnki.sgs.2017.12.019 |
|
| [4] | 苏昕, 刘昊龙. 农村劳动力转移背景下农业合作经营对农业生产效率的影响. 中国农村经济, 2017(5): 58-72. |
| SU X, LIU H L. The effects of farmers' specialized cooperatives on agricultural production efficiency within the context of rural labor migration. Chinese Rural Economy, 2017(5): 58-72. (in Chinese) | |
| [5] |
郑德凤, 郝帅, 孙才志. 基于DEA-ESDA的农业生态效率评价及时空分异研究. 地理科学, 2018, 38(3): 419-427. doi:10.13249/j.cnki.sgs.2018.03.012.
doi: 10.13249/j.cnki.sgs.2018.03.012 |
|
ZHENG D F, HAO S, SUN C Z. Evaluation of agricultural ecological efficiency and its spatial-temporal differentiation based on DEA- ESDA. Scientia Geographica Sinica, 2018, 38(3): 419-427. doi:10.13249/j.cnki.sgs.2018.03.012. (in Chinese)
doi: 10.13249/j.cnki.sgs.2018.03.012 |
|
| [6] |
黄玛兰, 曾琳琳, 李晓云. LCA和DEA法相结合的农业生态效率研究: 兼顾绿色认知和环境规制的影响. 华中农业大学学报(社会科学版), 2022(1): 94-104. doi:10.13300/j.cnki.hnwkxb.2022.01.010.
doi: 10.13300/j.cnki.hnwkxb.2022.01.010 |
|
HUANG M L, ZENG L L, LI X Y. Joint life cycle assessment and data envelopment analysis for assessing agriculture eco-efficiency— considering the impacts of green cognition and government regulations. Journal of Huazhong Agricultural University (Social Sciences Edition), 2022(1): 94-104. doi:10.13300/j.cnki.hnwkxb.2022.01.010. (in Chinese)
doi: 10.13300/j.cnki.hnwkxb.2022.01.010 |
|
| [7] | 赵吉, 党国英, 唐夏俊. 基于SBM-Tobit模型的中国农业生态效率时空差异及影响因素研究. 西南林业大学学报(社会科学), 2022, 6(3): 10-18. |
| ZHAO J, DANG G Y, TANG X J. Spatial-temporal differences and influencing factors of agricultural eco-efficiency in China based on SBM-Tobit model. Journal of Southwest Forestry University (Social Sciences), 2022, 6(3): 10-18. (in Chinese) | |
| [8] |
陈菁泉, 信猛, 马晓君, 常百舒, 张紫嫣. 中国农业生态效率测度与驱动因素. 中国环境科学, 2020, 40(7): 3216-3227. doi:10.19674/j.cnki.issn1000-6923.2020.0360.
doi: 10.19674/j.cnki.issn1000-6923.2020.0360 |
|
CHEN J Q, XIN M, MA X J, CHANG B S, ZHANG Z Y. Chinese agricultural eco-efficiency measurement and driving factors. China Environmental Science, 2020, 40(7): 3216-3227. doi:10.19674/j.cnki.issn1000-6923.2020.0360. (in Chinese)
doi: 10.19674/j.cnki.issn1000-6923.2020.0360 |
|
| [9] |
张展, 廖小平, 李春华, 杨灿, 阳莎莎, 李伊涵. 湖南省县域农业生态效率的时空特征及其影响因素. 经济地理, 2022, 42(2): 181-189. doi:10.15957/j.cnki.jjdl.2022.02.020.
doi: 10.15957/j.cnki.jjdl.2022.02.020 |
|
ZHANG Z, LIAO X P, LI C H, YANG C, YANG S S, LI Y H. Spatio-temporal characteristics of agricultural eco-efficiency and its determinants in Hunan Province. Economic Geography, 2022, 42(2): 181-189. doi:10.15957/j.cnki.jjdl.2022.02.020. (in Chinese)
doi: 10.15957/j.cnki.jjdl.2022.02.020 |
|
| [10] |
舒晓波, 冯维祥, 廖富强, 凌春园. 长江中游城市群农业生态效率时空演变及驱动因子研究. 水土保持研究, 2022, 29(1): 394-403. doi:10.13869/j.cnki.rswc.2022.01.043.
doi: 10.13869/j.cnki.rswc.2022.01.043 |
|
SHU X B, FENG W X, LIAO F Q, LING C Y. Study on the spatiotemporal evolution and driving factors of agricultural eco- efficiency of urban agglomeration in the middle reaches of the Yangtze River. Research of Soil and Water Conservation, 2022, 29(1): 394-403. doi:10.13869/j.cnki.rswc.2022.01.043. (in Chinese)
doi: 10.13869/j.cnki.rswc.2022.01.043 |
|
| [11] | 侯孟阳, 姚顺波. 空间视角下中国农业生态效率的收敛性与分异特征. 中国人口·资源与环境, 2019, 29(4): 116-126. |
| HOU M Y, YAO S B. Convergence and differentiation characteristics on agro-ecological efficiency in China from a spatial perspective. China Population, Resources and Environment, 2019, 29(4): 116-126. (in Chinese) | |
| [12] |
韩琴, 孙才志, 邹玮. 1998—2012年中国省际灰水足迹效率测度与驱动模式分析. 资源科学, 2016, 38(6): 1179-1191.
doi: 10.18402/resci.2016.06.17 |
|
HAN Q, SUN C Z, ZOU W. Grey water footprint efficiency measure and its driving pattern analysis on provincial scale in China from 1998 to 2012. Resources Science, 2016, 38(6): 1179-1191. (in Chinese)
doi: 10.18402/resci.2016.06.17 |
|
| [13] |
程鹏, 李叙勇, 孙明东. 基于河流参照状态的季风区域季节性农业灰水足迹核算方法与例证. 环境科学学报, 2020, 40(9): 3453-3462. doi:10.13671/j.hjkxxb.2020.0142.
doi: 10.13671/j.hjkxxb.2020.0142 |
|
CHENG P, LI X Y, SUN M D. Calculation method and illustration of seasonal agricultural grey water footprint in monsoon region based on river reference conditions. Acta Scientiae Circumstantiae, 2020, 40(9): 3453-3462. doi:10.13671/j.hjkxxb.2020.0142. (in Chinese)
doi: 10.13671/j.hjkxxb.2020.0142 |
|
| [14] |
何立新, 练继建, 王书吉. 河北省主要农作物2005—2014年灰水足迹变化. 水利水电技术, 2016, 47(12): 143-148. doi:10.13928/j.cnki.wrahe.2016.12.030.
doi: 10.13928/j.cnki.wrahe.2016.12.030 |
|
HE L X, LIAN J J, WANG S J. Variation of grey water footprint of main crops in Hebei Province from 2005 to 2014. Water Resources and Hydropower Engineering, 2016, 47(12): 143-148. doi:10.13928/j.cnki.wrahe.2016.12.030. (in Chinese)
doi: 10.13928/j.cnki.wrahe.2016.12.030 |
|
| [15] |
CHAPAGAIN A K, HOEKSTRA A Y. The global component of freshwater demand and supply: an assessment of virtual water flows between nations as a result of trade in agricultural and industrial products. Water International, 2008, 33(1): 19-32. doi:10.1080/02508060801927812.
doi: 10.1080/02508060801927812 |
| [16] | HOEKSTRA A Y. Virtual water trade: proceedings of the international expert meeting on virtual water trade. Delft, Netherlands: IHE, 2003: 13-23. |
| [17] |
BECKEN S. Water equity - Contrasting tourism water use with that of the local community. Water Resources and Industry, 2014, 7/8: 9-22. doi:10.1016/j.wri.2014.09.002.
doi: 10.1016/j.wri.2014.09.002 |
| [18] |
MEKONNEN M M, HOEKSTRA A Y. A global assessment of the water footprint of farm animal products. Ecosystems, 2012, 15(3): 401-415. doi:10.1007/s10021-011-9517-8.
doi: 10.1007/s10021-011-9517-8 |
| [19] |
王圣云, 林玉娟. 中国区域农业生态效率空间演化及其驱动因素: 水足迹与灰水足迹视角. 地理科学, 2021, 41(2): 290-301. doi:10.13249/j.cnki.sgs.2021.02.012.
doi: 10.13249/j.cnki.sgs.2021.02.012 |
|
WANG S Y, LIN Y J. Spatial evolution and its drivers of regional agro-ecological efficiency in China's from the perspective of water footprint and gray water footprint. Scientia Geographica Sinica, 2021, 41(2): 290-301. doi:10.13249/j.cnki.sgs.2021.02.012. (in Chinese)
doi: 10.13249/j.cnki.sgs.2021.02.012 |
|
| [20] | 付永虎, 刘铁, 刘俊青, 胡晗, 魏范青. 基于灰水足迹的粮食主产区农业环境效率与水环境可持续性测度与评估. 中国农业资源与区划, 2021, 42(1): 77-87. |
| FU Y H, LIU T, LIU J Q, HU H, WEI F Q. Measurement and evaluation of agricultural environmental efficiency and environmental sustainability for water in the major grain-producing area based on grey water footprint. Chinese Journal of Agricultural Resources and Regional Planning, 2021, 42(1): 77-87. (in Chinese) | |
| [21] |
欧阳佚亭, 宋国宝, 陈景文, 张树深. 中国淡水池塘养殖鱼类排污的灰水足迹及污染负荷研究. 环境污染与防治, 2018, 40(3): 317-322, 328. doi:10.15985/j.cnki.1001-3865.2018.03.016.
doi: 10.15985/j.cnki.1001-3865.2018.03.016 |
|
OUYANG Y T, SONG G B, CHEN J W, ZHANG S S. Grey water footprint and pollution loadings of freshwater pond-cultured fish in China. Environmental Pollution & Control, 2018, 40(3): 317-322, 328. doi:10.15985/j.cnki.1001-3865.2018.03.016. (in Chinese)
doi: 10.15985/j.cnki.1001-3865.2018.03.016 |
|
| [22] |
TONE K. A slacks-based measure of efficiency in data envelopment analysis. European Journal of Operational Research, 2001, 130(3): 498-509. doi:10.1016/S0377-2217(99)00407-5.
doi: 10.1016/S0377-2217(99)00407-5 |
| [23] |
TONE K. A slacks-based measure of super-efficiency in data envelopment analysis. European Journal of Operational Research, 2002, 143(1): 32-41. doi:10.1016/S0377-2217(01)00324-1.
doi: 10.1016/S0377-2217(01)00324-1 |
| [24] | 华春林, 张玖弘, 金书秦. 基于文本量化的中国农业面源污染治理政策演进特征分析. 中国农业科学, 2022, 55(7): 1385-1398. |
| HUA C L, ZHANG J H, JIN S Q. Analysis to evolution characteristics of policies for controlling agricultural non-point source pollution in China: based on text quantification. Scientia Agricultura Sinica, 2022, 55(7): 1385-1398. (in Chinese) | |
| [25] | 张子龙, 薛冰, 陈兴鹏, 李勇进. 中国工业环境效率及其空间差异的收敛性. 中国人口·资源与环境, 2015, 25(2): 30-38. |
| ZHANG Z L, XUE B, CHEN X P, LI Y J. Convergence in spatial difference of industrial environmental efficiency in China. China Population, Resources and Environment, 2015, 25(2): 30-38. (in Chinese) | |
| [26] | 王宝义, 张卫国. 中国农业生态效率测度及时空差异研究. 中国人口·资源与环境, 2016, 26(6): 11-19. |
| WANG B Y, ZHANG W G. A research of agricultural eco-efficiency measure in China and space-time differences. China Population, Resources and Environment, 2016, 26(6): 11-19. (in Chinese) | |
| [27] |
蒋黎, 王晓君. 环境质量与农业经济增长的内在关系探讨: 基于我国31个省区面板数据的EKC分析. 农业经济问题, 2019, 40(12): 43-51. doi:10.13246/j.cnki.iae.2019.12.005.
doi: 10.13246/j.cnki.iae.2019.12.005 |
|
JIANG L, WANG X J. EKC hypothesis verification between rural environmental quality and agricultural economic growth in China—an empirical analysis based on panel data of 31 provinces. Issues in Agricultural Economy, 2019, 40(12): 43-51. doi:10.13246/j.cnki.iae.2019.12.005. (in Chinese)
doi: 10.13246/j.cnki.iae.2019.12.005 |
|
| [28] | 曹俊文, 曾康. 低碳视角下长江经济带农业生态效率及影响因素研究. 生态经济, 2019, 35(8): 115-119, 127. |
| CAO J W, ZENG K. Study on agricultural eco-efficiency and its influencing factors in the Yangtze River economic belt from the perspective of low carbon. Ecological Economy, 2019, 35(8): 115-119, 127. (in Chinese) | |
| [29] | 方琳, 吴凤平, 王新华, 余燕团. 基于共同前沿SBM模型的农业用水效率测度及改善潜力. 长江流域资源与环境, 2018, 27(10): 2293-2304. |
| FANG L, WU F P, WANG X H, YU Y T. Analysis of agricultural water efficiency measurement and improvement potential based on meta frontier SBM model. Resources and Environment in the Yangtze Basin, 2018, 27(10): 2293-2304. (in Chinese) | |
| [30] | 李慧明. 内外均衡, 一体循环: 循环经济的经济学思考: 国家社会科学基金重大项目:“经济发展和生态环境保护双赢的循环经济深入发展研究”成果之一. 天津: 天津人民出版社, 2007: 128-130. |
| LI H M. Internal and External Balance, Integrated Circulation—— Economic Thinking on Circular Economy. Beijing: Tianjin: Tianjin People's Publishing House, 2007: 128-130. (in Chinese) |
| No related articles found! |
|
||