智能手机原位牧草生物量估算
陶海玉( ),张爱武(),庞海洋,康孝岩
),张爱武(),庞海洋,康孝岩
Smart-Phone Application in Situ Grassland Biomass Estimation
HaiYu TAO(),AiWu ZHANG(),HaiYang PANG,XiaoYan KANG
),AiWu ZHANG(),HaiYang PANG,XiaoYan KANG
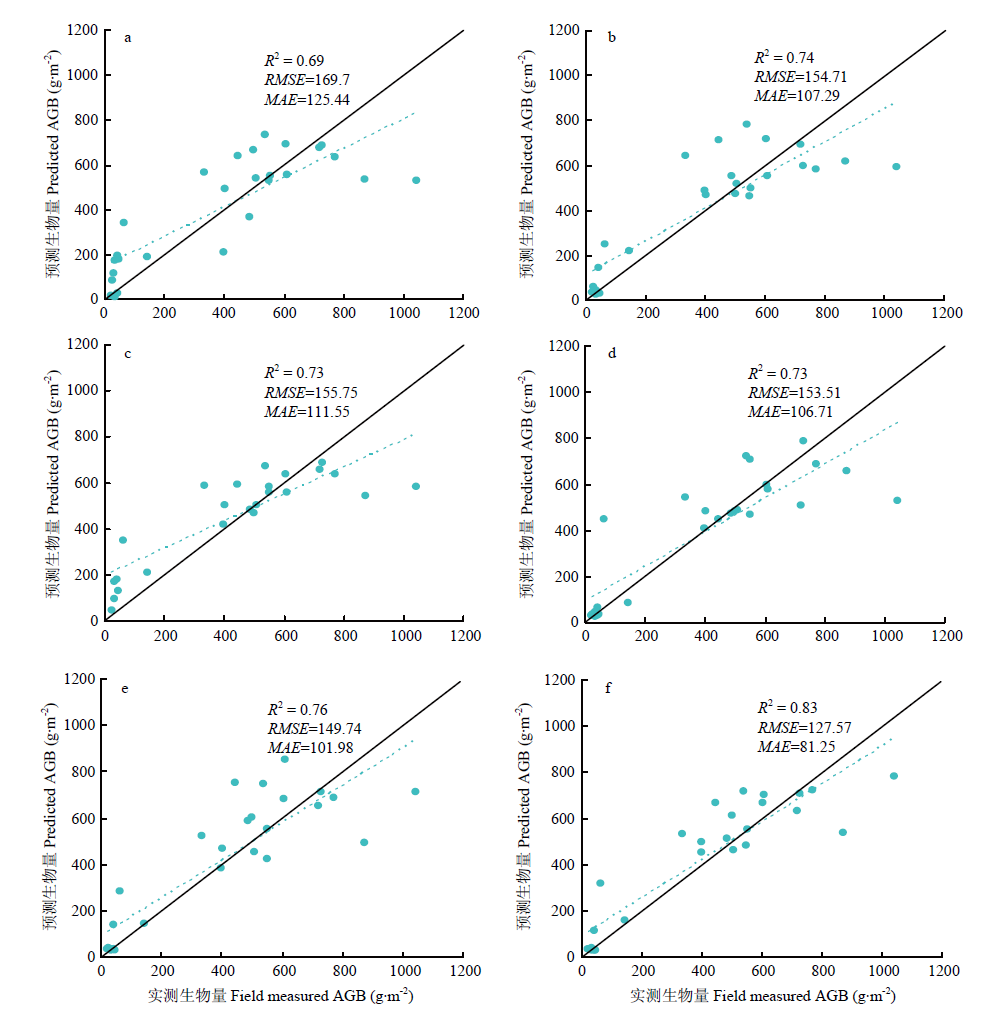
图5. 6组试验实际值和预测值对比
(a)原始植被指数模型,(b)原始纹理特征模型,(c)原始联合植被指数-纹理特征模型,(d)XGB-SFS特征选择植被指数模型,(e)XGB-SFS特征选择纹理特征模型,(f)XGB-SFS特征选择联合植被指数-纹理特征模型。下同
Fig. 5. Comparison of measured and predicted values in six experiments
(a) RGBVIs, (b)Textures, (c)VI-Textures, (d)Selected RGBVIs, (e)Selected Textures, (f)Selected VI-Textures. The same as below