旱作种植条件下基础地力贡献率演变特征及影响因素分析
Evolution Characteristics and Influencing Factors on Inherent Soil Productivity Across Dryland
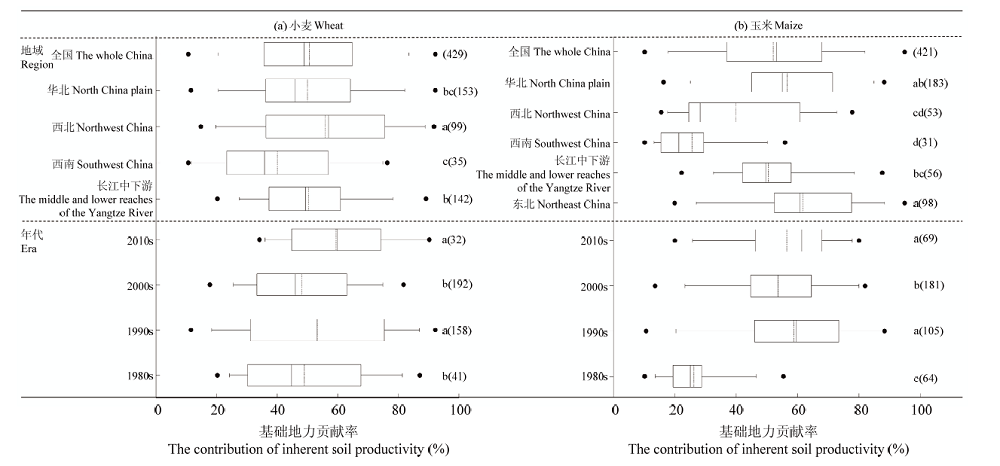
矩形盒的左右边缘线分别代表全部数据的25%和75%,箱型图的左边缘线和右边缘线分别代表全部数据的5%和95%,左右实心点为除异常值外的最小值和最大值。盒中实线代表中值,虚线代表平均值;右实心点旁的不同字母表示中位值差异显著(P<0.05),括号数字表示该处理有基础地力贡献率数据的个数。下同
The lower and upper boundaries,bars,and dots in or outside the boxes indicate 25% and 75%, 5% and 95%, the minimum and maximum besides the vertical outliers of the data. The solid and dashed lines represent the median and mean value. Different letters indicate significant differences (P<0.05) in median mean value. Numbers of observations are shown in parenthesis. The same as below