甜瓜幼果果皮颜色基因GR的精细定位
许昕阳( ),沈佳,张跃建,李国景,牛晓伟,寿伟松()
),沈佳,张跃建,李国景,牛晓伟,寿伟松()
Fine Mapping of an Immature Rind Color Gene GR in Melon
XU XinYang(),SHEN Jia,ZHANG YueJian,LI GuoJing,NIU XiaoWei,SHOU WeiSong()
),SHEN Jia,ZHANG YueJian,LI GuoJing,NIU XiaoWei,SHOU WeiSong()
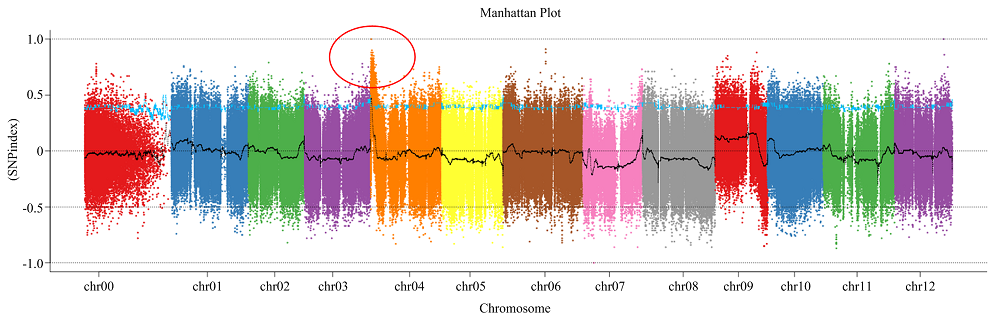
图2. GR的初定位(红圈代表目的区段)
Fig. 2. Manhattan plot for mapping of GR (The red circle is the target interval)