),韩露,谢建国,潘文婧,张泽鑫,辛大伟,刘春燕,陈庆山(),齐照明()
),HAN Lu,XIE JianGuo,PAN WenJing,ZHANG ZeXin,XIN DaWei,LIU ChunYan,CHEN QingShan(),QI ZhaoMing()
),韩露,谢建国,潘文婧,张泽鑫,辛大伟,刘春燕,陈庆山(),齐照明()
),HAN Lu,XIE JianGuo,PAN WenJing,ZHANG ZeXin,XIN DaWei,LIU ChunYan,CHEN QingShan(),QI ZhaoMing()
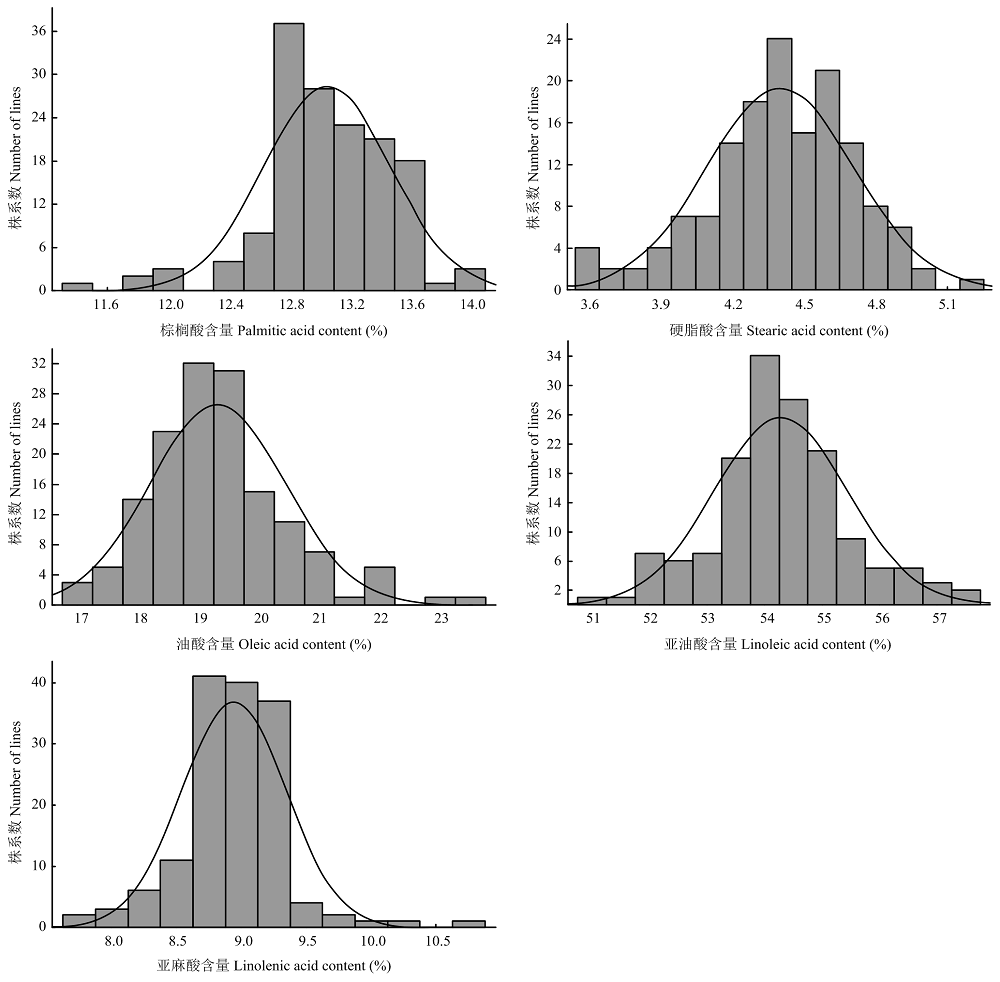
图1. 2017年RILs群体中5种脂肪酸含量分布直方图
X轴代表脂肪酸各组分所占总油分的百分比,Y轴代表每个脂肪酸各组分所占总油分百分比的株系数,黑色实线表示RILs群体的正常曲线。2018年RILs群体的5种脂肪酸含量频率分布与2017年的结果相同,呈现连续正态分布,所以在这里仅展示了2017年的结果。下同
Fig. 1. Distribution histogram of the 5 fatty acids content in the RILs population in 2017
The X-axis represents the percentage of each fatty acid component to the total oil content, the Y-axis represents the plant coefficient of the percentage of each fatty acid component in the total oil content, and the black solid line represents the normal curve of the RILs population. The frequency distribution of the five fatty acid content of the RILs population in 2018 is the same as the 2017 results, showing continuous normal distribution, so only the 2017 results are shown here. The same as below