发芽及挤压膨化对糙米挥发性风味物质的影响
陈焱芳( ),张名位,张雁(),邓媛元,魏振承,唐小俊,刘光,李萍
),张名位,张雁(),邓媛元,魏振承,唐小俊,刘光,李萍
Effects of Germination and Extrusion on Volatile Flavor Compounds in Brown Rice
CHEN YanFang(),ZHANG MingWei,ZHANG Yan(),DENG YuanYuan,WEI ZhenCheng,TANG XiaoJun,LIU Guang,LI Ping
),ZHANG MingWei,ZHANG Yan(),DENG YuanYuan,WEI ZhenCheng,TANG XiaoJun,LIU Guang,LI Ping
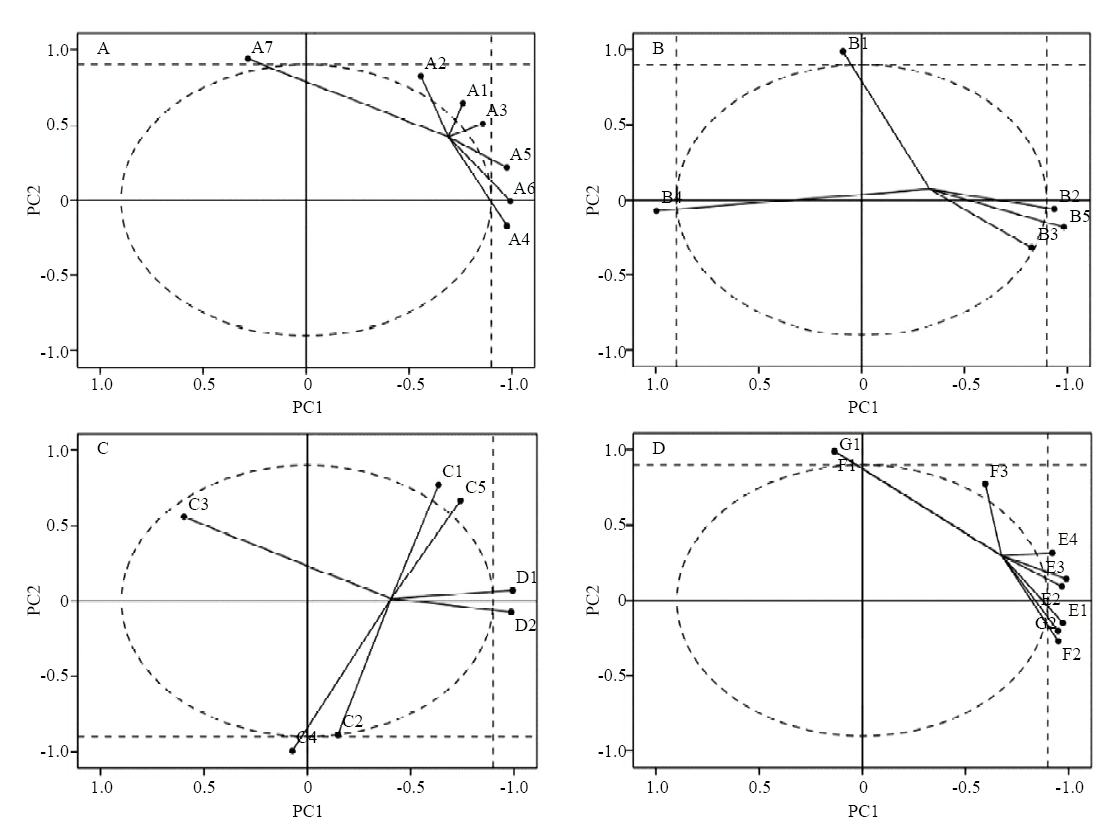
图1. 糙米样品挥发性风味化合物载荷图
A:醛类化合物在PC1及PC2上的负载量图;B:醇类化合物在PC1及PC2上的负载量图;C:萜烯类与酯类化合物在PC1及PC2上的负载量图;D:其他化合物在PC1及PC2上的负载量图。图中编号含义同
Fig. 1. Loading plot of volatile flavor compounds PCA model from brown rice samples
A: Loading plot of PC1 vs. PC2 corresponding to aldehydes PCA model from brown rice samples; B: Loading plot of PC1 vs. PC2 corresponding to alcohols PCA model from brown rice samples; C: Loading plot of PC1 vs. PC2 corresponding to terpenes and esters PCA model from brown rice samples; D: Loading plot of PC1 vs. PC2 corresponding to other compounds PCA model from brown rice samples. The meaning of numbers in the figure is the same as table 1 (e.g. “A1” stands for “Butanal, 3-methyl-”)