牛卵泡AGTR2序列结构及表达特性分析
Sequence Structure and Expression Characteristics Analysis of AGTR2 in Bovine Follicle
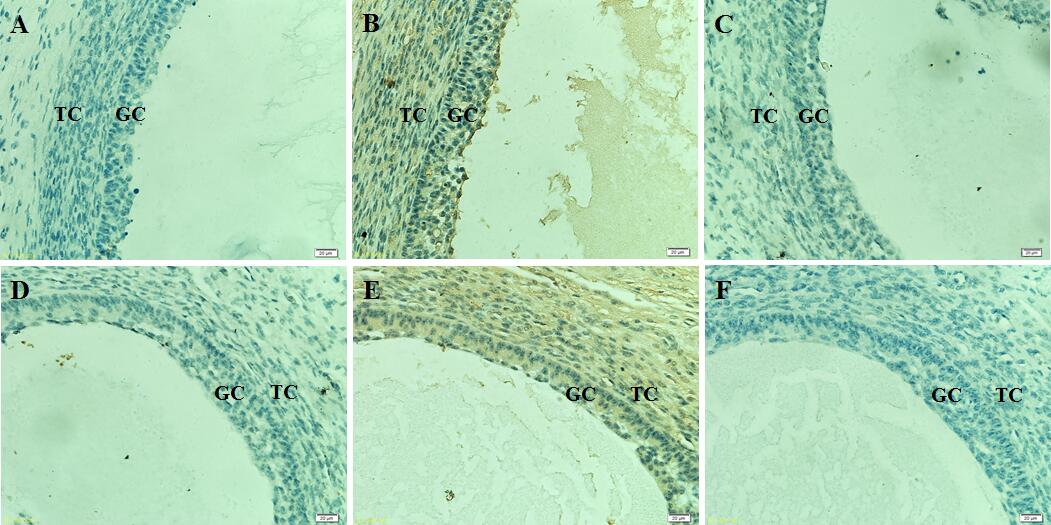
图7. AGTR2在牛DF与SF的免疫组化分析
A、B、C分别为优势卵泡阳性对照组、试验组和阴性对照组;D、E、F分别为从属卵泡阳性对照组、试验组和阴性对照组;GC:颗粒细胞;TC:膜细胞;比例尺20 μm
Fig. 7. Immunohistochemical analysis of AGTR2 in bovine DF vs. SF (400×)
A, B, C: Control group, experiment group and negative control group of DF, respectively; D, E, F: Control group, experiment group and negative control group of SF, respectively; GC: Granulosa cells; TC: Theca cells; Scale 20 μm