图3. 差异表达lncRNA分析
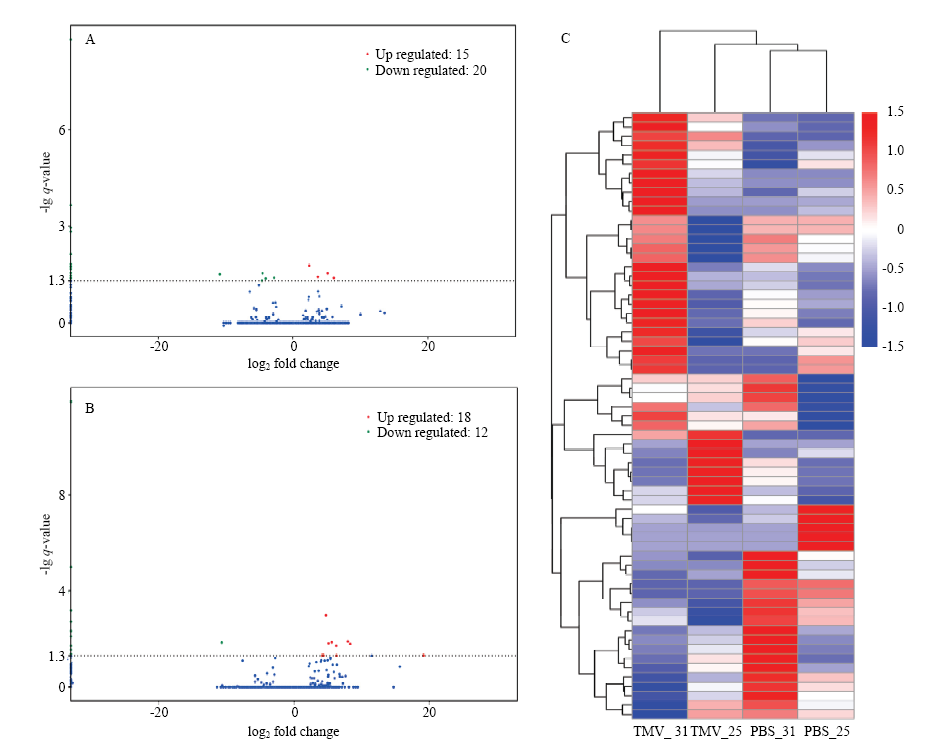
A:25℃差异表达lncRNA火山图,横坐标代表转录本在不同样本中表达倍数变化,纵坐标代表转录本表达量变化差异的统计学显著性,q-value即P-adjust;图中红色点表示有显著性差异表达的上调转录本,蓝色点表示有显著性差异表达的下调转录本Volcano plot of differentially expressed lncRNAs at 25℃. The abscissa represents expression fold change in different samples, the ordinate represents the statistical significance of difference in transcript expression, and the q-value is P-adjust. The red dot in the figure indicates the up-regulated transcript with significant differential expression, and the blue dot indicates the down-regulated transcript with significant differential expression;B:31℃差异表达lncRNA火山图Volcano plot of differentially expressed lncRNAs at 31℃。C:差异表达lncRNA表达量层次聚类,以 lg (FPKM+1) 值进行聚类,红色代表基因高表达,蓝色表示低表达基因,颜色从红到蓝表示lg (FPKM+1)从大到小DElncRNA expression level hierarchical clustering, clustering was performed with lg (FPKM+1) values, with red representing high expression of genes and blue indicating low expressed genes, colors from red to blue indicate lg (FPKM+1) from large to small
Fig. 3. DElncRNA analysis