不同饲料效率与绵羊瘤胃组织形态学关系
张德印1( ),张小雪1,李发弟1,2,李冲1,2,李国泽1,张煜坤1,李晓龙1,宋其志1,赵源1,刘晓青1,马亮强1,王维民1()
),张小雪1,李发弟1,2,李冲1,2,李国泽1,张煜坤1,李晓龙1,宋其志1,赵源1,刘晓青1,马亮强1,王维民1()
Association of Rumen Histomorphology of Sheep with Different Feed Efficiencies
ZHANG DeYin1(),ZHANG XiaoXue1,LI FaDi1,2,LI Chong1,2,LI GuoZe1,ZHANG YuKun1,LI XiaoLong1,SONG QiZhi1,ZHAO Yuan1,LIU XiaoQing1,MA LiangQiang1,WANG WeiMin1()
),ZHANG XiaoXue1,LI FaDi1,2,LI Chong1,2,LI GuoZe1,ZHANG YuKun1,LI XiaoLong1,SONG QiZhi1,ZHAO Yuan1,LIU XiaoQing1,MA LiangQiang1,WANG WeiMin1()
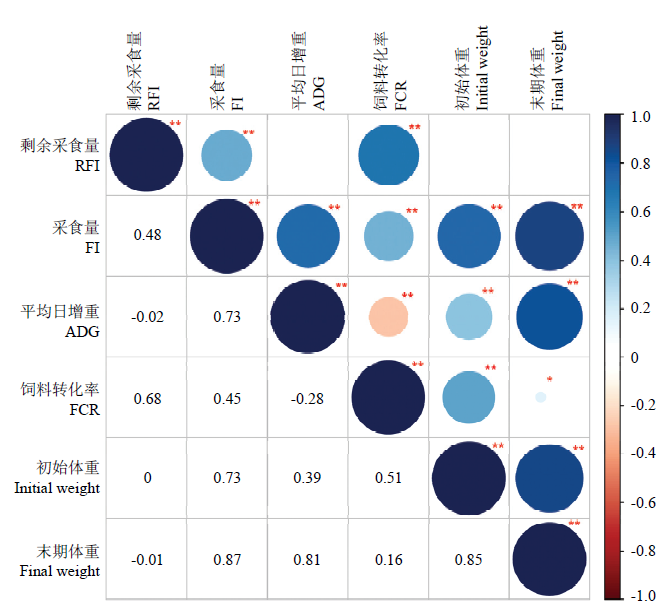
图1. 饲料效率相关性状的相关性分析
每个圆的大小表示相关系数的绝对值。蓝色和红色梯度分别表示正相关或负相关。**表示差异极显著(P<0.01),*表示差异显著(P<0.05)
Fig. 1. Correlation coefficient between feed efficiency traits
The size of each circular indicates the absolute value of the correlation coefficient. The blue and red gradients indicate positive or negative correlation, respectively. ** means very difference significantly (P<0.01), * means significantly difference (P<0.05)