水稻灌浆期穗颈瘟发生对产量及茎节代谢产物的影响
潘争艳1,2( ),刘博1,蒋洪波1,姚继攀1,白元俊1(),徐正进2()
),刘博1,蒋洪波1,姚继攀1,白元俊1(),徐正进2()
Effect of Panicle Neck Blast on Grain Yield and Stem Node Metabolites at the Rice Filling Stage
PAN ZhengYan1,2(),LIU Bo1,JIANG HongBo1,YAO JiPan1,BAI YuanJun1(),XU ZhengJin2()
),LIU Bo1,JIANG HongBo1,YAO JiPan1,BAI YuanJun1(),XU ZhengJin2()
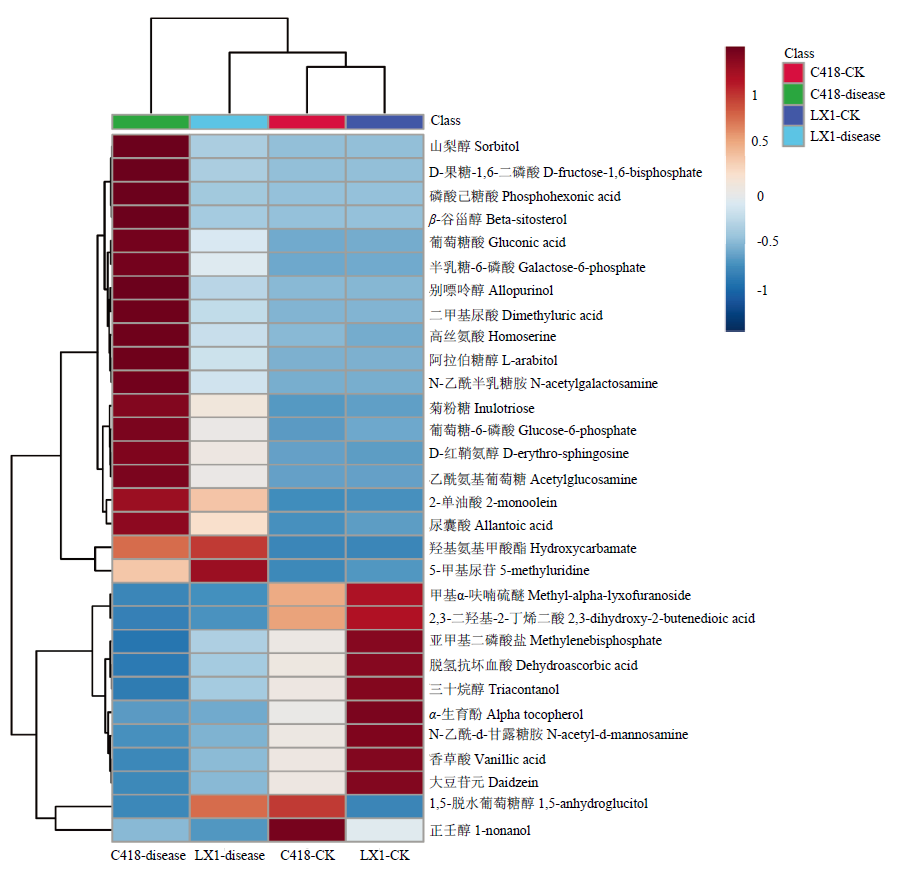
图2. 差异代谢产物层次聚类分析生成的热图
聚类分析采用质心法和欧氏距离法,红色矩形表示代谢物含量显著上调,蓝色矩形代表代谢物含量的显著下调。
Fig. 2. Hierarchical cluster analysis of differential metabolites resulting in thermal energy maps
Centroid method and euclidean distance method are used for cluster analysis. The red rectangle indicates that the metabolite content is significantly up-regulated and the blue rectangle indicates the significant down-regulation of the metabolite content. The same as