基于代谢组学的‘云抗10号’晒青茶加工过程代谢物变化
戴宇樵1,2,吕才有1( ),何鲁南1,易超1,刘学艳1,黄雯1,陈加敏1
),何鲁南1,易超1,刘学艳1,黄雯1,陈加敏1
Metabolic Changes in the Processing of Yunkang 10 Sun-Dried Green Tea based on Metabolomics
DAI YuQiao1,2,Lü CaiYou1(),HE LuNan1,YI Chao1,LIU XueYan1,HUANG Wen1,CHEN JiaMin1
),HE LuNan1,YI Chao1,LIU XueYan1,HUANG Wen1,CHEN JiaMin1
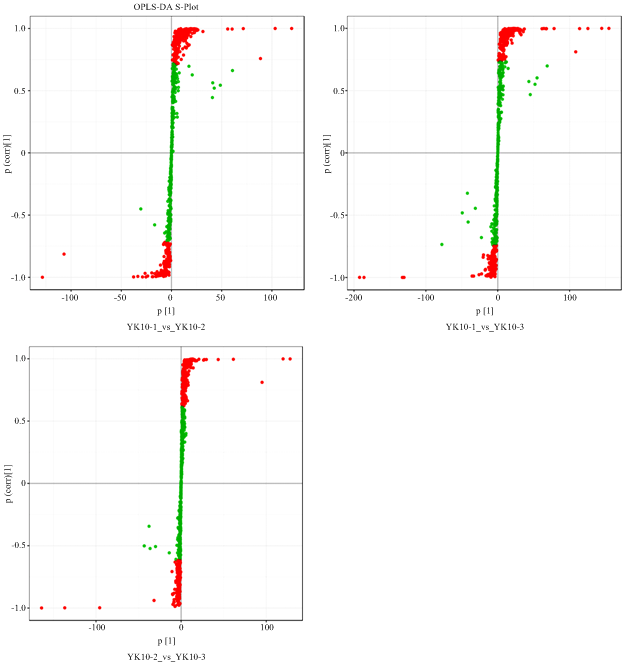
图4. 组间OPLS-DA S点图
图中红色表示VIP≥1的代谢物,绿色表示VIP<1的代谢物 Red represents the metabolites with VIP≥1, and green represents the metabolites with VIP<1
Fig. 4. OPLS-DAS-plot between two groups