基于高密度遗传图谱定位水稻籽粒大小相关性状QTL
张健,杨靖,王豪,李冬秀,杨瑰丽,黄翠红,周丹华,郭涛,陈志强,王慧( )
)
)
QTL Mapping for Grain Size Related Traits Based on a High-Density Map in Rice
ZHANG Jian,YANG Jing,WANG Hao,LI DongXiu,YANG GuiLi,HUANG CuiHong,ZHOU DanHua,GUO Tao,CHEN ZhiQiang,WANG Hui()
)
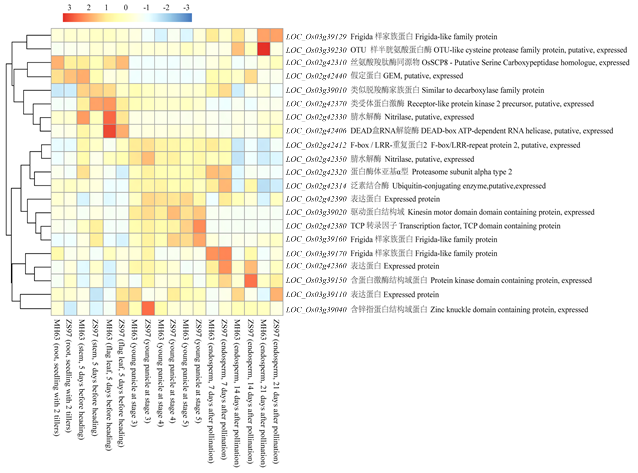
图4. qGS2和qGS3-1定位区间基因注释和表达谱分析
图中蓝色越深代表其表达量越低,红色越深则表达量越高,基因名称后面为其基因注释信息
Fig. 4. Annotation and expression profiling of genes in qGS2 and qGS3-1 locus
The expression level of each sample is printed as deep blue representing the lowest value to deep red representing the highest value in the heat map. The gene names are followed closely by their annotation information