转录组学分析意大利蜜蜂脑部哺育行为相关基因
高艳( ),朱雅楠,李秋方,苏松坤(),聂红毅()
),朱雅楠,李秋方,苏松坤(),聂红毅()
Transcriptomic Analysis of Genes Related to Nursing Behavior in the Brains of Apis mellifera ligustica
GAO Yan(),ZHU YaNan,LI QiuFang,SU SongKun(),NIE HongYi()
),ZHU YaNan,LI QiuFang,SU SongKun(),NIE HongYi()
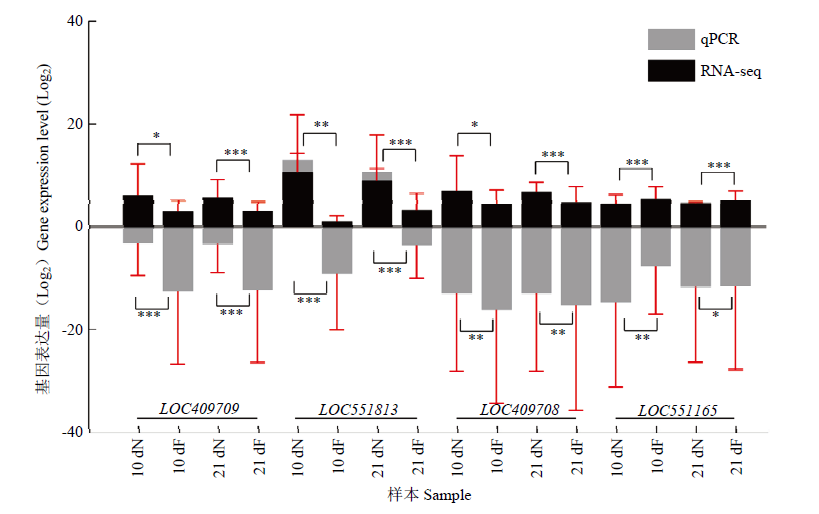
图3. 转录组数据的qPCR验证
黑色柱状图表示RNA-seq数据中基因的FPKM值,灰色表示qPCR数据中基因的相对表达量,纵坐标均为相应取过以2为底的对数值The black bar graph represents the FPKM value of the gene in the RNA-seq data, and the gray represents the relative expression of genes in the qPCR data; the ordinates are the corresponding logarithmic values with a base of 2。图中数据为平均值±标准误,采用单因素方差分析 Data in the figure are the mean±SE, One-way ANOVA. *P<0.05; **P<0.01; ***P<0.001
Fig. 3. qPCR validation of transcriptome data