谷子萌发吸水期关键代谢途径的筛选与分析
余爱丽( ),赵晋锋(),成锴,王振华,张鹏,刘鑫,田岗,赵太存,王玉文()
),赵晋锋(),成锴,王振华,张鹏,刘鑫,田岗,赵太存,王玉文()
Screening and Analysis of Key Metabolic Pathways in Foxtail Millet During Different Water Uptake Phases of Germination
YU AiLi(),ZHAO JinFeng(),CHENG Kai,WANG ZhenHua,ZHANG Peng,LIU Xin,TIAN Gang,ZHAO TaiCun,WANG YuWen()
),ZHAO JinFeng(),CHENG Kai,WANG ZhenHua,ZHANG Peng,LIU Xin,TIAN Gang,ZHAO TaiCun,WANG YuWen()
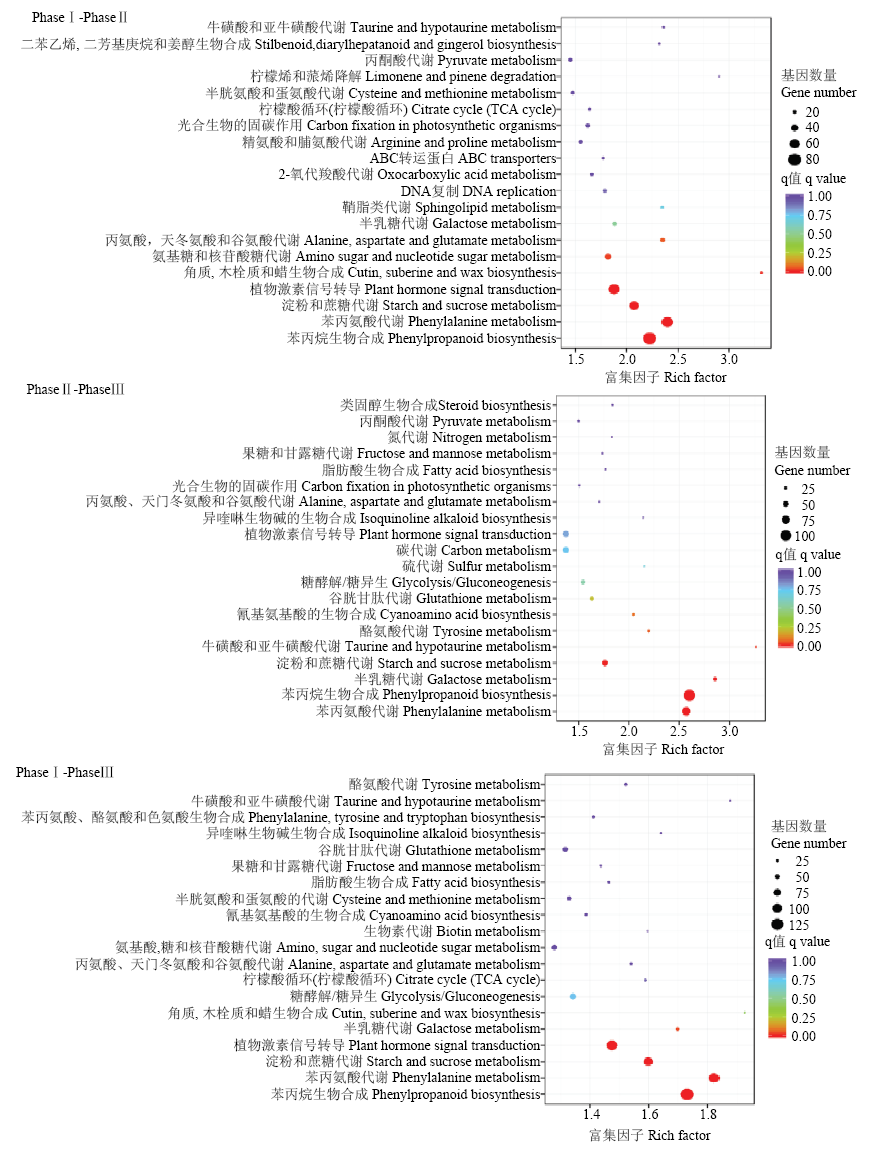
图4. 差异表达基因KEGG通路富集图
横坐标为富集因子(Rich Factor),表示差异表达基因中注释到某通路的基因比例与所有基因中注释到该通路的基因比例的比值。纵坐标表示通路名称;圆圈的大小表示通路中富集的基因数目,圆圈越大,表示基因越多;圆圈的颜色代表q value
Fig. 4. KEGG enrichment map of DEGs
The x-axis indicated rich factor of DEGs,which represent percentages of DEGs belong to the corresponding pathway. The left y-axis represented the pathways. The sizes of bubble represent the number of DEGs in the corresponding pathway, and the colors of the bubble represent the enrichment q value of the corresponding pathway