江苏省水稻减肥增产的潜力与机制分析
郭俊杰,柴以潇,李玲,高丽敏,谢凯柳,凌宁,郭世伟( )
)
)
The Potential and Related Mechanisms of Increasing Rice Yield by Reducing Chemical Nitrogen Application in Jiangsu Province
GUO JunJie,CHAI YiXiao,LI Ling,GAO LiMin,XIE KaiLiu,LING Ning,GUO ShiWei()
)
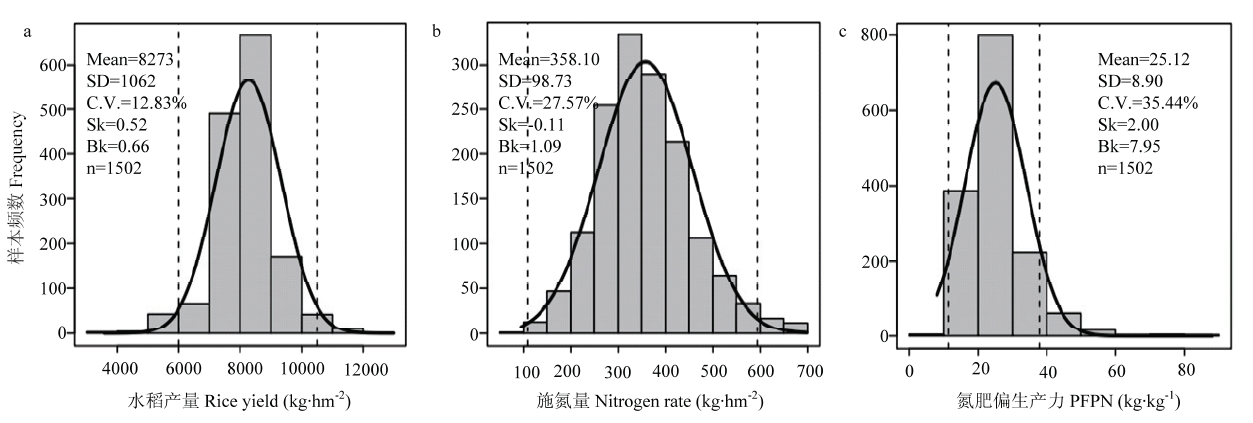
图1. 江苏省农户水稻产量(a)、施氮量(b)、氮肥偏生产力(c)的分布
曲线表示数据的正态分布,虚线表示数据的上、下内限(即上、下四分位至1.5倍四分位距的点的值),Mean表示数据的算术平均值,SD表示数据的标准差,C.V.表示数据的变异系数,Sk表示数据的偏度,Bk表示数据的峰度,n表示数据的样本量
Fig. 1. Distribution of rice yield (a), nitrogen rate (b) and PFPN (c) of farmer’s practice in Jiangsu Province
The solid line is normal distribution, and the dashed line is the upper and lower limit lines of data. The value of Mean, SD, C.V., Sk, Bk and n denote the mean, standard deviation, variable coefficient, skewness, kurtosis and sample numbers of data, respectively