),郭宁3,马常宝4,李春花1(),徐明岗1,邹国元2
),Ning GUO3,ChangBao MA4,ChunHua LI1(),MingGang XU1,GuoYuan ZOU2
),郭宁3,马常宝4,李春花1(),徐明岗1,邹国元2
),Ning GUO3,ChangBao MA4,ChunHua LI1(),MingGang XU1,GuoYuan ZOU2
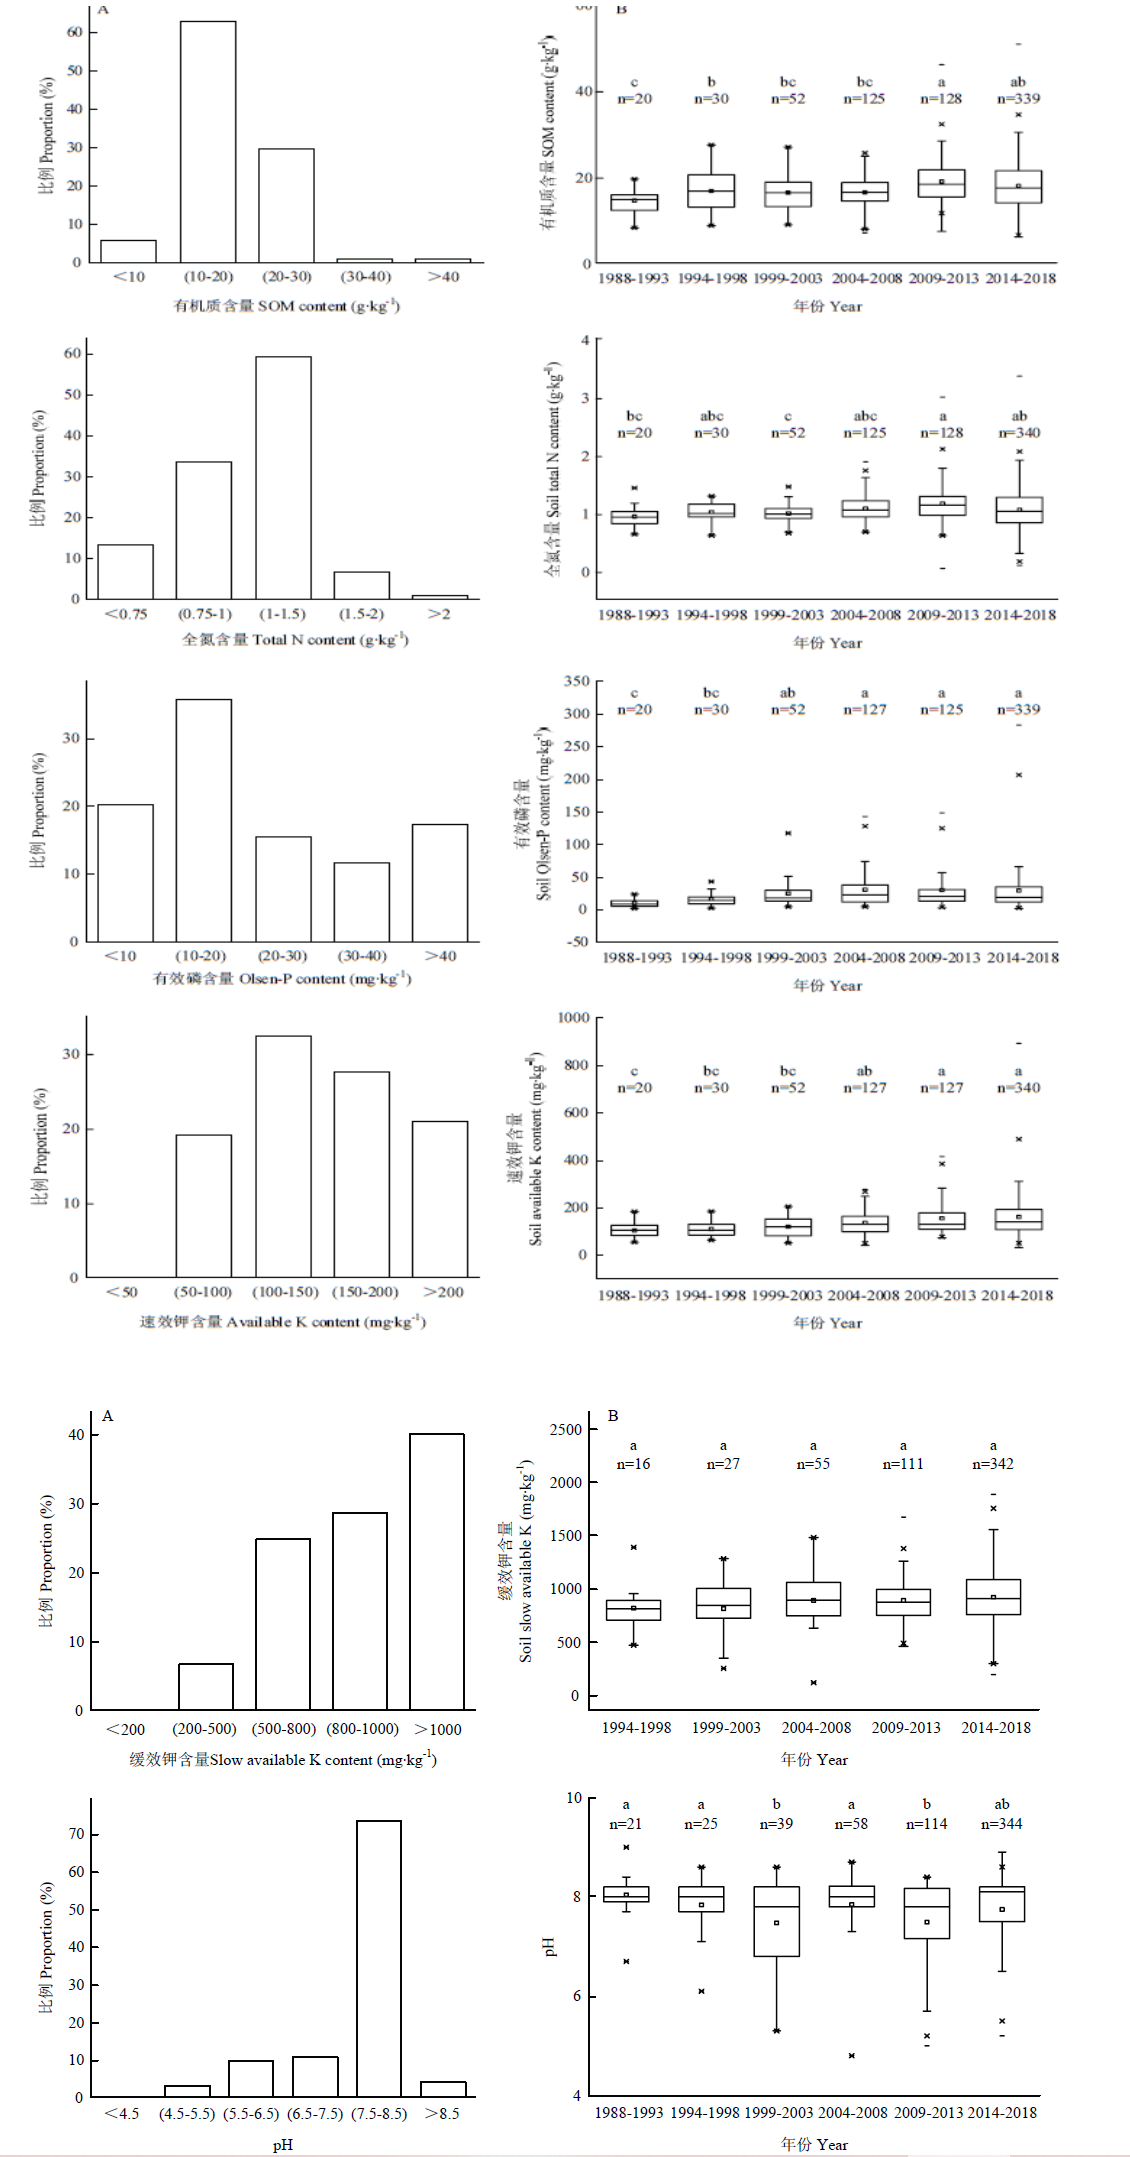
图1. 常规肥力指标的现状及演变
箱式图内,中间实线代表中位数,空心圆圈代表平均值,箱子下边缘线和上边缘线分别代表下四分位数和上四分位数,星号代表异常值。不同小写字母表示不同监测时期差异显著(P<0.05)。下同。A列为各肥力指标2018年的现状,即各区间监测点的比例,B列为各肥力指标的演变
Fig. 1. Content and evolution of conventional fertility indexes
Solid line in box represents the median, the hollow circle represents the average value, the bottom edge line and the upper edge line represent the lower quartile and the upper quartile respectively, and the asterisk represents the abnormal value. Lowercase indicates the difference significance among different monitoring periods at the 0.05 level. The following is the same as this. A is listed as the present situation of each fertility index in 2018, which is the proportion of monitoring points in each interval, and B is listed as the evolution of each fertility index